 Evan Lee Salim

In the high-stakes environment of digital optimization, conversion rate optimization (CRO) teams frequently encounter a phenomenon where a seemingly successful experiment fails to yield the predicted revenue after being implemented. A typical scenario involves a team running an A/B/n test featuring one control and four variations, while simultaneously tracking three distinct success metrics for each layout. When a specific metric on one variant achieves a p-value of 0.04, the team often declares a winner and proceeds with a full-scale rollout. However, the anticipated gains often vanish because the team fell victim to the multiple comparison problem, an invisible statistical trap that significantly inflates the probability of false positives.
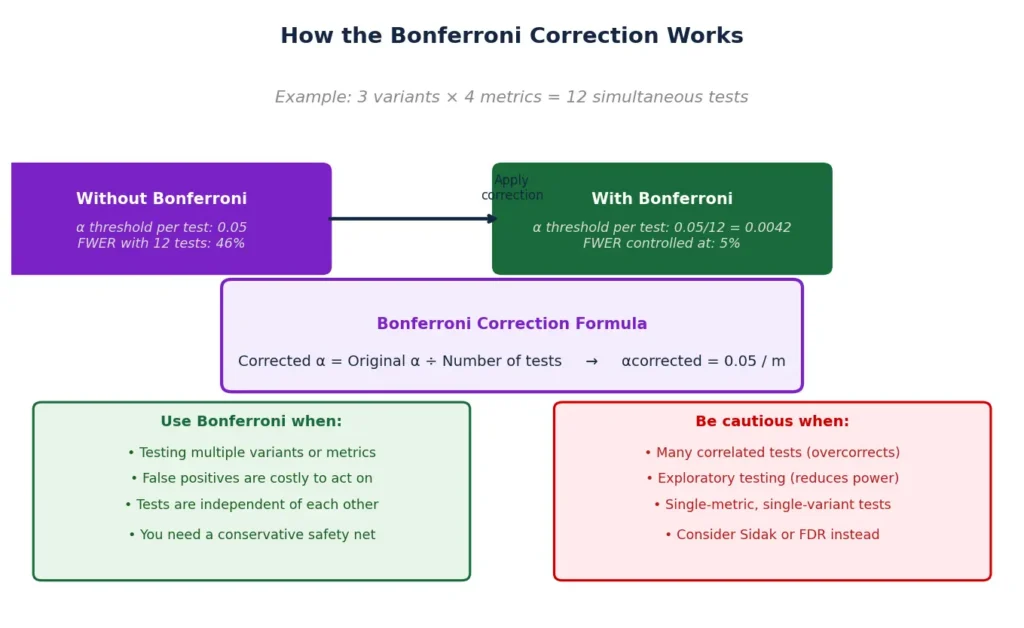
By tracking three metrics across four variants, the team was essentially performing 12 separate comparisons. If each test is conducted at a standard 5% significance threshold, the probability of encountering at least one false positive—even if none of the changes actually have a real-world effect—rises to approximately 46%. To mitigate this risk, statisticians utilize the Bonferroni correction, a method that applies a more stringent significance bar across a planned family of comparisons. While this correction reduces the likelihood of false positives, it requires a nuanced understanding of statistical power and experimental design to be used effectively.

The Statistical Foundation of the Multiple Comparison Problem
The core of experimental testing revolves around the significance threshold, or alpha (α), which is conventionally set at 0.05. This value represents the risk an experimenter is willing to accept for a Type I error—a false positive where the researcher concludes a difference exists when it does not. In a single-comparison test, a 5% risk is generally considered acceptable. The problem arises when multiple comparisons are made within the same experiment, as each additional test provides another opportunity for random noise to be mistaken for a significant signal.
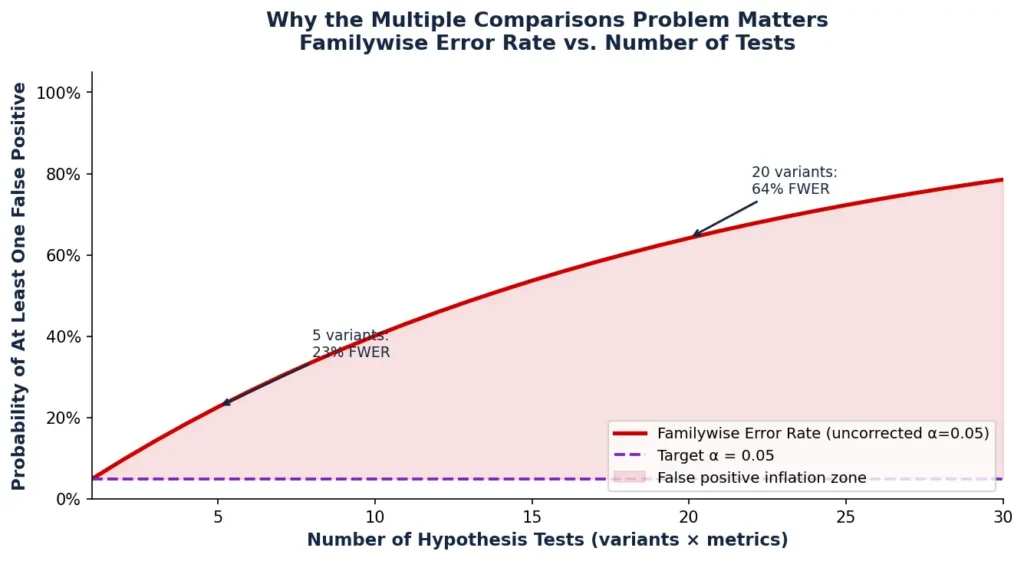
Statisticians quantify this cumulative risk as the Family-Wise Error Rate (FWER). The FWER is the probability of making at least one Type I error among a group (or "family") of tests. When tests are independent, the FWER is calculated using the formula: FWER = 1 – (1 – α)^m, where ‘m’ represents the number of comparisons.
Data illustrates how rapidly this risk escalates. With five independent comparisons at a 0.05 alpha, the FWER climbs to 23%. At 10 comparisons, the risk of a false positive is 40%. By the time an experimenter reaches 20 comparisons, there is a 64% chance that at least one result will appear significant purely by chance. In large-scale exploratory data mining involving 100 comparisons, the probability of a false positive becomes near-certain at 99.4%. This mathematical reality underscores why "peeking" at data or tracking dozens of metrics without adjustment leads to unreliable business decisions.

Mechanics of the Bonferroni Correction
The Bonferroni correction, named after the Italian mathematician Carlo Emilio Bonferroni, offers a straightforward mathematical solution to the FWER problem. To maintain the overall significance level of an experiment, the original alpha is divided by the total number of comparisons.
The formula is expressed as: α_new = α_original / m.
For an experiment involving one control, three variants, and two primary metrics, the total number of comparisons is six (3 variants × 2 metrics). To maintain a 5% risk of a false positive across the entire experiment, the new significance threshold for each individual comparison becomes 0.0083 (0.05 / 6). Consequently, any result must achieve a p-value lower than 0.0083 to be considered statistically significant.
An alternative way to apply this is by adjusting the p-values themselves: Adjusted p-value = Original p-value × m. If the adjusted p-value remains below the original 0.05 threshold, the result is deemed significant. Both methods are mathematically equivalent and serve to ensure that the cumulative risk of error does not exceed the intended alpha.
Historical Context and the Evolution of Significance
The concept of statistical significance dates back to the work of Ronald A. Fisher in the 1920s, who popularized the 0.05 threshold in agricultural research. However, the move toward digital experimentation has fundamentally changed the scale and speed of testing. In traditional laboratory settings, researchers often tested a single hypothesis. In the modern SaaS and e-commerce landscape, tools allow for the simultaneous testing of dozens of variables.
The Bonferroni correction gained prominence in the mid-20th century as researchers in fields like psychology and medicine realized that "data dredging"—the practice of searching through large datasets for any significant relationship—was leading to a replication crisis. By the 1960s and 70s, the correction became a standard tool for confirmatory research, ensuring that when a scientist claimed a discovery, it was backed by evidence that accounted for the breadth of the search.
Strategic Application: When to Use Bonferroni
While the Bonferroni correction is a powerful tool for maintaining integrity, it is highly conservative. Applying it indiscriminately can lead to Type II errors, or false negatives, where a genuine improvement is rejected because it failed to meet an excessively high bar. Experts suggest its use in specific "confirmatory" contexts:
- High-Risk Rollouts: If a false positive would result in an expensive or irreversible engineering change, a stricter threshold is necessary.
- Multiple Treatment Groups: In A/B/n testing where several variations are compared against a single control, the risk of one variant winning by chance is high.
- Primary Metric Clusters: When an experiment relies on multiple primary KPIs—such as conversion rate and revenue per visitor—and a "win" on any one of them triggers a rollout.
- Confirmatory Testing: When the goal is to validate a specific hypothesis derived from previous exploratory research.
Comparative Analysis of Correction Methods
Because the standard Bonferroni correction is often criticized for being too "punishing" and reducing statistical power, several alternatives have been developed to balance error control with discovery.
Holm-Bonferroni Method
The Holm-Bonferroni method is a sequential "step-down" procedure. It ranks p-values from smallest to largest and applies a varying threshold. The smallest p-value is tested against α/m, the next against α/(m-1), and so on. This method is more powerful than the standard Bonferroni because it relaxes the threshold as it moves through the results, yet it still provides strong control over the FWER.

Benjamini-Hochberg (BH) Procedure
Unlike Bonferroni, which controls the FWER (the chance of any false positive), the Benjamini-Hochberg procedure controls the False Discovery Rate (FDR). The FDR is the expected proportion of false positives among all significant results. This is often preferred in exploratory research where the cost of a false positive is lower than the cost of missing a potential breakthrough.
Dunnett’s Test
In many A/B tests, the primary interest is comparing several treatments specifically to a single control, rather than comparing the treatments to each other. Dunnett’s test is a specialized procedure that accounts for the shared correlation of the control group. It is less restrictive than Bonferroni and is considered the gold standard for A/B/n testing.
| Method | Goal | Strictness | Ideal Use Case |
|---|---|---|---|
| Bonferroni | Control FWER | Very High | High-risk, small sets of tests |
| Holm-Bonferroni | Control FWER | Moderate | Confirmatory testing |
| Benjamini-Hochberg | Control FDR | Low | Exploratory data mining |
| Dunnett’s | Control FWER | Low-Moderate | A/B/n testing vs. one control |
Broader Impact and Industry Implications
The misapplication of multiple comparison corrections has profound implications for business growth and product development. When organizations fail to account for these statistical realities, they often experience "regression to the mean," where the high conversion rates seen during a test disappear once the feature is live. This leads to wasted engineering resources and a lack of trust in data-driven decision-making.

Furthermore, the requirement for a stricter alpha directly impacts the necessary sample size. For a test to reach a significance level of 0.01 instead of 0.05, the required traffic can increase by 50% to 100% depending on the expected effect size. For many low-traffic websites, this makes Bonferroni-corrected testing nearly impossible within a reasonable timeframe. Consequently, teams must choose between running longer tests, accepting higher risks, or focusing on fewer, higher-impact variations.
In the current landscape of AI-driven optimization, where algorithms can generate hundreds of layout variations, the multiple comparison problem is more relevant than ever. Automated testing platforms are increasingly integrating these corrections into their backend logic to prevent "automated false positives."
Conclusion: Balancing Rigor and Agility
The Bonferroni correction remains a cornerstone of statistical rigor, serving as a vital guardrail against the deceptive nature of random chance. However, its conservative nature requires CRO professionals to be intentional about experimental design. By pre-defining primary metrics, limiting the number of variants, and choosing the appropriate correction method—whether it be Bonferroni for high-stakes validation or Benjamini-Hochberg for exploratory discovery—organizations can ensure that their "wins" are not just statistical artifacts, but genuine drivers of business value. As the field of digital experimentation matures, the ability to navigate these statistical nuances will distinguish truly data-driven organizations from those merely chasing noise.


 Ammar Sabilarrohman

 Layla Zulfa