The global mobile application landscape has reached a point of unprecedented saturation, with over 3.5 million apps available on the Google Play Store and roughly 2.2 million on the Apple App Store. In this hyper-competitive environment, the difference between a market leader and an abandoned project often rests on the precision of a developer’s analytics workflow. While nearly every mobile app professional currently utilizes some form of tracking, industry experts are identifying a fundamental flaw in traditional methodologies: an over-reliance on quantitative data at the expense of qualitative understanding. Quantitative analytics—the numerical tracking of downloads, active users, and churn rates—provides the "what" of user behavior but consistently fails to explain the "why." To bridge this gap, a new standard of "Qualitative Analytics" has emerged, utilizing tools like touch heatmaps and user session recordings to provide a holistic view of the user journey.
The Shift from Numerical Tracking to Behavioral Understanding
For the past decade, the standard for mobile success was measured through Key Performance Indicators (KPIs) such as Daily Active Users (DAU), Monthly Active Users (MAU), and average session duration. These metrics are essential for high-level reporting; they function as an early warning system. For instance, if a quantitative dashboard shows that 40% of users drop off at the registration screen, the developer knows there is a problem. However, numbers alone cannot specify if the drop-off is due to a technical bug, a confusing user interface (UI), or a request for too much personal information.
Qualitative analytics addresses this blind spot by focusing on the individual experience. By observing the actual interactions of a user, developers can identify the "friction points" that numerical data obscures. This transition represents a maturation of the industry, moving away from broad statistical generalizations toward a personalized understanding of user intent and frustration.
Technical Foundations: Touch Heatmaps and Session Recordings
The integration of qualitative data into the development lifecycle relies primarily on two sophisticated technological pillars: touch heatmaps and user session recordings.
Visualizing Interaction through Touch Heatmaps
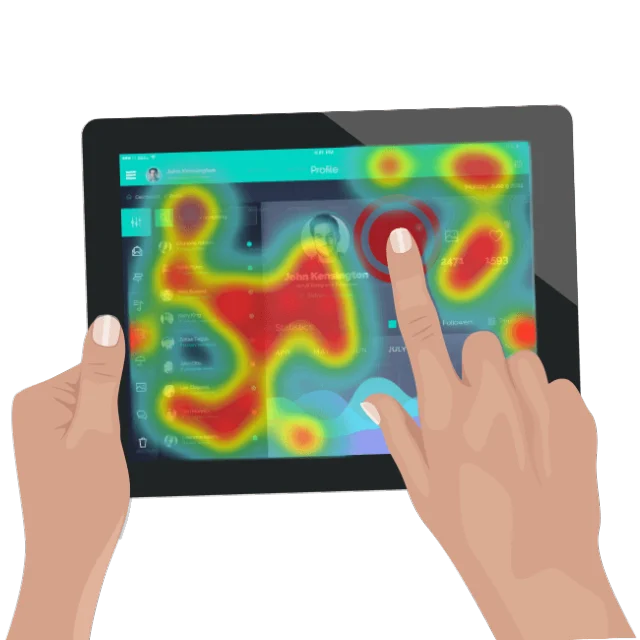
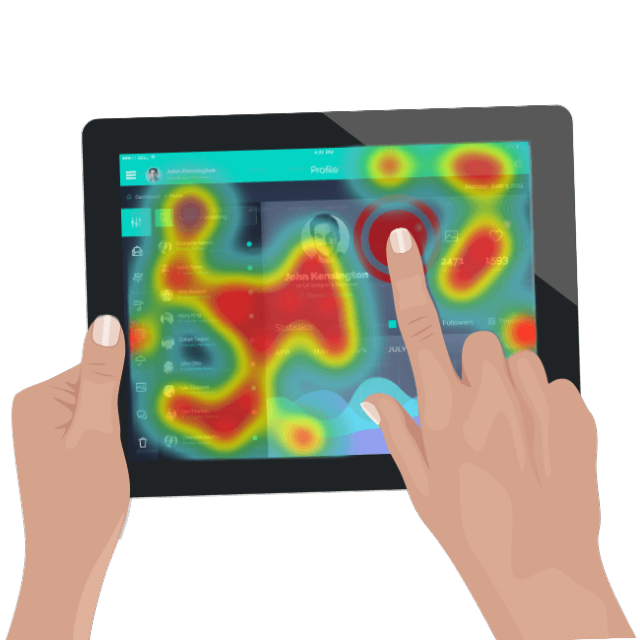
Touch heatmaps aggregate every gesture made by users—including taps, double-taps, swipes, and pinches—and overlay this data onto a visual representation of the app’s interface. This allows product teams to see which features are capturing attention and which are being ignored. Beyond simple popularity, heatmaps are vital for identifying "unresponsive gestures." These occur when a user taps an element—perhaps an image they believe is a button—and the app provides no feedback.
Industry data suggests that unresponsive gestures are a leading cause of "app rage," a state of user frustration that frequently leads to immediate uninstallation. By identifying these areas, designers can either make the element interactive or change the design to better manage user expectations, thereby aligning the app’s functionality with intuitive human behavior.
The Contextual Power of User Session Recordings
User session recordings provide a real-time, video-like playback of a user’s journey through the application. Unlike traditional screen recording, these tools typically capture the rendering of the UI, ensuring that the performance impact on the user’s device is negligible. These recordings offer an unbiased view of the user experience, capturing every sequence of events exactly as they happened.
When an app crashes, quantitative tools might provide a stack trace or a device model. A session recording, however, shows exactly what the user did in the five seconds leading up to the crash. This context is invaluable for Quality Assurance (QA) teams, as it allows them to reproduce complex bugs that would otherwise remain "ghosts" in the system.
A Chronology of Analytics Evolution
To understand the current state of the market, one must look at the timeline of how mobile data has been processed over the last 15 years:
- 2008–2011: The Infancy Era. Analytics were largely limited to download counts and basic crash logs. Developers had little visibility into what happened once the app was opened.
- 2012–2015: The Quantitative Explosion. Tools like Flurry, Mixpanel, and Google Analytics for Mobile brought event-based tracking to the forefront. Developers began tracking specific actions, such as "button clicks" or "level completions."
- 2016–2019: The Qualitative Emergence. Companies like Appsee (later acquired by ServiceNow) and FullStory pioneered the ability to "see" through the user’s eyes. The focus shifted to UX (User Experience) optimization.
- 2020–Present: The Integrated Era. The industry moved toward "Full-Stack Analytics," where quantitative and qualitative data are synchronized. Modern workflows now use numerical alerts to trigger qualitative investigations.
Data-Fueled Optimization: The Modern Workflow
The most effective mobile teams have moved away from viewing analytics as a monthly report and instead treat it as a continuous loop of "Alert, Investigate, and Resolve." This "Data-Fueled Optimization" utilizes quantitative data as the trigger and qualitative data as the diagnostic tool.
Consider the common issue of shopping cart abandonment in e-commerce apps. A quantitative report might show a high abandonment rate on the final payment page. Without qualitative insights, a team might spend weeks A/B testing different button colors or discount offers. However, by reviewing session recordings, the team might discover that the "CVV" help icon is overlapping the "Submit" button on smaller devices like the iPhone SE. This is a technical UI flaw that no amount of marketing-based A/B testing would solve. By fixing the layout, the developer resolves the issue permanently, a move backed by visual evidence rather than guesswork.
Proactive Troubleshooting and Technical Stability
Traditional troubleshooting is inherently reactive. Developers wait for a crash report or a negative App Store review before investigating a problem. Qualitative analytics allows for a "Proactive Troubleshooting" stance. By periodically reviewing heatmaps and recordings of new feature launches, developers can spot usability issues before they reach a critical mass of complaints.
For example, if a new update introduces a social media login feature that crashes only when a user has a specific privacy setting enabled, quantitative data might take days to reach a statistically significant threshold to trigger an alert. A developer watching sessions in the first hour of the launch would see the crash happen in real-time, allowing for a "hotfix" to be deployed before the majority of the user base even encounters the bug. This proactivity is essential for maintaining a high "App Quality Score," which directly influences search rankings in the App Store and Play Store.
Industry Reactions and Economic Implications
Market analysts and UX researchers have noted that the cost of acquiring a new user (CAC) has risen by over 50% in the last five years. Consequently, retention has become the primary driver of Return on Investment (ROI). According to research by Bain & Company, increasing user retention rates by just 5% can increase profits by 25% to 95%.
Chief Technology Officers (CTOs) are increasingly advocating for qualitative tools because they reduce the "Mean Time to Resolution" (MTTR) for bugs. When developers can see a video of a bug, they spend less time in the discovery phase and more time in the coding phase. Furthermore, Product Managers report that qualitative data helps align stakeholders. It is often difficult to argue for a UI change based on a spreadsheet, but showing a video of ten different users struggling to find the "Menu" button provides undeniable evidence for a redesign.
Broader Impact and the Future of Mobile Intelligence
The integration of qualitative insights is not merely a trend but a necessary evolution in the software development lifecycle. As mobile devices become more varied—with foldable screens, different aspect ratios, and varying processing powers—the complexity of maintaining a seamless user experience grows. Qualitative analytics provides the visual "ground truth" necessary to navigate this complexity.
Looking forward, the next frontier in this field is the application of Artificial Intelligence (AI) to qualitative data. Future systems will likely use machine learning to automatically flag sessions where a user appears "confused" or "frustrated" based on erratic gesture patterns, further streamlining the workflow for app professionals.
In conclusion, the "standard" workflow of relying solely on numbers is no longer sufficient for the modern mobile economy. By embracing qualitative analytics, developers can move beyond the "what" and master the "why." This holistic approach results in apps that are not only more stable and bug-free but also more intuitive and user-centric. In an era where users have millions of alternatives at their fingertips, the ability to understand and empathize with the user’s journey is the ultimate competitive advantage.