

Conversion Rate Optimization (CRO) has evolved from a niche tactical practice of testing button colors into a sophisticated, data-driven discipline that serves as a cornerstone of modern digital strategy. At the heart of this discipline are Key Performance Indicators (KPIs)—the essential metrics that bridge the gap between user behavior on a website and the overarching financial goals of an organization. As digital acquisition costs continue to rise across platforms like Google and Meta, the ability to accurately measure and improve the efficiency of existing traffic has become a primary competitive advantage for both e-commerce and B2B enterprises.
Understanding the Distinction Between CRO Metrics and KPIs
In the realm of data analytics, it is common for marketing teams to become overwhelmed by the sheer volume of available data. However, professional practitioners distinguish strictly between general metrics and true KPIs. While metrics track specific user actions—such as scroll depth, pageviews, or clicks—KPIs are the specific subset of metrics that directly reflect the success or failure of a business objective.
A metric provides a diagnostic view of user behavior, helping analysts identify where a visitor might be encountering friction. For instance, a high bounce rate on a landing page is a metric that signals a potential lack of relevance. In contrast, a KPI measures an outcome. If a company’s strategic goal is to increase quarterly revenue, its primary KPI might be the purchase conversion rate or the average order value. While metrics help diagnose problems, KPIs are the yardsticks used to judge whether a website redesign, a new checkout flow, or a value proposition test has actually delivered a return on investment.
The 11 Essential CRO KPIs for Modern Digital Business
To effectively measure the impact of optimization efforts, organizations must track a balanced portfolio of KPIs categorized by their relationship to revenue, funnel progression, and lead quality.
1. Conversion Rate
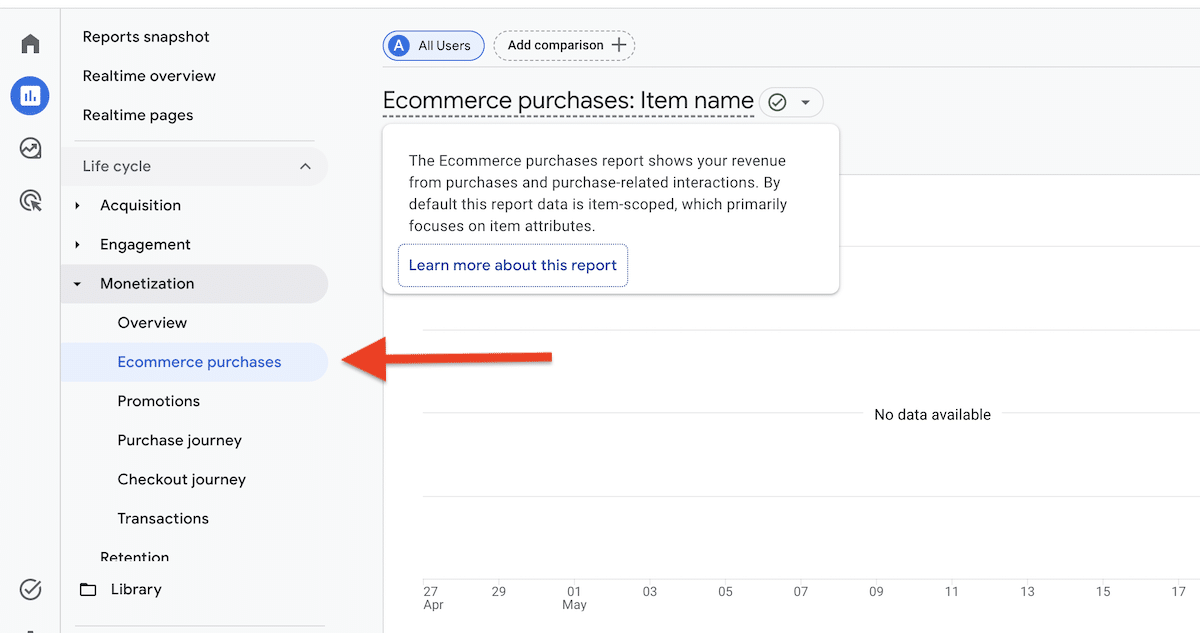
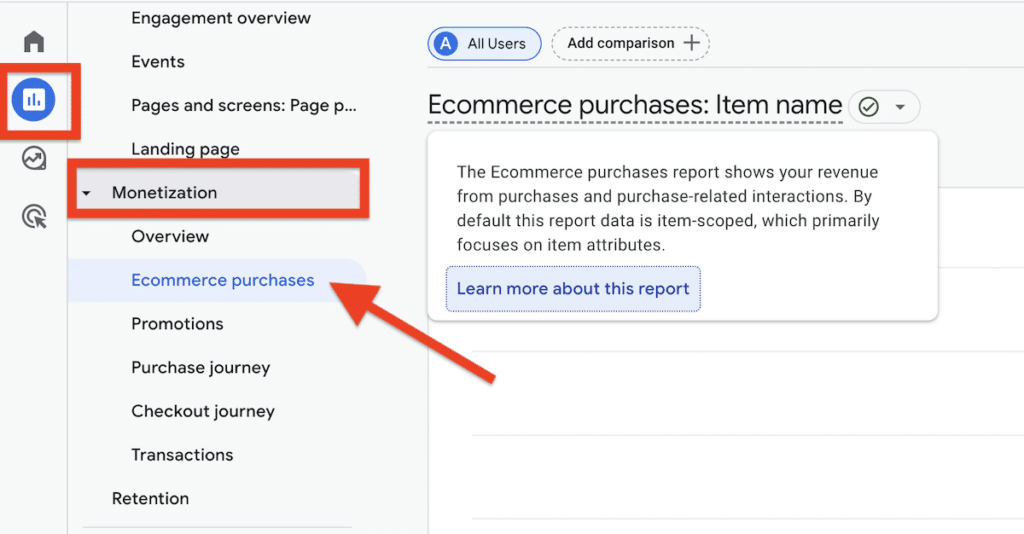
The conversion rate remains the most fundamental KPI in the CRO arsenal. It represents the percentage of total visitors who complete a primary desired action, such as a purchase, a demo booking, or a trial signup. In the current era of Google Analytics 4 (GA4), this is tracked through "Key Events." Industry benchmarks suggest that while average e-commerce conversion rates hover between 2% and 3%, top-tier performers often achieve rates exceeding 5% through rigorous iterative testing.
2. Revenue Per Visitor (RPV)
RPV is a comprehensive metric that combines the impact of conversion rate and order value. It provides a clear picture of how much revenue a site generates from every person who visits. This is particularly useful for measuring the success of tests that might lower the conversion rate but significantly increase the total spend, such as removing low-cost items from a homepage to focus on premium bundles.
3. Average Order Value (AOV)
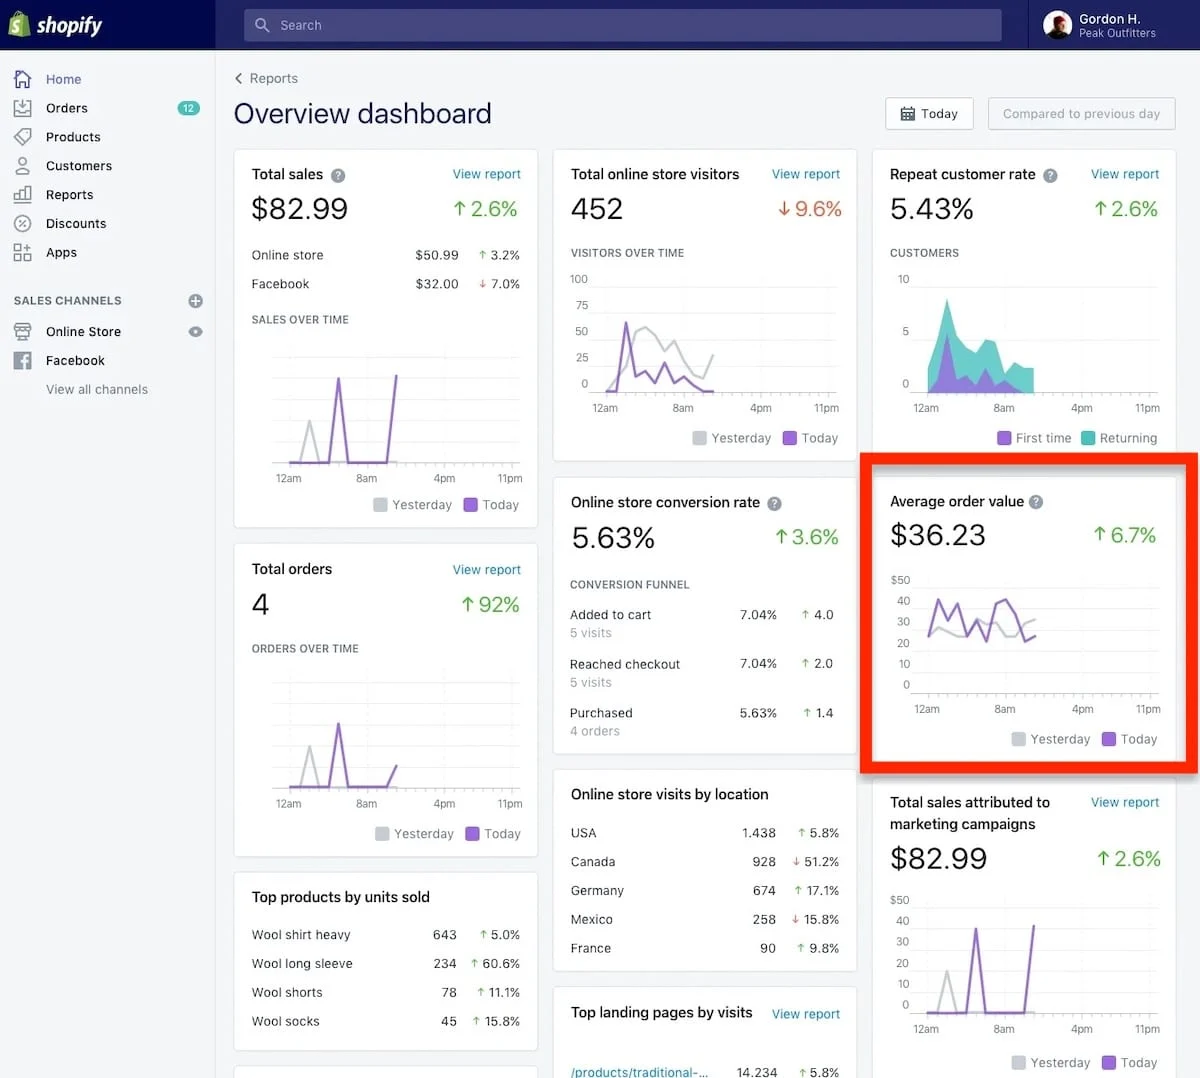
AOV tracks the average dollar amount spent each time a customer places an order. This KPI is the primary focus for teams testing upsells, cross-sells, and free-shipping thresholds. For many mature e-commerce brands, increasing AOV by 10% is often more achievable and profitable than trying to increase the total number of customers by the same margin.
4. Lead and Trial Conversion Rates
For B2B and SaaS (Software as a Service) organizations, the primary goal is rarely an immediate sale. Instead, the website serves to generate leads, demo bookings, or trial signups. Because the actual revenue event often occurs weeks or months later in a CRM (Customer Relationship Management) system, these "micro-conversions" serve as the leading indicators of future growth.
Measuring Funnel Progression and Friction Points
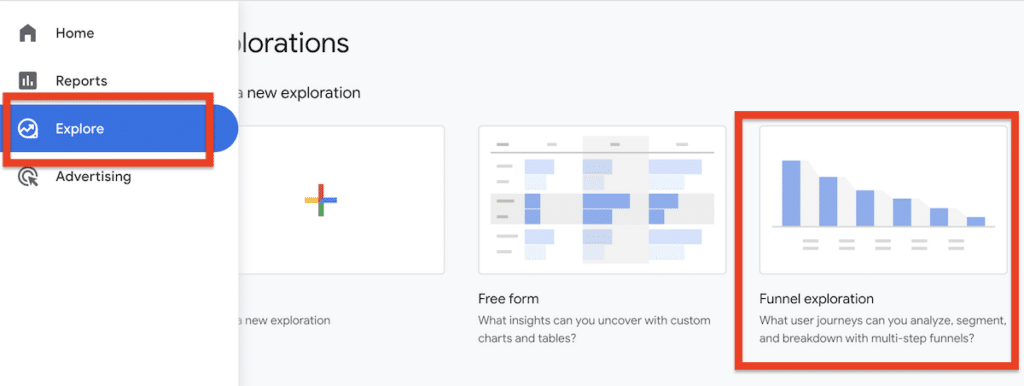
While high-level revenue KPIs tell a story of "what" is happening, funnel KPIs explain "where" the process is breaking down. Analyzing these stages allows teams to isolate specific technical or psychological barriers to conversion.
5. Add-to-Cart Rate
This KPI measures the percentage of product page visitors who take the first step toward a purchase. A low add-to-cart rate often indicates issues with product presentation, lack of social proof (reviews), or uncompetitive pricing.
6. Cart-to-Checkout Rate
Once an item is in the cart, the transition to the checkout environment is a critical hurdle. Friction at this stage is often caused by unexpected shipping costs or a lack of clarity regarding taxes and delivery times.
7. Checkout Completion Rate
The checkout completion rate is the ultimate measure of the "bottom of the funnel" efficiency. If this number is low, it typically points to technical bugs, forced account creation, or a lack of trusted payment methods. Data from the Baymard Institute suggests that nearly 70% of all online shopping carts are abandoned, making this one of the most lucrative areas for CRO intervention.
8. Form Completion Rate
In lead generation, the form is the final gateway. Tracking the ratio of form "starts" to form "submissions" allows marketers to identify if a form is too long, asks for too much sensitive information, or is difficult to navigate on mobile devices.
Prioritizing Lead Quality in B2B Environments
A common pitfall in B2B marketing is optimizing for lead volume at the expense of lead quality. High conversion rates on a landing page are meaningless if the leads generated are not "fit" for the sales team to close.
9. Qualified Lead Rate
This KPI filters total leads by specific criteria, such as company size, job title, or budget. A successful CRO test might actually result in fewer total leads but a higher percentage of qualified leads, thereby saving the sales team time and increasing overall efficiency.
10. Lead-to-Opportunity Rate
This measures the progression of a lead into a formal sales opportunity. It serves as a check on the "buying intent" of the traffic being driven to the site.
11. Lead-to-Customer Rate
The ultimate KPI for B2B CRO is the percentage of website leads that eventually become paying customers. While this has a long feedback loop, it is the only way to truly verify the long-term ROI of optimization efforts.
A Strategic Framework for Selecting KPIs
Choosing the right KPI for a specific test is as important as the test itself. Industry leaders, including experimentation teams at Microsoft and Google, advocate for a multi-layered approach to measurement.
The Primary KPI: This is the single metric that determines the "winner" of a test. It must be directly related to the change being made. For example, if you are testing a new headline on a product page, the primary KPI should be the add-to-cart rate.
Diagnostic KPIs: these provide context. If a test fails, diagnostic KPIs help explain why. If a new checkout design increases the checkout completion rate but decreases the average order value, the diagnostic data reveals that users are buying faster but spending less.
Guardrail KPIs: These are the "do no harm" metrics. They ensure that an improvement in one area does not cause a catastrophe in another. A classic example is a promotion that increases sales but destroys the company’s gross margin. In this scenario, gross margin serves as the guardrail.
The Impact of GA4 and the Future of CRO Measurement
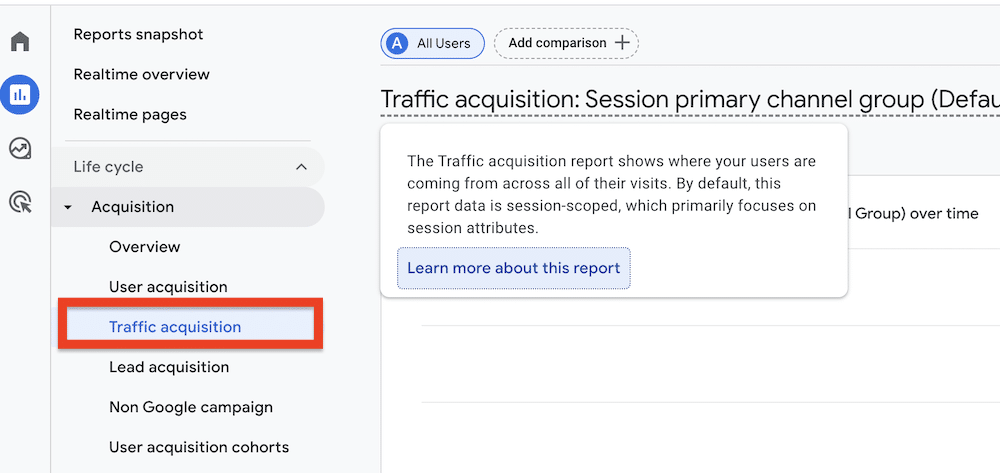
The transition from Universal Analytics to GA4 has significantly altered the chronology of how CRO KPIs are tracked. The shift toward an event-based data model allows for more granular tracking of user journeys across devices. However, it also requires a more technical setup to ensure that "key events" are correctly mapped to business goals.
Market analysts suggest that the next phase of CRO will be heavily influenced by Artificial Intelligence and machine learning. Automated personalization tools are beginning to allow websites to optimize KPIs in real-time for different user segments. For example, a returning customer might be shown a "loyalty" version of a page optimized for AOV, while a first-time visitor sees a version optimized for initial conversion.
Implications for Executive Reporting and Organizational Buy-In
For CRO initiatives to receive continued funding, teams must report KPIs in a way that resonates with executive leadership. While "click-through rates" may interest a social media manager, the C-suite is concerned with RPV, customer acquisition costs (CAC), and lifetime value (LTV).
A professional CRO dashboard should present a clear narrative: how specific website improvements (funnel KPIs) led to increased conversion efficiency (primary KPIs), which ultimately drove bottom-line growth (revenue KPIs). By maintaining this hierarchy, optimization teams can demonstrate that they are not just "testing things," but are actively managing a core engine of the company’s financial success.
In conclusion, the effective use of CRO KPIs is what separates successful, data-driven organizations from those that rely on intuition. As the digital landscape becomes increasingly crowded and expensive, the organizations that master the art of measuring and improving their conversion efficiency will be the ones that sustain long-term profitability.







