

Statistical power serves as the primary safeguard against the "invisible failure" of digital experimentation, acting as the mathematical lever that determines whether an A/B test can reliably detect a meaningful change in user behavior. In the competitive landscape of B2B SaaS and e-commerce, teams frequently execute textbook experiments only to encounter inconclusive results that mask genuine opportunities for growth. This phenomenon often stems not from a lack of innovation, but from a lack of statistical sensitivity. While many practitioners focus heavily on statistical significance to avoid false positives, the industry is increasingly recognizing that statistical power is equally vital for avoiding false negatives—the costly error of discarding a winning variation simply because the test was not designed to catch it.
Defining the Mechanics of Statistical Power
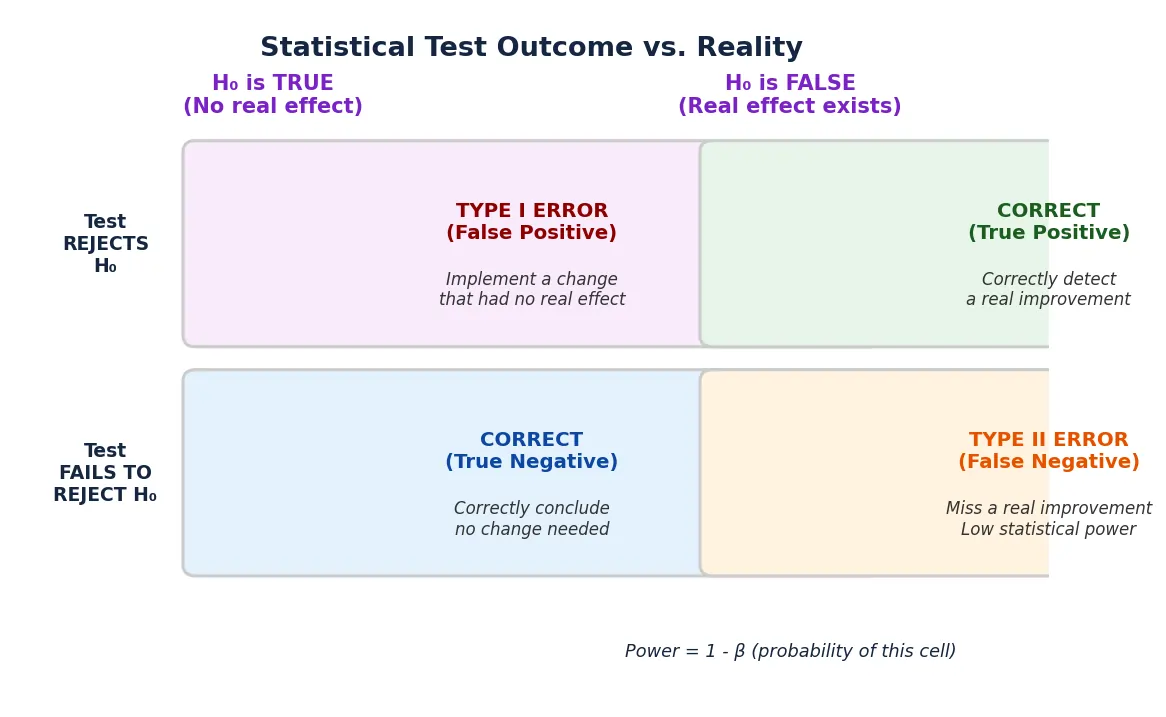
Statistical power is defined as the probability that an experiment will detect a true effect of a specified magnitude when that effect actually exists. In practical terms, if a website variation truly improves conversion rates by 5%, statistical power represents the likelihood that the test will return a statistically significant result confirming that 5% lift. Within the framework of experimental design, power is expressed as 1 minus beta (1 – β), where beta represents the Type II error rate, or the probability of failing to reject a null hypothesis that is actually false.

The industry standard for statistical power is typically set at 80%. This threshold implies that if a variation is genuinely effective at the designed level, the experiment has an 80% chance of identifying it as a winner and a 20% chance of returning an inconclusive result. This 20% risk of a "false negative" is the trade-off companies make to manage traffic requirements and experiment duration. However, when power is ignored or calculated incorrectly, this risk can skyrocket, leading teams to ship inferior "control" versions while unknowingly abandoning variations that could have yielded millions in incremental revenue.
The Four Fundamental Drivers of Experimental Sensitivity
The sensitivity of any A/B test is dictated by the interplay of four critical variables: sample size, the minimum detectable effect (MDE), the significance level (alpha), and data variance. Adjusting any one of these factors inevitably necessitates a shift in the others to maintain the integrity of the test.
1. Sample Size (N)
The most direct influencer of power is the volume of data collected. As the number of unique visitors or randomized units increases, the influence of random "noise" or outliers diminishes. In a low-traffic environment, a sudden surge in purchases might be a fluke; in a high-traffic environment, that same surge is more likely to represent a systemic shift in user preference. Consequently, larger sample sizes provide the resolution necessary to see smaller, subtler improvements.

2. Minimum Detectable Effect (MDE)
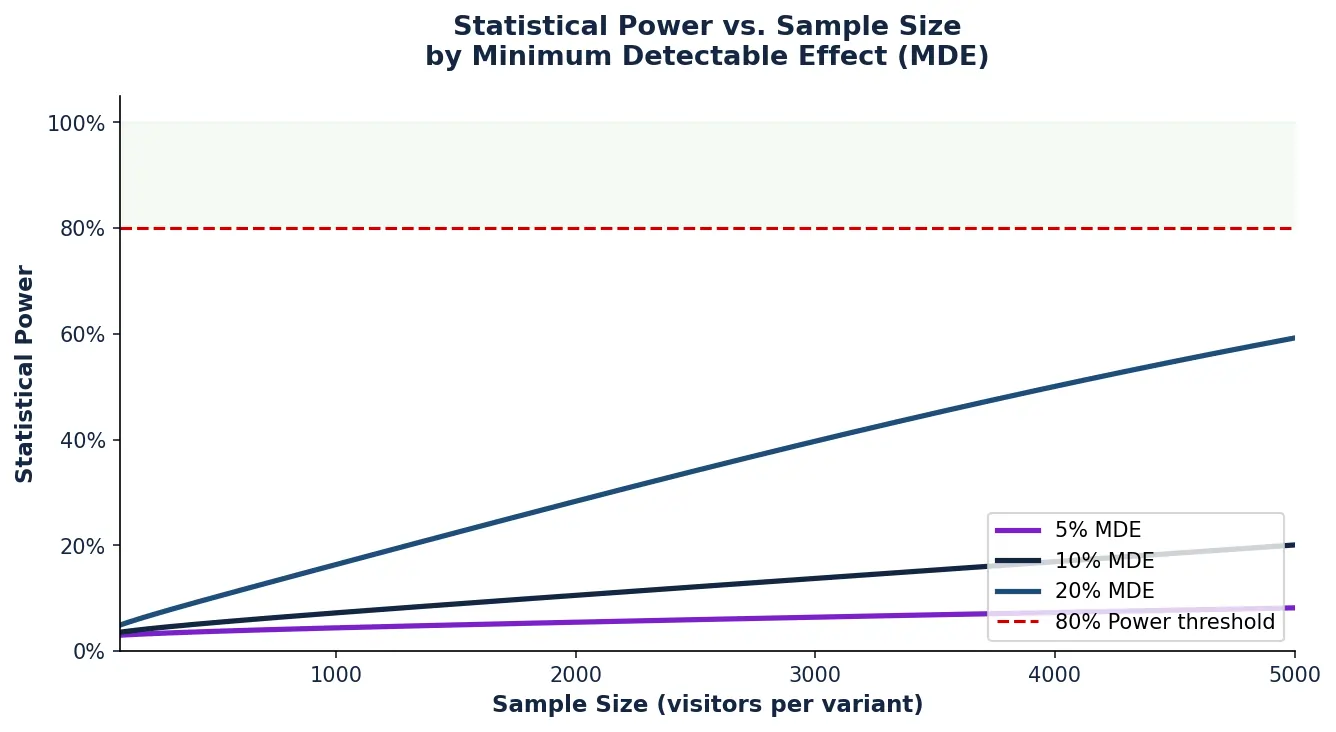
The MDE is the smallest relative or absolute lift an experiment is designed to identify. There is an inverse relationship between the size of the effect and the power required to see it: large, "home run" changes (such as a 30% lift) are easy to detect even with limited data, whereas "base hits" (such as a 2% lift) require significantly more traffic to distinguish from natural daily fluctuations.
3. Significance Level (Alpha)
Often set at 5% (resulting in a 95% confidence level), alpha represents the threshold for evidence required to declare a winner. This parameter guards against Type I errors, or false positives. However, there is a mathematical tension between alpha and power: the more stringently a team guards against false positives by lowering alpha, the harder it becomes to achieve high power, as the "bar" for evidence is raised for all results.
4. Data Variability and Variance
Variance refers to the natural "spread" or fluctuation within a dataset. In conversion rate optimization (CRO), variance is often tied to the baseline conversion rate and the nature of the metric. For instance, revenue-based metrics typically exhibit much higher variance than binary "click" metrics because purchase amounts can swing wildly from $10 to $1,000, creating "noise" that can obscure the true impact of a test variation.
The Economic Consequences of Underpowered Testing
The financial impact of underpowered testing is rarely captured in standard analytics dashboards, yet it represents a significant drain on corporate growth. Consider a SaaS enterprise generating $12 million in annual recurring revenue (ARR). If the product team runs a test on the checkout flow that produces a modest but real 2% lift, an underpowered test might return a "not statistically significant" result.
If the team follows the data and discards the variation, they lose $240,000 in unrealized annual revenue. Because SaaS revenue is cumulative and recurring, this loss compounds over time, affecting the baseline for all future growth. In this context, an inconclusive result is not a neutral outcome; it is a missed capital opportunity caused by an insensitive measurement tool.
Furthermore, low power compromises the "trustworthiness" of the wins that are found. According to Twyman’s Law—the principle that any figure that looks unusual is likely wrong—large winning results from small, underpowered samples are often the result of sampling error rather than true performance. When power is low (e.g., 10%), a statistically significant result is statistically more likely to be a fluke or an exaggerated "outlier" win. This necessitates a higher degree of skepticism and often requires a re-test, further consuming time and resources.
Chronology of a Pre-Test Power Analysis
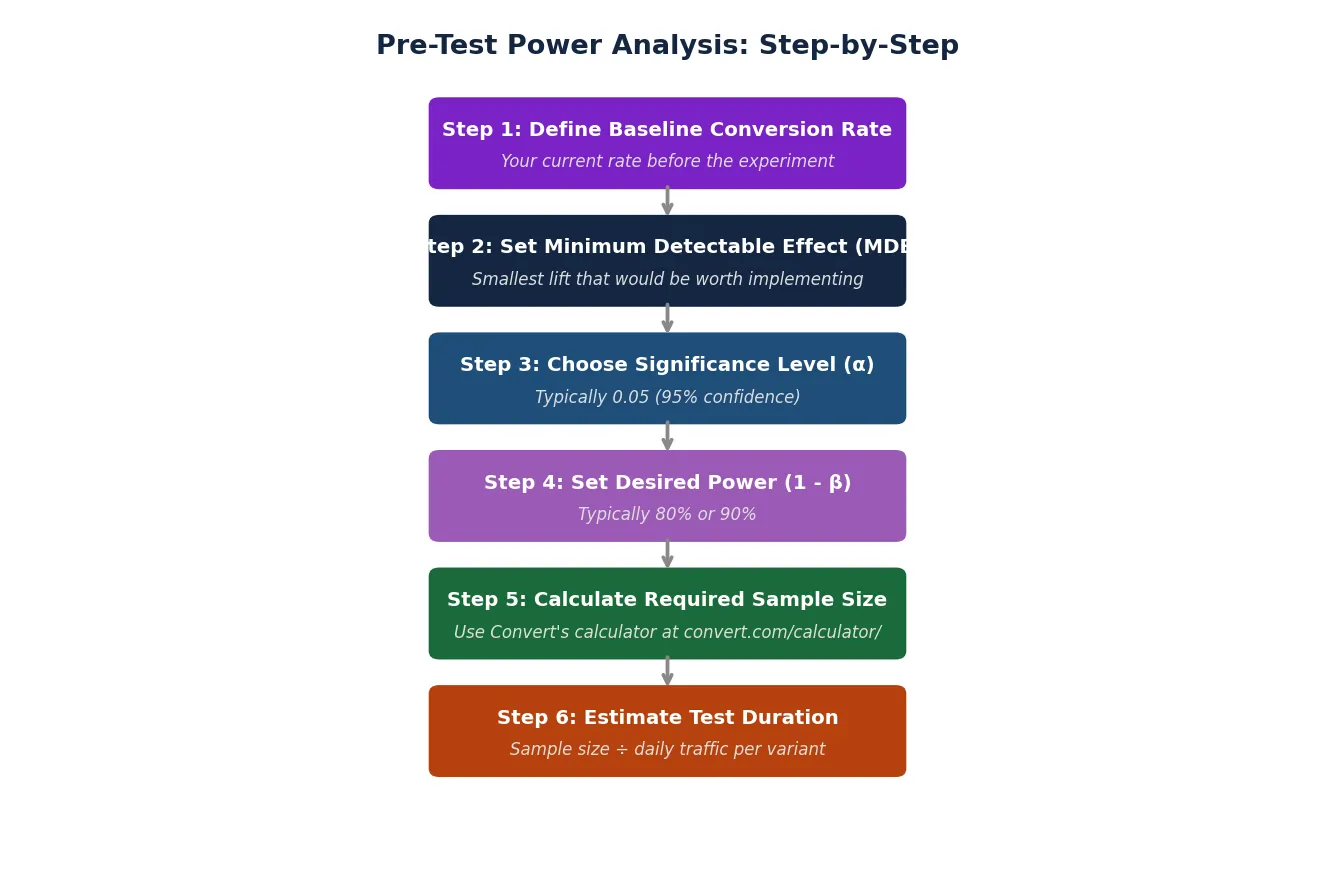
To prevent these errors, professional data teams employ a rigorous pre-test power analysis. This process ensures that the experiment is viable before any code is deployed.
- Step 1: Baseline Establishment: The team reviews historical data from the previous 30 to 90 days to determine the current performance of the control.
- Step 2: MDE Selection: Based on business goals, the team decides the smallest lift that would justify the cost of implementing a change.
- Step 3: Risk Parameter Setting: The team agrees on alpha (usually 0.05) and power (usually 0.80) based on the company’s risk tolerance.
- Step 4: Sample Size Calculation: Using a statistical calculator, these inputs are converted into a required number of visitors per variation.
- Step 5: Duration Estimation: By dividing the total required sample by the average daily traffic, the team calculates the necessary "run time" for the experiment.
- Step 6: Commitment: The team commits to a fixed horizon, agreeing not to "peek" at the results or stop the test early, which would artificially inflate the false positive rate.
Strategic Implications Across Statistical Methodologies
The management of power varies significantly depending on the statistical framework adopted by an organization.
Frequentist Methodologies: This is the traditional approach where power is a rigid pre-test requirement. It offers high reliability but requires strict adherence to sample sizes and prohibits early stopping without complex adjustments.
Sequential Testing: Modern platforms often utilize sequential testing, which allows for continuous monitoring of data. This method uses "dynamic boundaries" that adjust as data accumulates, potentially allowing for earlier wins if the effect is massive, thereby optimizing the "time to knowledge" without sacrificing the integrity of the power calculation.
Bayesian Frameworks: Bayesian statistics shift the focus from "significance and power" to "probability and risk." While it doesn’t use a formal power threshold in the same way, it provides a "probability of beating the control" and an "expected loss" metric. Even in Bayesian systems, the underlying principle of sensitivity remains: a small sample size will result in wide credible intervals and lower certainty, effectively mirroring the "underpowered" state of a frequentist test.
Handling High-Variance Metrics: Revenue Per Visitor
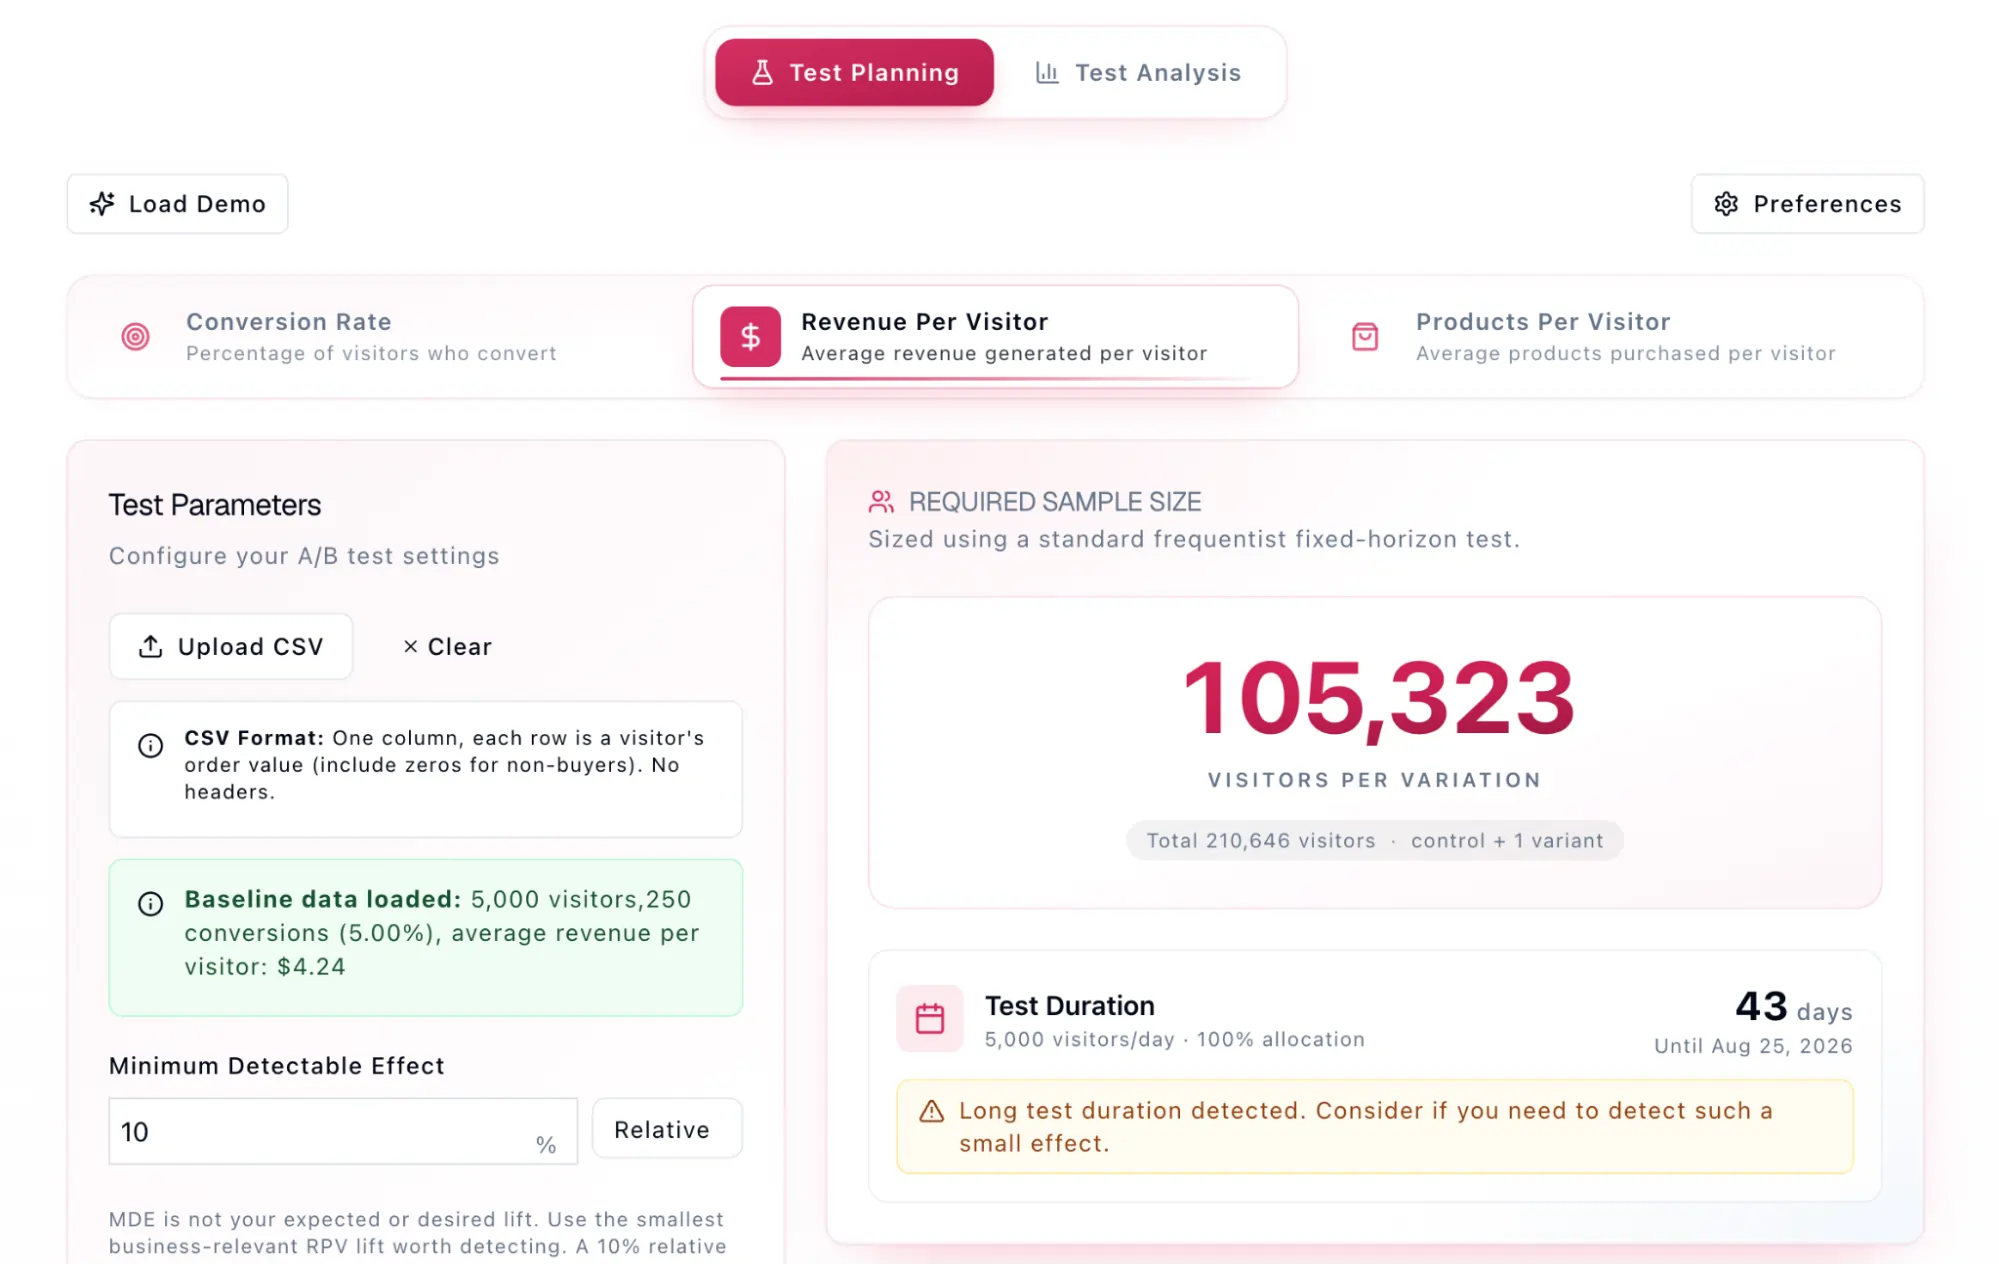
A common pitfall in experimentation is applying standard conversion rate power calculations to revenue-based metrics. Revenue Per Visitor (RPV) is the product of the conversion rate and the Average Order Value (AOV). Because RPV accounts for the wide distribution of spend amounts, it possesses inherently higher variance than a binary "yes/no" conversion.
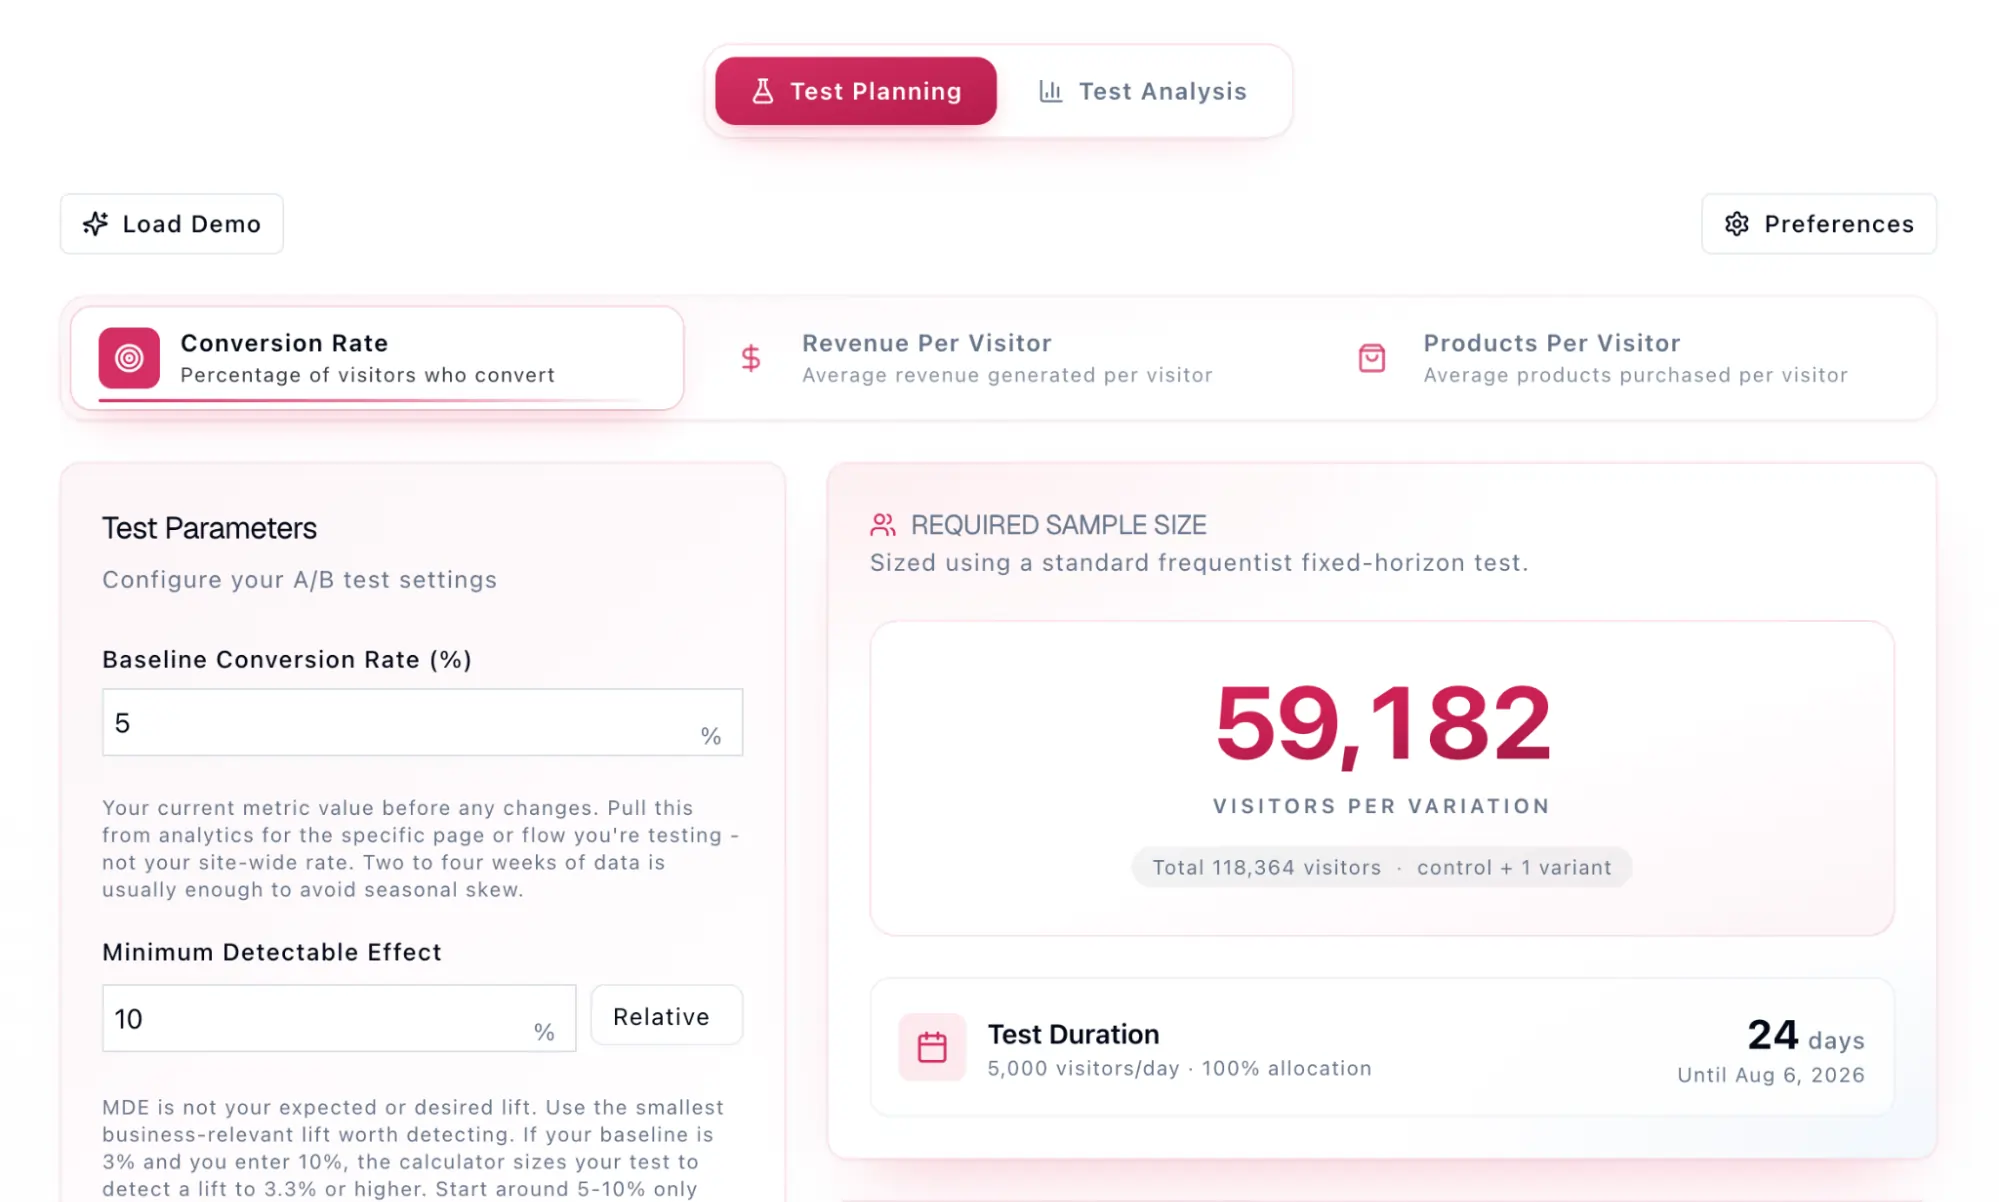
Data analysis shows that an RPV test often requires nearly double the sample size of a conversion rate test to reach the same level of statistical power. For organizations where the goal is to increase the "basket size" rather than just the number of orders, failing to account for this variance leads to tests that run for months without ever reaching a conclusive result. To mitigate this, teams must use the standard deviation of their revenue data as a primary input in their power analysis.
Mitigation Strategies for Traffic-Constrained Environments
Not every organization has the millions of monthly visitors required to run "perfect" 80%-powered tests for 2% lifts. In these scenarios, teams must make strategic compromises:
- Swing for the Fences: Instead of testing cosmetic UI changes, low-traffic sites should test radical departures from the baseline. By aiming for a 20% MDE instead of a 5% MDE, the required sample size drops dramatically.
- Accept Higher Risk: A team might consciously decide to run a test at 60% power. While this increases the risk of missing a winner, it allows for a faster testing cadence.
- Use Micro-Conversions: If "purchases" are too rare to reach power, teams can test for "add-to-cart" actions, which occur more frequently and provide more data points for the statistical engine.
- Sequential Monitoring: Utilizing sequential frameworks allows teams to catch "runaway winners" early, preserving traffic for other experiments.
Ultimately, statistical power is the bridge between data collection and business intelligence. By treating power as a prerequisite rather than an afterthought, organizations can ensure that their experimentation programs are not merely "activity-based" but are truly "outcome-driven," providing a clear and accurate map for sustainable growth.







