

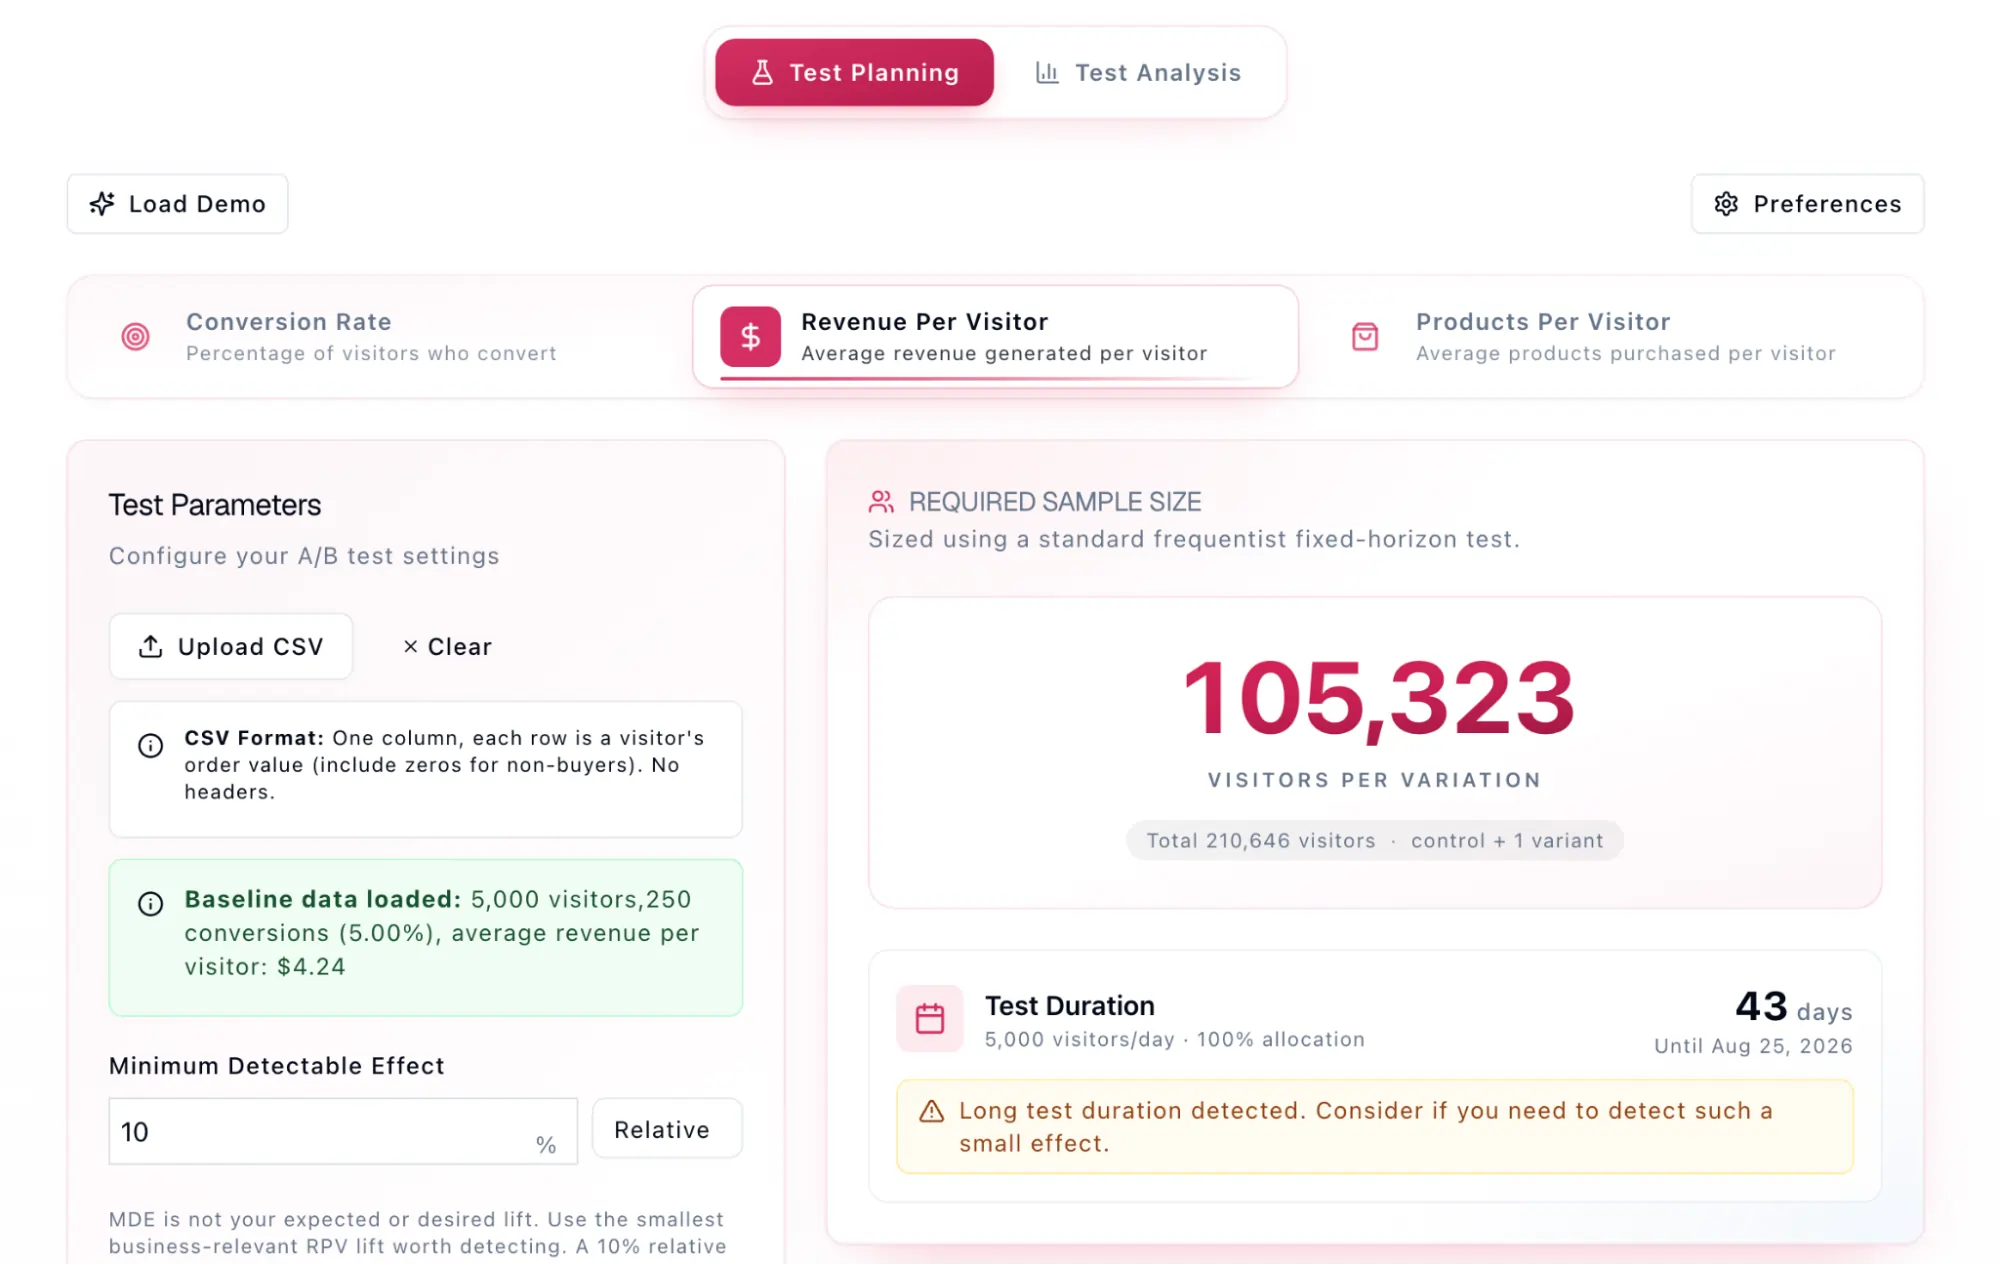
Statistical power represents the foundational probability that a clinical or digital experiment will successfully detect a true effect of a specific magnitude when such an effect exists. Within the landscape of conversion rate optimization (CRO) and A/B testing, statistical power serves as the primary safeguard against "Type II errors," commonly known as false negatives. While much of the industry’s focus remains on statistical significance—the protection against false positives—statistical power determines the sensitivity of the experiment. Without adequate power, organizations risk discarding high-value innovations simply because their testing framework was not robust enough to distinguish a genuine improvement from random environmental noise.
In modern digital commerce, the cost of underpowered testing is frequently measured in hundreds of thousands of dollars in unrealized annual recurring revenue (ARR). When a test is designed with insufficient sensitivity, a variation that provides a modest but profitable 2% or 3% lift may return a "non-significant" result. In such scenarios, teams often revert to the original control version, unknowingly leaving substantial growth on the table. Understanding the mechanics of power, therefore, is not merely a mathematical exercise but a critical business imperative for data-driven decision-making.

Defining the Mechanics of Experimental Sensitivity
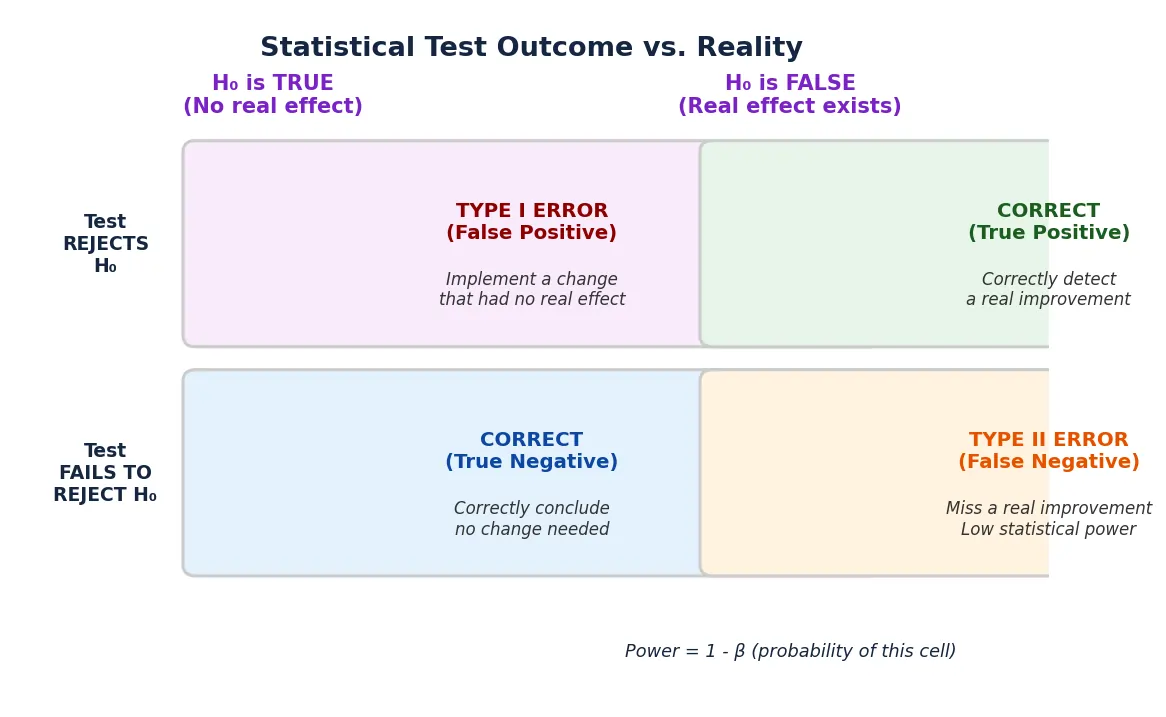
Statistical power is mathematically defined as 1 minus beta (1 – β), where beta represents the probability of committing a Type II error. In standard industry practice, power is typically set at 0.80, or 80%. This configuration implies that if a variation truly possesses an effect equal to the Minimum Detectable Effect (MDE), the experiment has an 80% chance of yielding a statistically significant result and a 20% chance of missing it.
The distinction between significance and power is vital for experimental integrity. Significance (alpha) controls the threshold for evidence required to declare a "winner," protecting against the "Winner’s Curse" or false discoveries. Power, conversely, dictates the volume of data required to ensure that real winners are not overlooked. A test can be statistically rigorous in its avoidance of false positives while remaining entirely "blind" to genuine improvements if the sample size or design sensitivity is lacking.
The Four Pillars of Statistical Power
The sensitivity of any given experiment is dictated by the interplay of four primary variables. Adjusting any one of these factors inevitably necessitates a recalibration of the others to maintain the integrity of the test.

1. Sample Size (N)
The total number of independent units—typically unique visitors—is the most direct lever for increasing power. As the sample size grows, the standard error decreases, allowing the statistical model to more clearly distinguish between random fluctuations and actual shifts in user behavior. In high-traffic environments, achieving high power is relatively straightforward; however, for low-traffic sites, sample size often becomes the primary constraint on experimental velocity.
2. Minimum Detectable Effect (MDE)
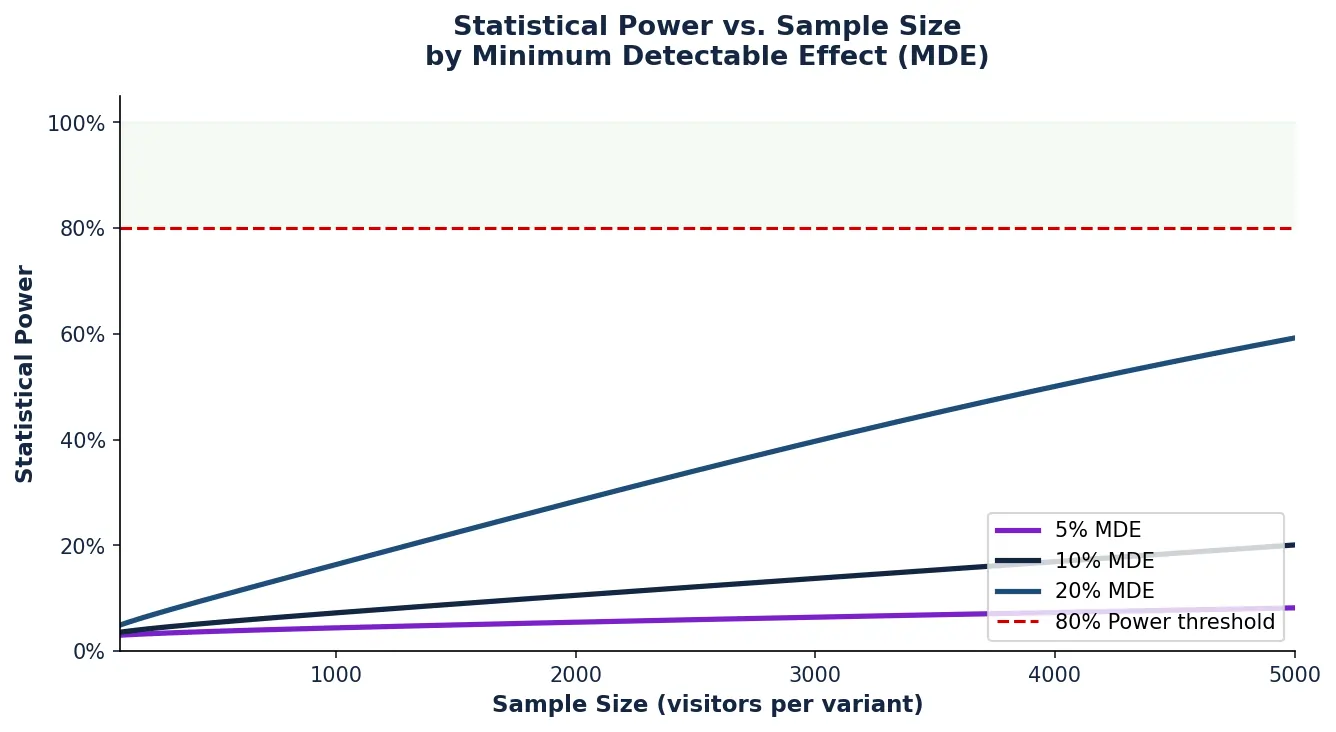
The MDE is the smallest relative or absolute lift that the experiment is designed to detect. There is an inverse relationship between the MDE and the required sample size: detecting a massive 20% lift requires far less data than detecting a subtle 2% lift. Setting an unrealistically low MDE can lead to impractically long test durations, while setting it too high increases the risk of missing meaningful, smaller gains.
3. Significance Level (Alpha)
The significance level, usually set at 0.05 (95% confidence), represents the tolerance for false positives. Increasing the stringency of the significance level (e.g., moving from 0.05 to 0.01) requires a corresponding increase in sample size to maintain the same level of power. This creates a trade-off: the more certain a researcher wants to be that a result is not a fluke, the more data they must collect to ensure they don’t miss a real effect.
4. Data Variability (Variance)
Variance refers to the natural "noise" or fluctuation within the data set. In conversion testing, this is often tied to the baseline conversion rate and the nature of the metric itself. Metrics with high dispersion, such as Revenue Per Visitor (RPV), where a few customers may spend thousands of dollars while most spend nothing, possess much higher variance than binary metrics like "Clicked" or "Did Not Click." Higher variance necessitates larger samples to achieve the same level of power.
A Chronological Framework for Pre-Test Power Analysis
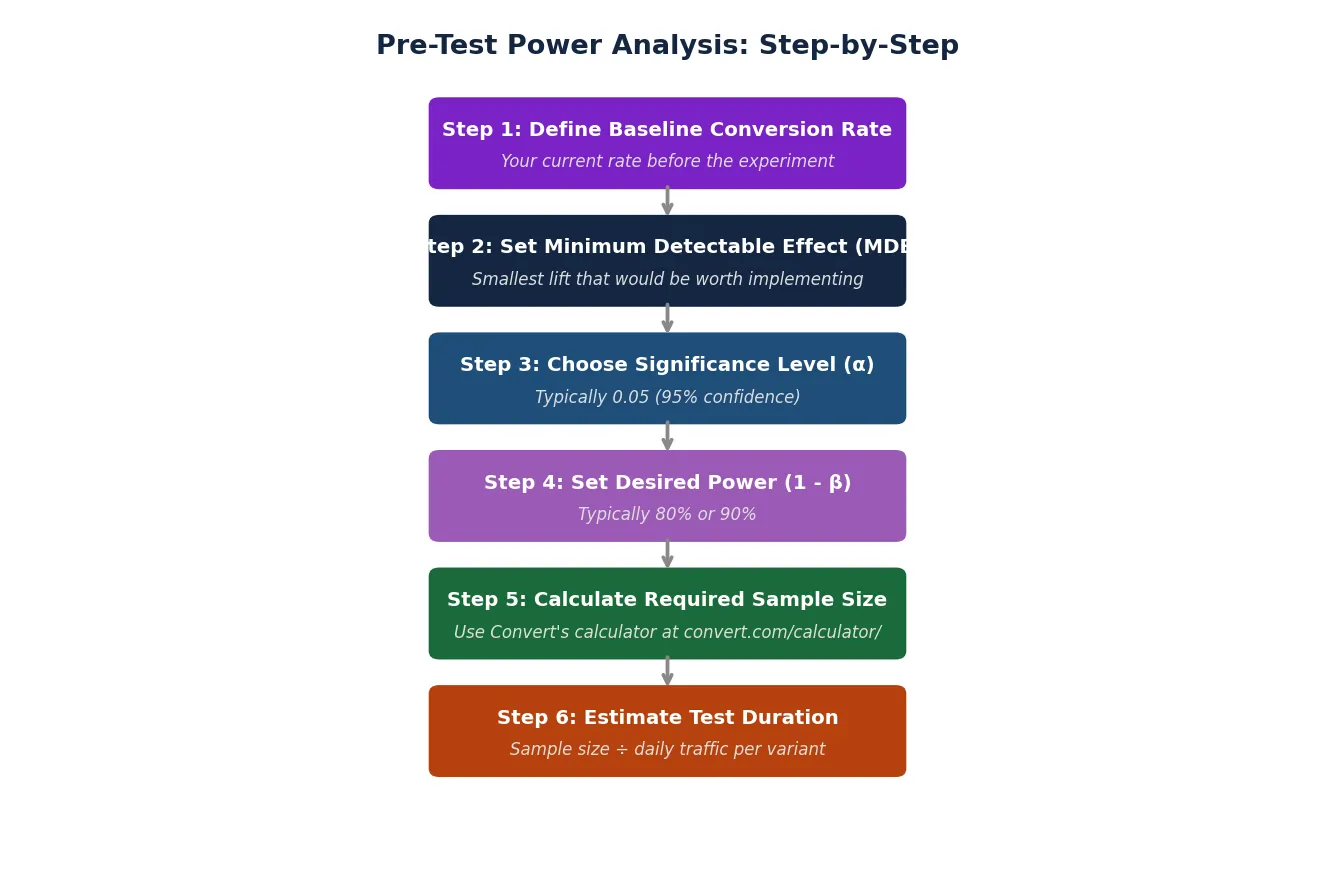
To ensure experimental validity, a power analysis must be conducted before the launch of any test. This chronological sequence prevents the common pitfall of "peeking" at data or running tests indefinitely without a clear stopping criterion.
Phase 1: Baseline Establishment
The process begins with an audit of historical performance. Using data from the previous 30 to 90 days, the team establishes the baseline conversion rate (CVR) for the specific segment being tested. Relying on industry benchmarks rather than first-party data is a frequent cause of experimental failure, as internal variance is highly specific to a brand’s unique traffic patterns.
Phase 2: Defining the MDE and Risk Tolerance
The organization must decide what level of lift justifies the technical debt of implementing a new feature. If a change is minor, a 2% MDE might be appropriate. If the change involves a complete overhaul of the checkout flow, the team might only care about detecting a lift of 10% or more. Simultaneously, the alpha (significance) and beta (power) targets are set, usually at 5% and 80%, respectively.
Phase 3: Sample Size and Duration Estimation
Using a statistical calculator, these variables are processed to determine the required sample size per variation. This figure is then divided by the average daily traffic to the test page to estimate the test duration. If the estimated duration exceeds a reasonable business cycle (typically 4 to 6 weeks), the parameters of the test must be adjusted—either by increasing the MDE or narrowing the scope of the experiment.
The Economic Implications of Underpowered Testing
The financial consequences of underpowered experiments are often invisible but devastating. Consider a medium-sized e-commerce platform generating $10 million in annual revenue. A team runs an underpowered test on the product page. The variation actually provides a 3% lift, but because the test was only powered to detect a 10% lift, the result returns as "not significant."
The team discards the variation. The "invisible" cost is $300,000 in lost annual revenue. When this occurs across dozens of tests per year, the cumulative opportunity cost can stifle an organization’s growth trajectory. Furthermore, underpowered tests contribute to a high "False Discovery Rate." When power is low, a significant result is actually more likely to be a false positive (noise) than a true positive. This erodes organizational trust in data, leading stakeholders to question the validity of the entire testing program.
Methodological Variations: Frequentist, Bayesian, and Sequential
While the core principles of power remain constant, different statistical frameworks approach the problem with varying levels of flexibility.
- Frequentist Methods: This is the traditional approach requiring a fixed sample size determined in advance. It is highly rigorous but inflexible, as "peeking" at the results before the target sample is reached can inflate the false positive rate.
- Sequential Testing: Increasingly popular in SaaS, this method allows for continuous monitoring. It uses "stopping rules" that adjust significance boundaries over time. While it can allow for earlier wins in the case of massive effects, it still requires a "horizon" or maximum sample size to maintain power.
- Bayesian Analysis: Rather than focusing on a binary "significant/not significant" outcome, Bayesian models provide a probability of a variation being better than the control. While Bayesian methods do not use the formal concept of "power" in the same way as Frequentist models, they still require adequate data to reach high-certainty thresholds.
The Challenge of High-Variance Metrics
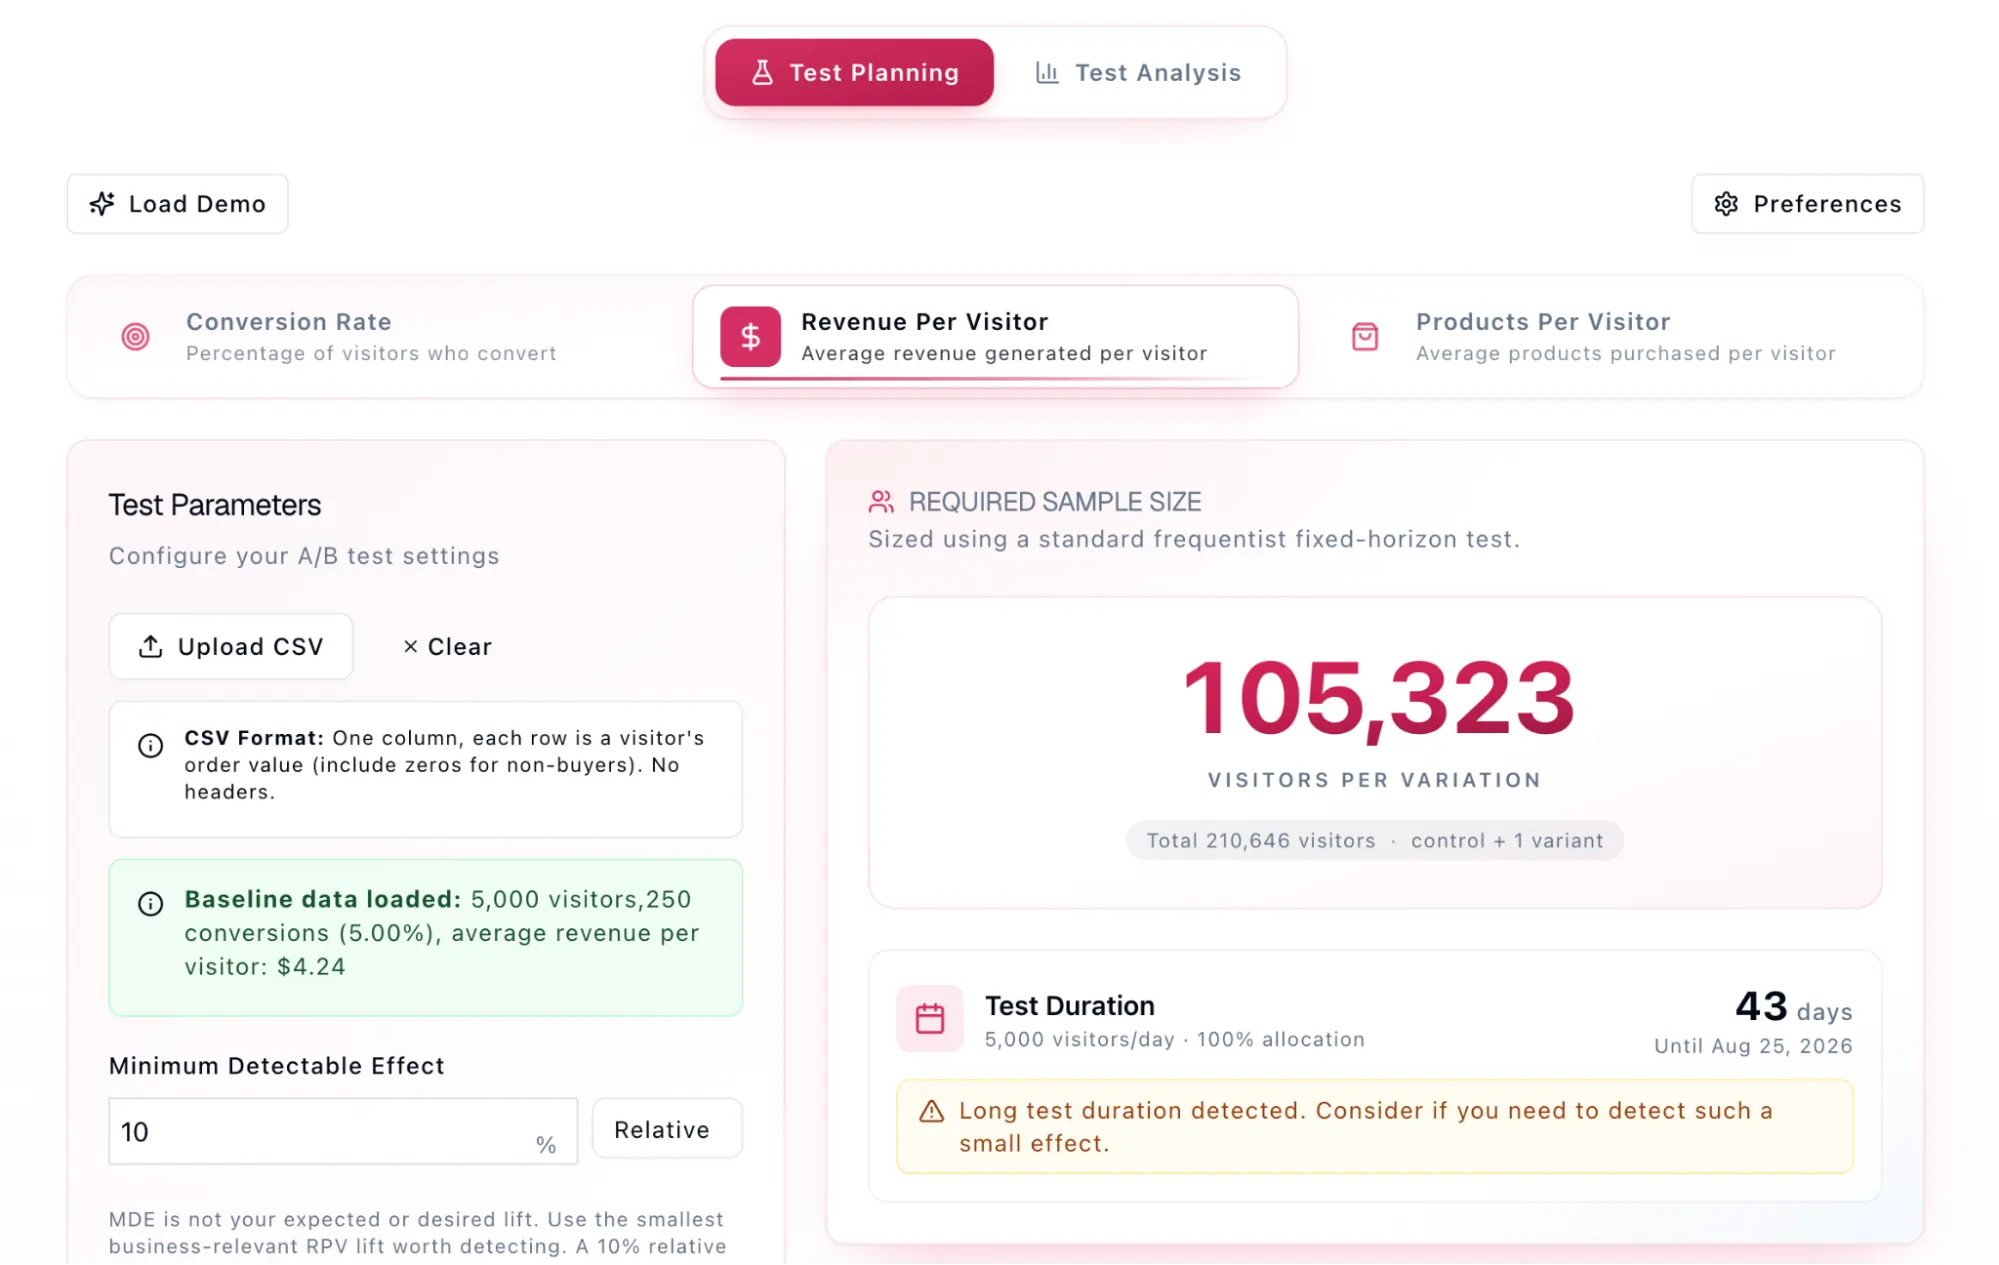
A common error in digital experimentation is treating Revenue Per Visitor (RPV) with the same sample-size expectations as a standard Conversion Rate (CVR). RPV is a continuous metric with no upper bound, meaning it is susceptible to "outliers"—single large purchases that can skew the average.
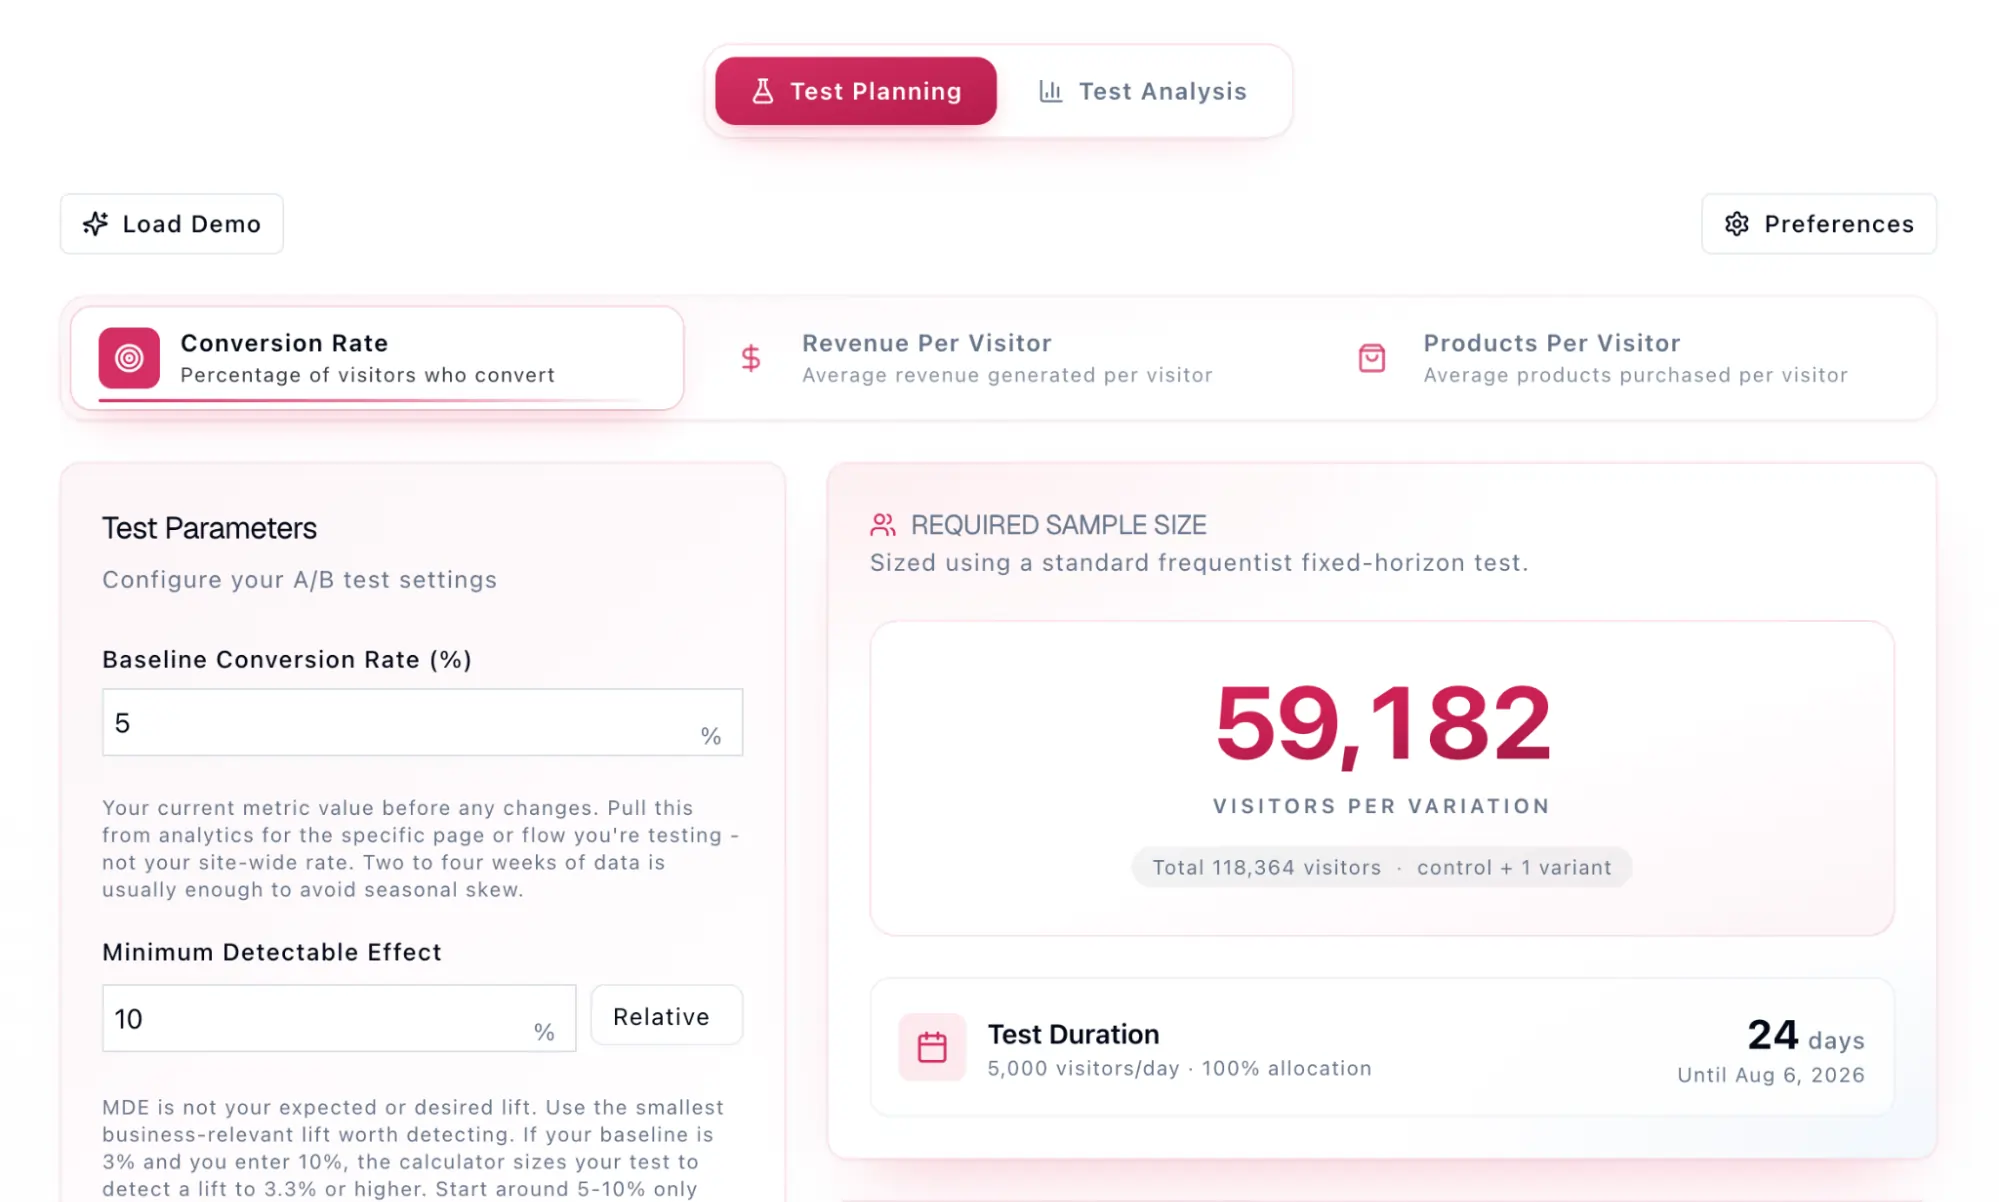
Data analysis indicates that RPV tests often require two to three times the traffic of CVR tests to reach the same level of statistical power. For many businesses, this means that while they have enough traffic to test whether a change makes people buy, they may not have enough traffic to reliably test whether it makes them spend more. In these instances, analysts must often use "winsorization" (capping outliers) or switch to a more stable "proxy metric" to maintain experimental sensitivity.
Strategic Alternatives for Low-Traffic Environments
When a power analysis reveals that a test will take six months to complete, organizations must pivot to alternative strategies to maintain momentum.
- Macro-Conversions over Micro-Conversions: Instead of testing for final purchases, a team might test for "Add to Cart" or "Start Checkout." These actions occur more frequently, providing a higher baseline CVR and reducing the required sample size.
- Increased MDE for "Bolder" Changes: Small tweaks (like button colors) rarely produce massive lifts. Low-traffic sites should focus on "radical" redesigns where a 20% or 30% lift is plausible, allowing for smaller required samples.
- Traffic Segmentation: Rather than testing across the whole site, focusing on a high-intent segment (like mobile users from organic search) can sometimes reduce variance and provide a clearer signal, though the results cannot be generalized to the entire population.
- Accepting Higher Risk: In some cases, a business may choose to lower its power target to 60% or 70%. While this increases the risk of false negatives, it allows for a faster testing cadence. This is often a pragmatic choice for startups that value speed over absolute statistical certainty.
Broader Impact and Industry Implications
The rigorous application of statistical power is transforming the CRO industry from a collection of "best practices" and "gut feelings" into a disciplined branch of data science. As privacy regulations like GDPR and CCPA limit the availability of third-party data, the importance of maximizing the utility of first-party experimental data has never been higher.
Organizations that master statistical power gain a significant competitive advantage. They move faster, waste less time on inconclusive "flat" tests, and capture the small, incremental gains that compound into market leadership. In the coming years, as automated experimentation and AI-driven personalization become standard, the human ability to design well-powered, sensitive experiments will remain the differentiating factor in digital excellence. The ultimate goal of understanding power is to ensure that every experiment conducted provides a clear, actionable answer, moving the business forward with confidence rather than leaving its growth to chance.







