


In the high-stakes environment of Conversion Rate Optimization (CRO), data-driven teams often encounter a statistical phenomenon that can jeopardize revenue projections and product roadmaps: the multiple comparisons problem. As digital experimentation becomes more complex, moving beyond simple A/B tests to multi-variant (A/B/n) configurations, the probability of encountering "false winners" increases exponentially. To address this, statisticians and data scientists rely on the Bonferroni correction, a rigorous mathematical framework designed to maintain the integrity of experimental results by adjusting significance thresholds.
The Multiple Comparisons Problem: An Invisible Threat to CRO
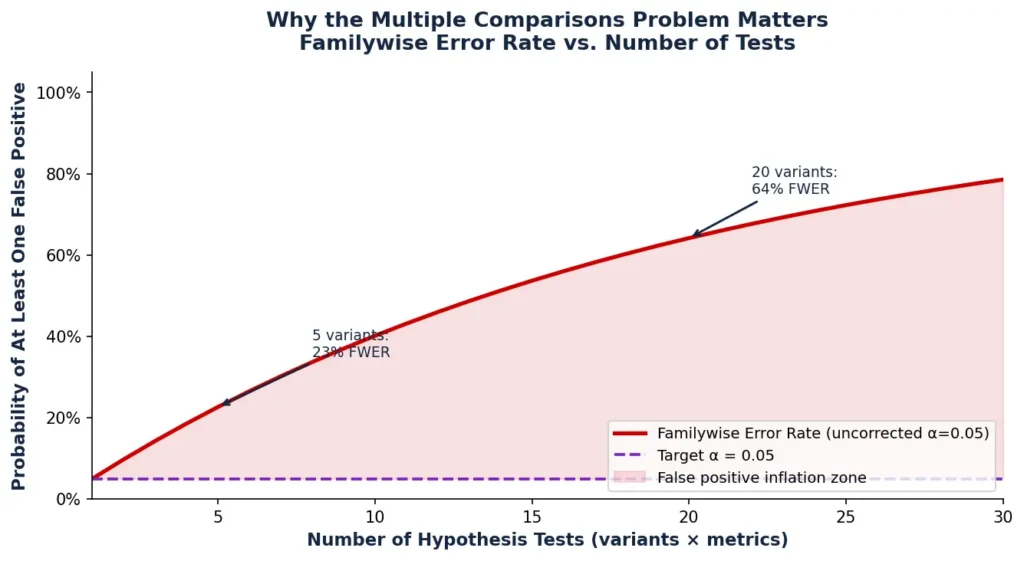
The fundamental goal of A/B testing is to determine if a specific change to a website or application leads to a statistically significant improvement in user behavior. Most teams operate with a 5% significance threshold, denoted as alpha (α = 0.05). This threshold represents a calculated risk: the team accepts a 5% chance that a detected "win" is actually the result of random noise rather than a genuine improvement. This error is known in statistics as a Type I error, or a false positive.
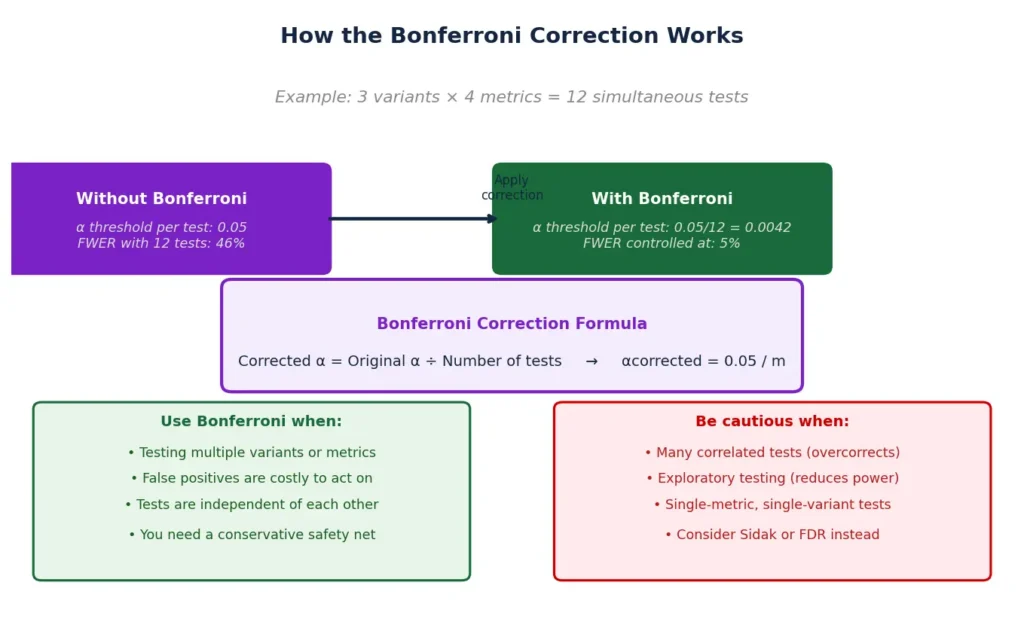
The danger arises when a single experiment involves multiple comparisons. If a CRO team tracks three success metrics across four different page variations, they are no longer running one test; they are conducting 12 separate comparisons. If each comparison is held to the standard 5% threshold, the cumulative risk of at least one false positive—known as the Family-Wise Error Rate (FWER)—climbs to approximately 46%.

In such a scenario, nearly half of the experiments conducted could result in "winning" variations that fail to deliver actual revenue when deployed to the full audience. This statistical trap often explains why "proven" test results fail to replicate in a production environment, leading to wasted development resources and skewed business intelligence.
The Mathematical Framework of the Bonferroni Correction
The Bonferroni correction, named after the 20th-century Italian mathematician Carlo Emilio Bonferroni, offers a straightforward solution to the FWER explosion. The method dictates that the significance threshold (alpha) must be divided by the total number of comparisons (m) within a single "family" of tests.
The formula is expressed as:
α_new = α_original / m
For a standard test where α is 0.05 and the team is testing 10 different variations, the new required p-value for any single variation to be declared a winner drops to 0.005. By making it ten times harder for any individual result to pass the bar, the correction ensures that the overall probability of a false positive across the entire experiment remains capped at the original 5%.

Calculation of Total Comparisons (m)
To apply the correction accurately, practitioners must identify the total number of independent opportunities for a false positive. This is typically calculated by multiplying the number of treatment variants by the number of primary metrics being tracked.
- Scenario A: One control, four variants, one primary metric = 4 comparisons.
- Scenario B: One control, one variant, five primary metrics = 5 comparisons.
- Scenario C: One control, four variants, five primary metrics = 20 comparisons.
In Scenario C, the corrected alpha would be 0.0025. This rigorous standard requires the observed effect to be exceptionally strong to be considered valid, providing a high level of confidence to stakeholders before they authorize expensive rollouts.
Chronology and Evolution of Statistical Correction Methods
The history of multiple comparison corrections reflects the broader evolution of statistical science from the mid-20th century to the modern era of big data.
- 1930s-1950s (Foundations): The work of Carlo Bonferroni and later Olive Jean Dunn established the "Bonferroni Inequalities," providing the first formal methods for adjusting confidence intervals when dealing with multiple inferences.
- 1979 (The Holm Method): Sture Holm introduced the "Holm-Bonferroni" method. This was a significant advancement, as it offered a "step-down" approach that was less conservative than the original Bonferroni correction, allowing for more statistical power while still controlling the FWER.
- 1980s (The Šidák Correction): Based on the work of Zbyněk Šidák, this method provided a slightly more precise threshold for independent tests, though it remains closely related to the Bonferroni approach.
- 1995 (The False Discovery Rate): Yoav Benjamini and Yosef Hochberg introduced a paradigm shift with the Benjamini-Hochberg (BH) procedure. Rather than trying to prevent any false positives, BH focuses on controlling the proportion of false positives among all significant results. This became the standard for exploratory research and genomics.
- 2010s-Present (Digital Experimentation): As SaaS platforms like Convert, Optimizely, and VWO integrated these methods, the Bonferroni correction moved from academic journals into the dashboards of digital marketers and product managers.
Comparative Analysis: Bonferroni vs. Modern Alternatives
While the Bonferroni correction is the most famous method, it is often criticized for being "too conservative." By lowering the significance bar so drastically, it increases the risk of Type II errors—false negatives, or failing to detect a real improvement. To balance this, several alternative methods are utilized based on the experiment’s goals.
Holm-Bonferroni (The Sequential Step-Down)
Unlike the standard Bonferroni, which applies a flat penalty, the Holm method ranks p-values from smallest to largest. The smallest p-value is tested against the strictest threshold, and subsequent p-values are tested against increasingly relaxed standards. This allows "borderline" winners to be detected more easily once the strongest winners have already cleared the bar.
Benjamini-Hochberg (False Discovery Rate)
This method is preferred in exploratory testing. If a company is testing 100 different UI elements to find any signal of user interest, they might accept a 5% False Discovery Rate (FDR). This means that out of 20 "winners" found, they expect one might be a false positive. This approach preserves much more statistical power than Bonferroni.
Dunnett’s Test
In many A/B/n tests, the only comparisons that matter are those between the variants and the control (A vs. B, A vs. C, etc.). Dunnett’s test accounts for the fact that all variants share the same control group. Because these comparisons are correlated, Dunnett’s can apply a less restrictive penalty than Bonferroni while still providing robust FWER control.
Industry Implications and Operational Impacts
The decision to use a Bonferroni correction is not merely a statistical choice; it is a business decision with significant economic implications.
Sample Size Inflation
The most immediate impact of applying a stricter significance threshold is the requirement for a larger sample size. To achieve the same "statistical power" (the ability to detect a real effect) at a 0.01 alpha compared to a 0.05 alpha, a test might require 50% to 100% more traffic. For low-traffic websites, this can extend test durations from weeks to months, leading to "experimentation paralysis."
Strategic Decision Making: Confirmatory vs. Exploratory
Industry experts suggest a bifurcated approach to correction:
- Confirmatory Testing: When a test involves a high-risk change—such as a new pricing model, a checkout flow overhaul, or a backend algorithm change—the Bonferroni correction is recommended. The cost of a false positive in these areas is high, justifying the extra time and traffic needed for a rigorous result.
- Exploratory Testing: When a team is simply looking for inspiration or testing low-risk "micro-copy" changes, corrections may be skipped or replaced with the Benjamini-Hochberg method. Here, the risk of a false negative (missing a good idea) is often considered higher than the risk of a false positive.
Expert Perspectives and Common Pitfalls
Data scientists at major experimentation platforms warn that even seasoned testers often misapply these corrections. A common mistake is "post-hoc data dredging," where a team fails to find a winner in the primary test and then begins slicing the data by geography, browser, or device type. Each new segment analyzed represents a new comparison, yet these are rarely corrected for, leading to a high rate of false positives in segmented reporting.
Another pitfall is the confusion between primary and secondary metrics. Statistics experts clarify that if a team pre-declares one primary KPI (e.g., Revenue) and uses five other metrics merely as "guardrails" (e.g., Page Load Speed, Unsubscribe Rate), the correction should only apply to the variants relative to that single primary KPI. Including guardrail metrics in the Bonferroni calculation unnecessarily penalizes the experiment.

Conclusion: The Future of Rigorous Experimentation
As the digital landscape becomes more crowded and conversion gains become harder to achieve, the "quality over quantity" approach to data will likely prevail. The Bonferroni correction remains a cornerstone of this movement toward statistical integrity. While newer, more complex Bayesian models and sequential testing methods are gaining traction, the simplicity and transparency of the Bonferroni method ensure its continued relevance.
For organizations aiming to build a truly data-driven culture, the adoption of multiple comparison corrections signifies a move away from "chasing p-values" toward a disciplined framework of scientific validation. By acknowledging the invisible trap of false positives, businesses can ensure that their growth strategies are built on a foundation of reality rather than random chance.







