The year 2017 marked a pivotal shift in the landscape of data democratization, characterized by the rapid adoption of cloud-based visualization tools that bridged the gap between complex data science and accessible business intelligence. Central to this movement was Google Data Studio, a platform that transitioned from a niche beta product to a cornerstone of digital reporting. By late 2017 and early 2018, the industry witnessed a surge in sophisticated dashboards that moved beyond mere spreadsheets, utilizing data to tell compelling stories in both corporate boardrooms and public journalistic forums. This evolution allowed organizations to move from reactive data collection to proactive insight generation, fundamentally altering how information was consumed and communicated across various sectors.
The Evolution of Business Reporting and Operational Efficiency
One of the most significant impacts of the visualization revolution was the drastic reduction in the time required to produce actionable reports. Historically, digital marketing and SEO reporting were labor-intensive processes, often requiring manual data extraction from multiple sources, followed by hours of formatting in static presentation software. A landmark case study from this era involves Boat International Media, a leading luxury yachting lifestyle brand.
Prior to adopting Google Data Studio, the reporting team at Boat International Media faced a monthly reporting cycle that consumed five business days. By leveraging automated data connectors, analysts Fanni Takacs and Drew Broomhall were able to condense this workflow into a fifteen-minute automated process. The transition was not merely about speed; it focused on the aesthetic and functional quality of the reports. The organization prioritized a design-first approach, ensuring that SEO performance metrics were presented without clutter, making them suitable for both interactive online viewing and professional PDF distribution to stakeholders. This shift highlighted a growing industry trend: the "death of the data dump" in favor of curated, high-impact insights.
Enhancing Analytics Through Interactive Templates
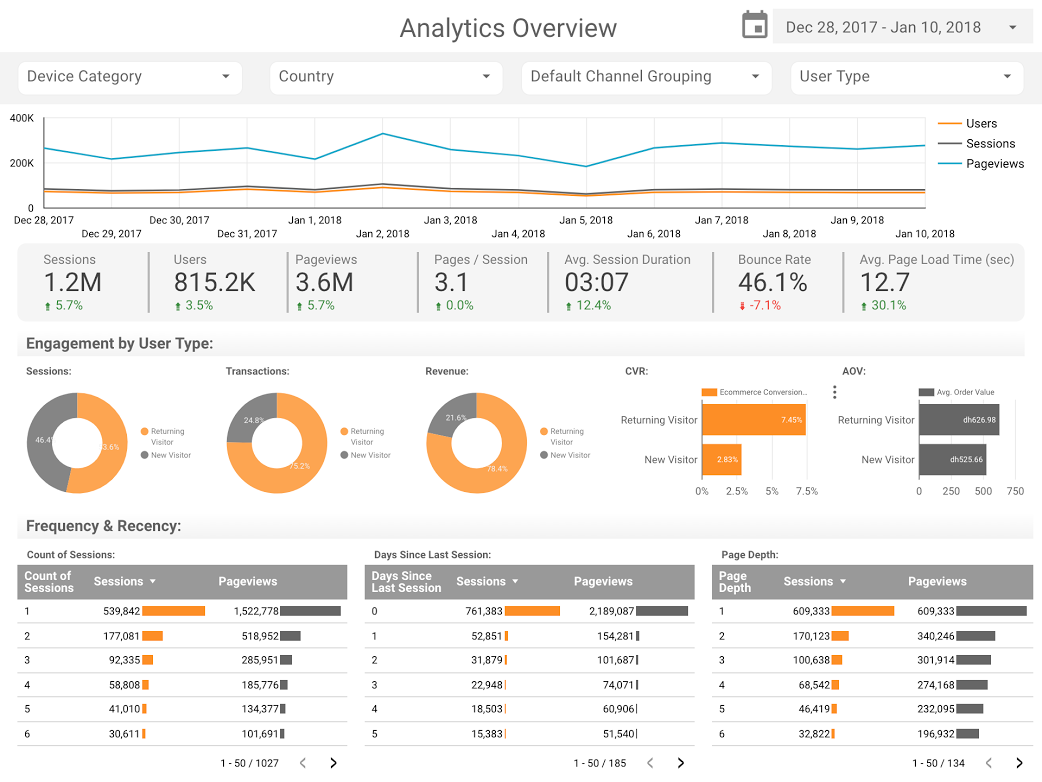
The accessibility of Google Data Studio was further catalyzed by the development of standardized templates, which allowed businesses to bypass the steep learning curves typically associated with business intelligence (BI) software. Agencies like ClickInsight and E-Nor became instrumental in this space, creating frameworks that allowed users to visualize Google Analytics data with minimal configuration.

Sunil Attri, a Senior Consultant at E-Nor, pioneered dashboard designs that utilized the platform’s native data connections to provide compact, interactive overviews of web activity. These dashboards introduced features such as date-range comparisons, filter controls, and drill-down capabilities that were previously reserved for high-end enterprise tools. The ability to see real-time shifts in traffic patterns and user behavior became a standard requirement for digital teams, rather than a luxury.
Furthermore, firms like Analytics Pros pushed the boundaries of standard visualization by incorporating advanced chart types to measure performance against objectives. By utilizing bullet charts, the team was able to provide a three-dimensional view of page-level engagement. These charts allowed analysts to compare current performance against the previous year’s data while simultaneously measuring progress against specific benchmark targets. This methodology moved the conversation from "how much traffic did we get?" to "how is this traffic performing relative to our strategic goals?"
The Rise of Data Journalism and Public Storytelling
Parallel to the business applications, 2017 and 2018 saw the rise of "data storytelling" as a form of journalism. Individual creators and advocates began using publicly available datasets to explore cultural phenomena, making complex information engaging for the general public.
A prominent example of this was the comparative analysis of the Marvel and DC Cinematic Universes. By early 2018, the global box office for superhero films had exceeded $27 billion, creating a massive dataset for financial and critical analysis. Visualizations created during this period allowed fans and industry analysts to track the comparative success of these franchises, mapping box office returns against critical reception and audience sentiment. These reports demonstrated that Google Data Studio was not limited to corporate KPIs but was a viable medium for cultural commentary.
Similarly, the "data behind Star Wars" became a popular subject for analytical exploration. ClickInsight released reports that cataloged the technical specifications of starships, character demographics, and world-building details from the epic saga. By translating fictional universes into structured data, these projects showcased the versatility of the tool in handling diverse data types and nested information.

Big Data and the Open Source Ecosystem
The technical prowess of Google Data Studio was perhaps most evident when integrated with Google BigQuery, a serverless data warehouse capable of processing petabytes of information. Felipe Hoffa, a Developer Advocate at Google, utilized this integration to analyze the state of open-source software in 2017.
By querying millions of "PushEvents" published by GitHub, Hoffa was able to visualize the contributions of both individuals and major corporations to the open-source community. This analysis provided a factual foundation for discussions regarding which tech giants were truly driving innovation in the public domain. The use of the BigQuery connector was a significant milestone, as it proved that web-based visualization tools could handle "Big Data" without the lag or crashes associated with legacy software. It provided a transparent look at the labor that powers the modern web, identifying the top contributors and trending programming languages with unprecedented clarity.
Long-term Social Trends: A Century of Data
Beyond entertainment and technology, data visualization was used to examine deep-seated social trends. An in-depth analysis of 150 years of marriage and divorce trends in the United Kingdom, conducted by researchers including Lizzie Silvey, utilized historical data from the Office for National Statistics (ONS).
This project addressed complex sociological questions: How do global conflicts, such as World War I and II, impact marriage rates? What was the immediate statistical effect of the Divorce Reform Act of 1969? By mapping these trends over a century and a half, the visualization provided a longitudinal view of social evolution. It revealed that spikes in divorce rates often correlated directly with legislative changes rather than sudden shifts in social morality, providing a nuanced perspective that raw numbers alone could not convey.
Technical Analysis of Implications and Industry Impact
The success of Google Data Studio during this period can be attributed to three primary factors: integration, cost, and user experience. By making the tool free for the general public and integrating it seamlessly with the G Suite (now Google Workspace) and Google Cloud Platform, Google lowered the barrier to entry for data literacy.
- The Democratization of BI: Before 2017, powerful data visualization was often locked behind expensive licenses for tools like Tableau or Qlik. Data Studio allowed small to medium-sized enterprises (SMEs) to compete with larger corporations in terms of reporting sophistication.
- Real-time Collaboration: Following the model of Google Docs, the platform allowed multiple users to edit a dashboard simultaneously. This transformed reporting from a solitary task into a collaborative team effort, fostering a culture of data-driven decision-making.
- The Shift to Cloud-Native Data: The reliance on connectors rather than manual uploads encouraged businesses to move their data to the cloud. This trend accelerated the adoption of automated data pipelines, which are now standard in modern data engineering.
The implications of this shift were profound. Organizations that embraced these tools saw improved internal communication and more rapid responses to market changes. In the journalistic sphere, the ability to embed interactive charts directly into articles increased reader engagement and provided a higher level of transparency, as readers could often filter and explore the data for themselves.
Conclusion and Future Outlook
The examples showcased in late 2017 and early 2018 served as a blueprint for the future of information design. From Boat International Media’s efficiency gains to the granular analysis of UK social history, the versatility of Google Data Studio proved that data, when visualized effectively, ceases to be an abstract concept and becomes a powerful narrative tool.
As the platform eventually evolved into Looker Studio, the principles established during this era—clarity, accessibility, and interactivity—remained the gold standard for data communication. The transition toward automated, visually compelling reporting is now complete, with the "static report" being largely replaced by the "living dashboard." For professionals and hobbyists alike, the lesson of 2018 remains clear: the value of data lies not in its collection, but in the clarity with which it can be presented to the world.