In an increasingly complex digital landscape, where brands navigate a multitude of social platforms, the social media dashboard has emerged as an indispensable tool for tracking, analyzing, and reporting on performance. Far from a mere convenience, these centralized visual interfaces are now a strategic imperative for enterprises aiming to understand their digital footprint, optimize campaigns, and demonstrate tangible returns on investment. By aggregating critical metrics from diverse social channels into a single, cohesive view, dashboards empower marketing teams to transcend the fragmentation of individual platform analytics, fostering data-driven decision-making and enhancing overall strategic agility.

The journey to unified social intelligence began with the rapid proliferation of social media platforms in the late 2000s and early 2010s. What started as novel communication channels quickly evolved into powerful marketing and customer service arenas. Early digital marketers grappled with the challenge of manually logging into platforms like Facebook, Twitter (now X), LinkedIn, and eventually Instagram and TikTok, to extract performance data. This fragmented approach led to inefficiencies, delayed reporting, and a lack of a holistic view of social media efforts. The sheer volume of data generated by billions of users and millions of brands created a "data deluge," making manual analysis impractical and prone to error. This environment spurred the development of specialized tools designed to centralize and visualize this disparate data, giving rise to the modern social media dashboard.
At its core, a social media dashboard is a sophisticated analytical hub that consolidates data from all connected social media accounts into one intuitive, visual interface. Instead of the cumbersome process of accessing native analytics on each platform, a dashboard provides an immediate, at-a-glance understanding of what strategies are succeeding, where improvements are needed, and how social media activities align with broader business objectives. These tools typically feature real-time or near-real-time data streams, offering immediate insights into campaign performance. Customization is a key attribute, allowing users to tailor visualizations—such as charts, graphs, and tables—and apply filters by platform, date range, specific campaign, or metric. The market for these solutions ranges from free, albeit more manual, tools like Google Looker Studio, to comprehensive, all-in-one platforms such as Hootsuite, which integrate scheduling, publishing, and cross-platform analytics capabilities.

Driving Strategic Decisions: The Business Case for Unified Data
The economic significance of social media marketing underscores the critical role of robust analytical dashboards. With over $121 billion in US social ad spending projected for 2026, and global social media ad spending on pace to reach an astounding $480 billion by 2030, the stakes for optimizing digital campaigns are exceptionally high. For enterprise teams managing multiple brands, diverse campaigns, and numerous stakeholders, social media dashboards are no longer a luxury but a fundamental operational necessity, solving pervasive challenges in efficiency, responsiveness, and accountability.
One of the most immediate benefits is accelerated reporting and enhanced efficiency. The traditional method of compiling monthly or quarterly performance reports often involved hours, if not days, of manual data extraction and consolidation from various native analytics interfaces. Dashboards dramatically streamline this process, enabling teams to export comprehensive data sets and compelling visualizations in minutes. This significant reduction in administrative overhead frees up valuable marketing resources, allowing teams to dedicate more time to strategic planning, content creation, and campaign execution rather than data wrangling. As one industry expert noted, "Time saved on reporting is time invested in innovation. Dashboards are the engine that drives this efficiency."
Furthermore, dashboards facilitate real-time agility and course correction. In the fast-paced digital environment, delayed reactions can lead to missed opportunities or exacerbated issues. When performance data is scattered across multiple platforms, marketers are inherently operating in a reactive mode. A centralized dashboard offers an immediate, at-a-glance view of ongoing campaign performance, highlighting what is working and, crucially, what is not. This real-time visibility empowers teams to pivot their social media strategy when it truly matters, adjusting content, targeting, or budget allocations to optimize outcomes. The integration of AI-enhanced insights further augments this capability, automatically surfacing emerging trends, anomalies, and predictive indicators that human analysts might otherwise overlook, enabling proactive rather than retroactive adjustments.
Perhaps most critically, dashboards are instrumental in demonstrating tangible ROI to leadership. A persistent challenge for social media teams, particularly when 59% of CMOs report insufficient budget to execute their strategy, is to unequivocally connect their efforts to measurable business outcomes. Dashboards provide the necessary framework for this by presenting performance data within a historical context, allowing for comparisons against previous periods and continuous tracking of progress toward defined business goals. They enable the presentation of data that resonates with leadership, including social media metrics directly tied to revenue generation, lead acquisition, customer lifetime value, and brand health. This evidence-based approach is vital for justifying budget allocations, securing additional investment, and cementing social media’s strategic value within the organization.
Tailored Insights: Dashboard Types and Key Metrics
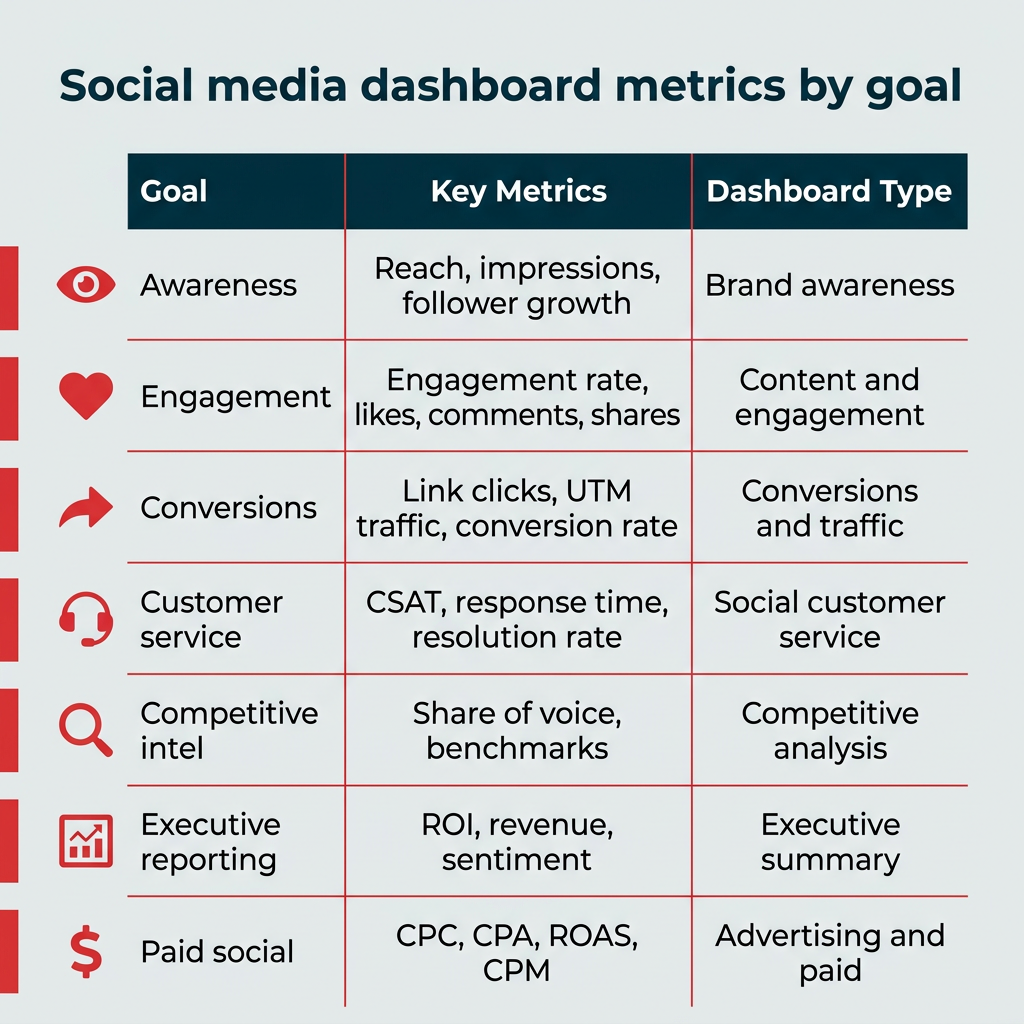
Effective social media dashboards are not one-size-fits-all; their utility lies in their ability to align metrics directly with specific business objectives. Tracking every available data point can lead to information overload and "dashboard clutter," hindering actionable insights. Conversely, focusing on the right metrics, tailored to particular goals, ensures that the dashboard remains a powerful tool for informed decision-making. Different strategic goals necessitate different types of dashboards, each prioritizing a distinct set of key performance indicators (KPIs).
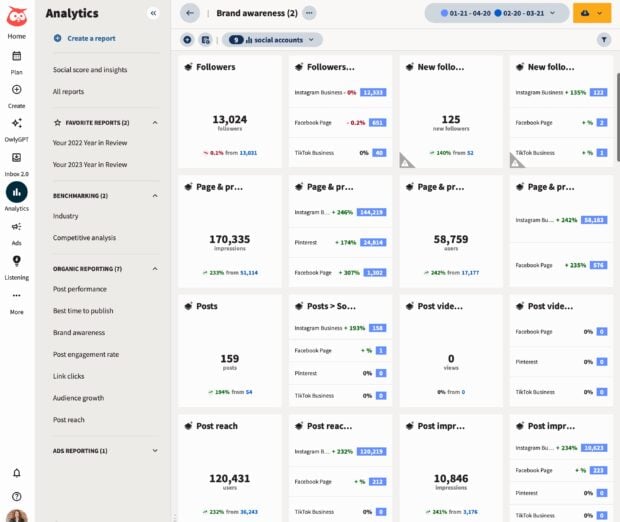
For Brand Awareness, dashboards focus on metrics that illustrate the reach and visibility of content and brand presence. Key metrics include:
- Reach: The unique number of users who saw content.
- Impressions: The total number of times content was displayed.
- Follower Growth: The increase in audience size over time.
- Share of Voice: The proportion of conversation about a brand compared to competitors.
- Brand Mentions: The number of times a brand is mentioned on social media.
This type of dashboard is crucial for understanding how widely a brand’s message is disseminated and how its audience is expanding across various demographics and regions.
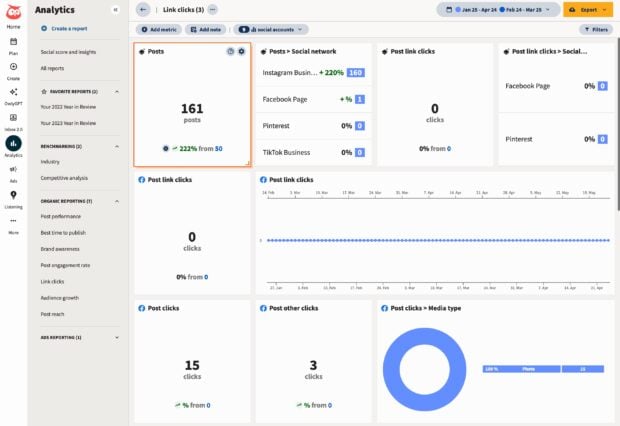
Conversions and Traffic Dashboards measure the effectiveness of social media in driving users to desired actions, such as website visits or purchases. Key metrics include:
- Link Clicks: The number of times users clicked on links in social posts.
- UTM-Tracked Traffic: Website traffic attributed to specific social campaigns using UTM parameters.
- Conversion Rate: The percentage of clicks that result in a desired action (e.g., signup, purchase).
- Cost Per Conversion (CPC): The average cost incurred for each conversion.
For full-funnel measurement, integrating this data with tools like Google Analytics or customer relationship management (CRM) systems is essential to trace social media engagement to tangible sales and pipeline contributions.
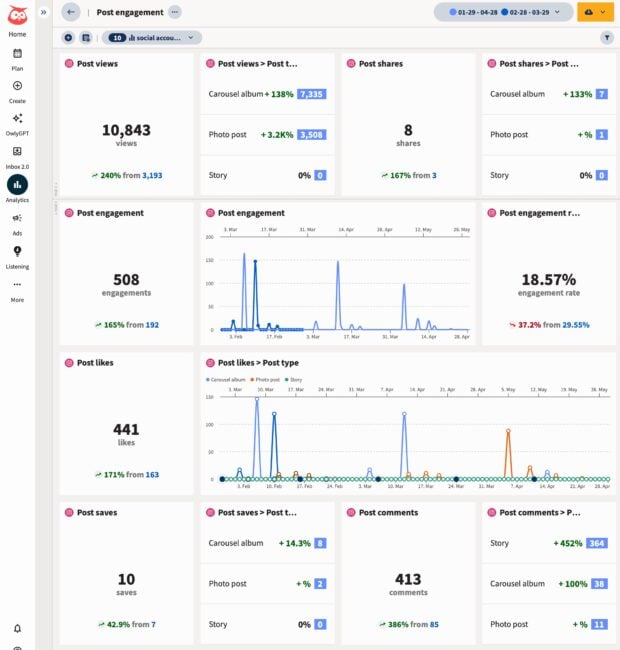
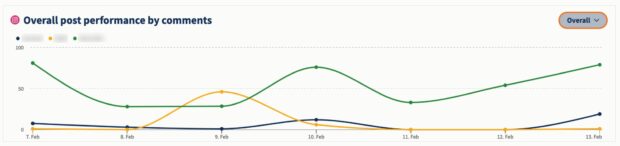
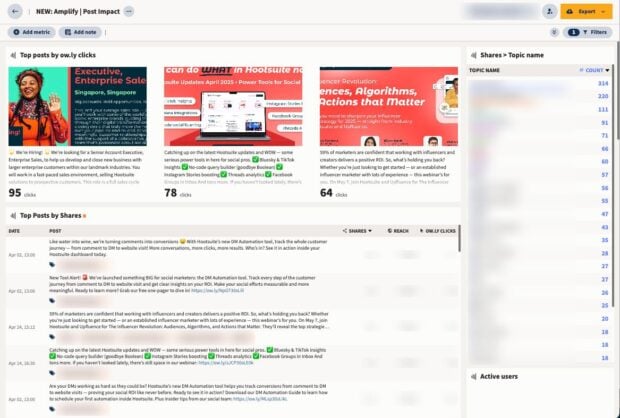
The Content and Engagement Performance Dashboard offers insights into how well content resonates with the audience. Key metrics include:
- Engagement Rate: The percentage of the audience that interacts with content.
- Likes, Comments, Shares, Saves: Direct indicators of audience interaction.
- Video Views/Completion Rate: For video content, indicating audience retention.
- Click-Through Rate (CTR): The percentage of users who click a link after viewing content.
Engagement rate is a vital indicator, moving beyond "vanity metrics" to directly represent content relevance. This dashboard helps identify top-performing content formats and themes, allowing marketers to refine their content strategy and replicate success.
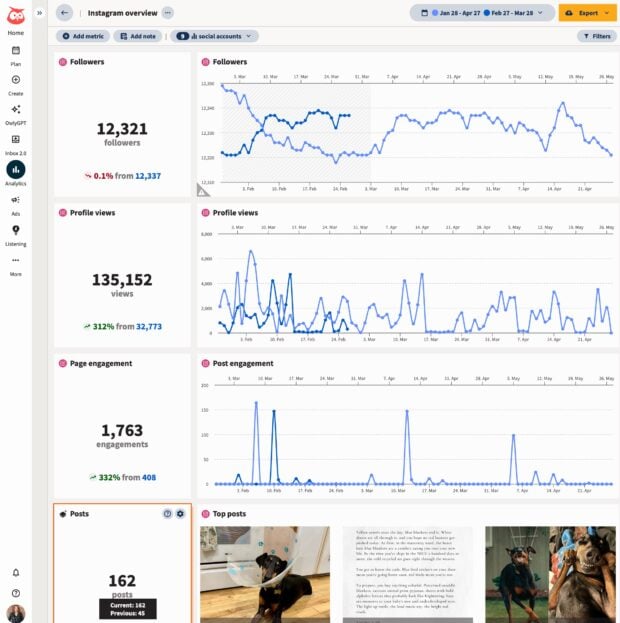
Network-Specific Dashboards provide granular insights into individual platforms, recognizing that each channel has unique audience demographics, content formats, and performance benchmarks. While overall dashboards offer a macro view, platform-specific analysis for Instagram, LinkedIn, X, or TikTok reveals nuances that aggregate data might obscure. Metrics here are tailored to the platform’s unique features, such as Instagram Stories reach, LinkedIn post impressions, or TikTok video watch time, enabling optimization for each channel’s distinct ecosystem.
A Social Listening Dashboard leverages advanced tools to monitor and analyze public conversations around a brand, industry, or specific topics across social media. Key metrics include:
- Sentiment Analysis: The proportion of positive, neutral, or negative mentions.
- Keyword Trends: Identifying popular terms and topics.
- Volume of Mentions: The frequency of brand or topic mentions.
- Influencer Identification: Discovering key voices discussing relevant subjects.
This dashboard is crucial for reputation management, identifying emerging trends, understanding customer perception, and informing content strategy based on real-time public discourse.
Competitive Analysis Dashboards benchmark a brand’s social performance against direct competitors and industry averages. Key metrics include:
- Competitor Follower Growth: Tracking audience expansion of rivals.
- Competitor Engagement Rates: Comparing how audiences interact with competitor content.
- Share of Voice vs. Competitors: Measuring brand visibility relative to the competition.
- Top Performing Content (Competitors): Identifying successful strategies employed by rivals.
This intelligence informs content strategy, helps justify budget requests, and reveals untapped opportunities or gaps in the market.
Social Customer Service Dashboards monitor the efficiency and effectiveness of customer interactions on social media. With 81% of customers now expecting faster service due to new technologies, these dashboards are crucial. Key metrics include:

- CSAT Score (Customer Satisfaction): Ratings of customer service interactions.
- Response Time: The average time taken to respond to customer inquiries.
- Resolution Rate: The percentage of customer issues successfully resolved.
- Volume of Inquiries: The total number of customer service requests received via social media.
These dashboards help evaluate and improve customer care initiatives, proving the ROI of social customer service.
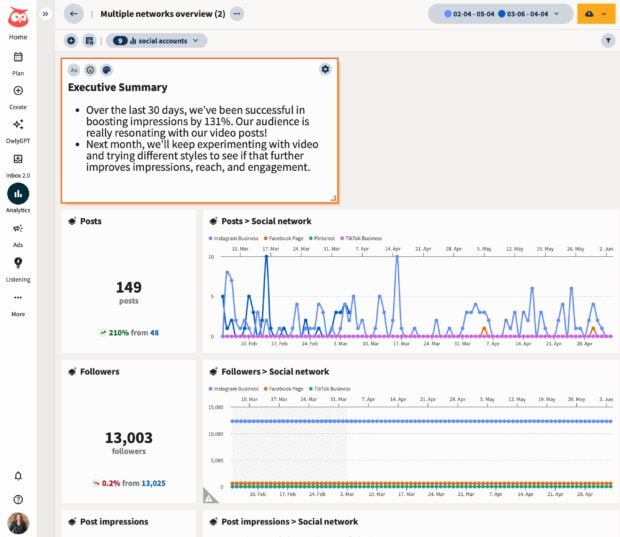
An Executive Summary Dashboard distills complex data into high-level, actionable insights for senior leadership. Unlike detailed operational dashboards, this focuses on macro trends and strategic impact. Key metrics typically include:
- Overall ROI: Financial returns directly attributable to social media.
- Revenue Impact: Social media’s contribution to sales.
- Goal Progress: Tracking against major business objectives.
- Overall Brand Sentiment: A summary of public perception.
- Key Performance Indicators (KPIs): High-level metrics reflecting strategic success.
These dashboards ensure that leaders receive concise, relevant information without being overwhelmed by granular details, enabling them to quickly grasp social media’s contribution to organizational goals.
Employee Advocacy Dashboards measure the impact of employees sharing company-approved content on their personal social media networks. Key metrics include:
- Reach Expansion: The additional audience reached through employee shares.
- Engagement from Employee Shares: Interactions generated by employee-shared content.
- Employee Participation Rate: The percentage of employees actively participating in advocacy programs.
- Click-Through Rate (CTR) from Employee Shares: Traffic driven by employee posts.
Employee advocacy significantly amplifies reach, builds trust through authentic voices, and strengthens employee connection to the brand.
Finally, Advertising and Paid Social Dashboards offer a unified view of paid campaign performance across platforms. Key metrics include:
- Cost Per Click (CPC): The cost incurred for each click on an ad.
- Cost Per Acquisition (CPA): The cost to acquire a customer or lead through paid social.
- Return on Ad Spend (ROAS): The revenue generated for every dollar spent on advertising.
- Cost Per Mille (CPM): The cost per thousand impressions.
These dashboards allow marketers to compare organic and paid performance side-by-side, optimizing ad spend and uncovering synergies between different campaign types.
Best Practices for Dashboard Implementation and Maintenance
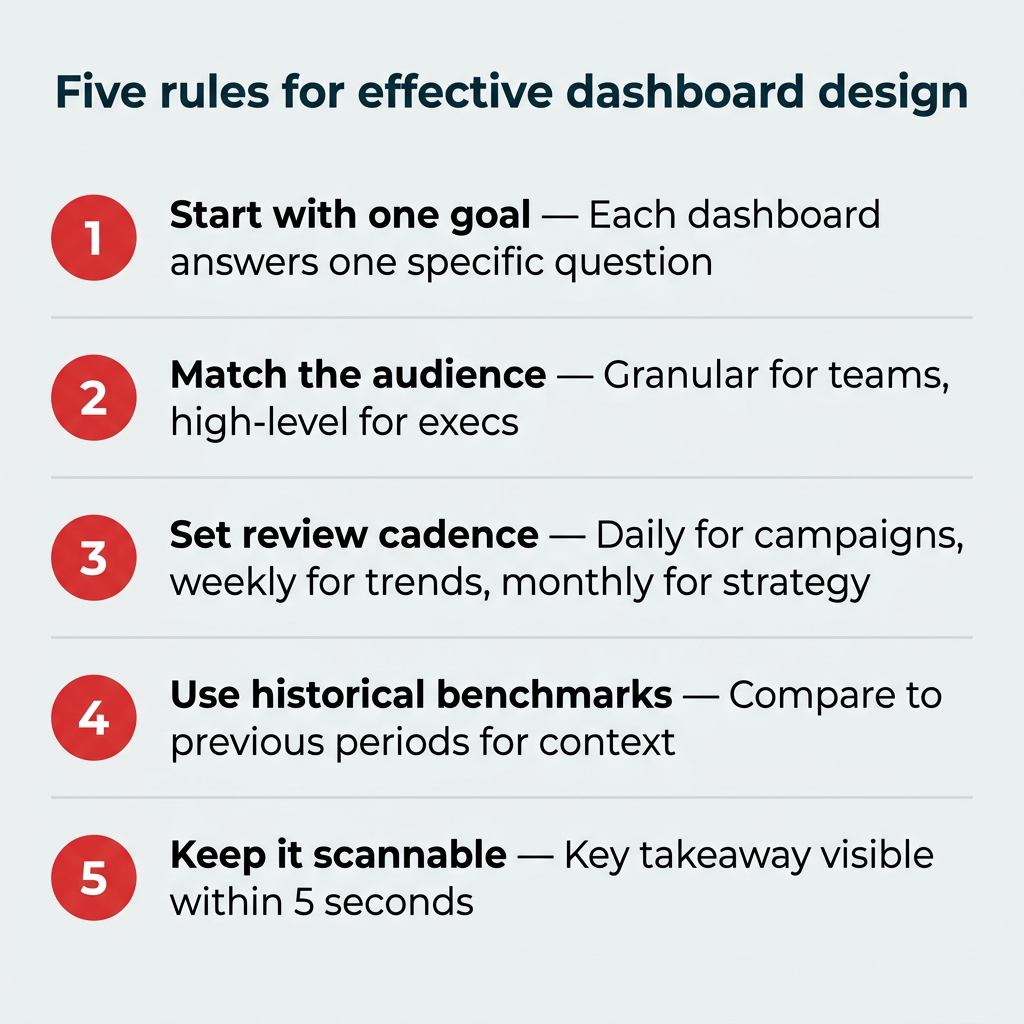
While having access to robust dashboard templates is a strong starting point, the true value is realized through strategic setup and ongoing maintenance. To ensure dashboards remain effective tools that drive action rather than collect dust, several best practices should be adhered to.
Firstly, define clear objectives and target audiences for each dashboard. Before building, clarify what questions the dashboard needs to answer and who will be using it. This ensures that only relevant metrics are included, preventing information overload. Secondly, prioritize simplicity and clarity in design. Dashboards should be easy to read and understand at a glance. Use clear labels, consistent color schemes, and avoid excessive clutter. The goal is rapid comprehension. Thirdly, ensure data accuracy and integration. Dashboards are only as valuable as the data they display. Verify that data sources are correctly connected, regularly refreshed, and accurately reflect performance across all platforms and integrated systems (e.g., CRM, Google Analytics).

Fourthly, establish a regular review and update cadence. Social media trends and business objectives evolve, and dashboards must adapt accordingly. Schedule periodic reviews to assess the relevance of metrics, update visualizations, and incorporate new data sources. Finally, foster user adoption and provide training. Even the most sophisticated dashboard is useless if teams don’t understand how to interpret and act on its insights. Provide training sessions and documentation to ensure all stakeholders can effectively leverage the data for their respective roles.
Building Your Own: A Practical Guide (Google Looker Studio Example)
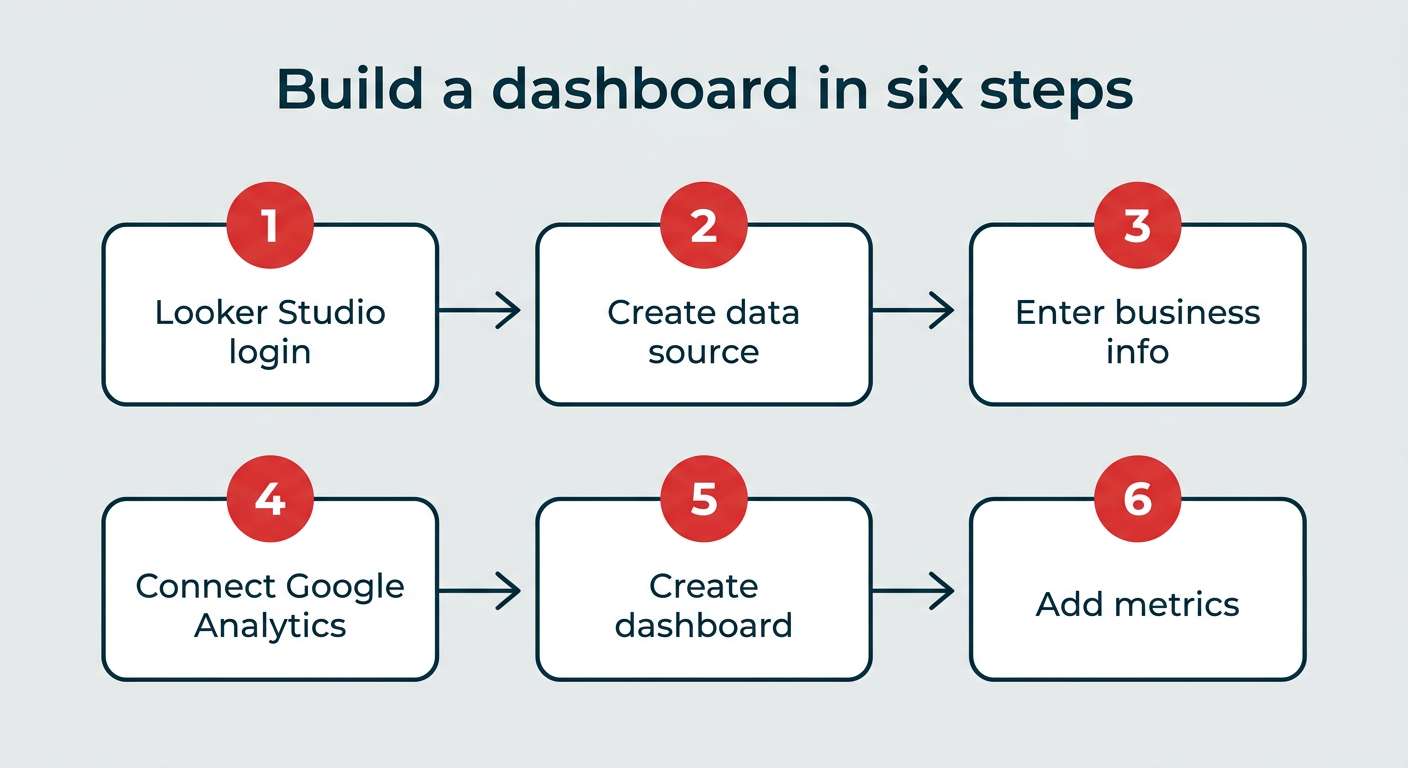
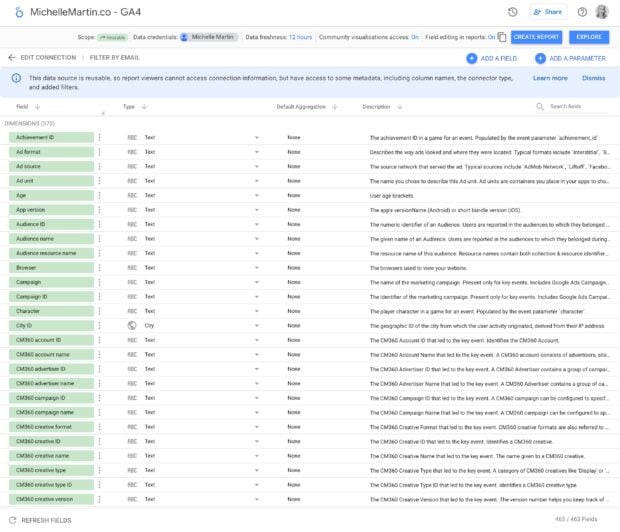
For organizations seeking a cost-effective solution or those with specific customization needs, building a social media dashboard using free tools like Google Looker Studio (formerly Google Data Studio) is an option. While this approach requires more manual setup and ongoing maintenance compared to integrated, all-in-one platforms, it offers significant flexibility. The process generally involves six key steps, requiring a Google account, data from social media platforms, and potentially Google Analytics for deeper website traffic insights.
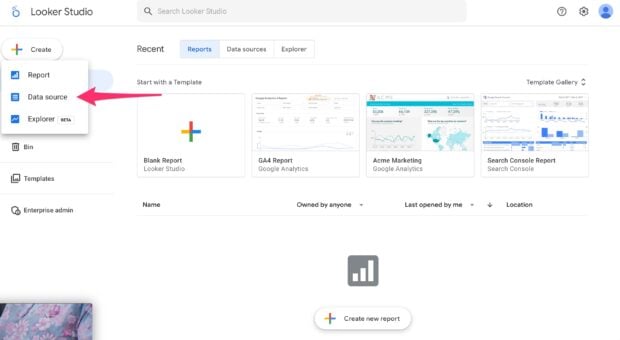
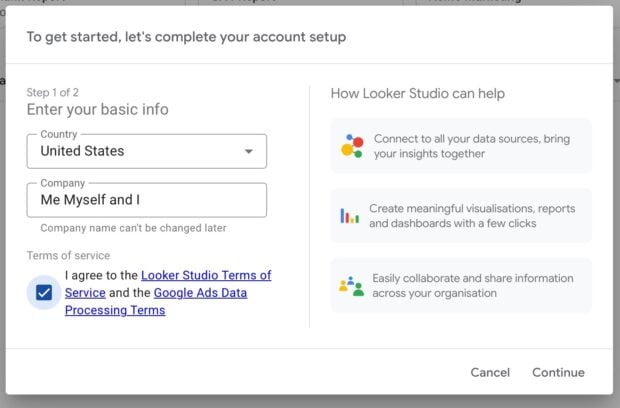
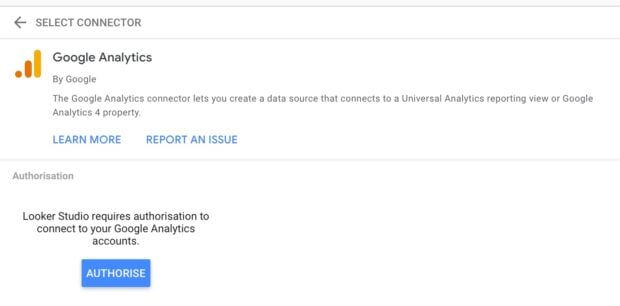
The initial step involves logging into Google Looker Studio with a Google account. Once authenticated, users proceed to create a new data source. This critical phase establishes the connection between the dashboard and the raw data. After entering basic business information and agreeing to terms, the platform prompts users to connect their data sources. For social media analysis, connecting Google Analytics is a common starting point, allowing the dashboard to pull website traffic and conversion data influenced by social media. After authorizing the connection to the Google Analytics account, a dense, raw data view typically appears. The next step is to create a new report from this data view, which transforms the interface into a blank canvas. The final and most labor-intensive step is to add metrics and finalize the dashboard. Users must manually select and position desired metrics from a vast list, add headings, apply filters, and adjust the layout to create a perfectly customized dashboard. While this method offers unparalleled customization, it demands significant time and technical proficiency, and lacks the automatic updates and integrated publishing features of dedicated social media management platforms.
Choosing the Right Solution: Key Evaluation Criteria
The choice of a social media dashboard solution is a strategic decision that hinges on several factors, including team size, the number of platforms managed, budget constraints, and the desired level of automation and insight. Not all solutions are created equal, and a thorough evaluation of features is essential.
Foremost is data integration capabilities. A robust dashboard should connect seamlessly with all relevant social media platforms (Facebook, Instagram, X, LinkedIn, TikTok, YouTube, Pinterest, etc.) as well as other critical marketing and business tools like Google Analytics, CRM systems, and advertising platforms. The breadth and depth of these integrations determine the comprehensiveness of the insights. Real-time vs. scheduled updates is another crucial consideration; while most modern platforms offer near real-time data, understanding the update frequency is vital for time-sensitive decision-making.
Customization and reporting features are paramount for tailoring dashboards to different stakeholders. The ability to create bespoke reports, apply granular filters, and visualize data in various formats ensures that insights are relevant and digestible for everyone from social media managers to C-suite executives. For enterprise teams, scalability is non-negotiable. The solution must be able to handle a growing number of accounts, campaigns, and users without compromising performance or data integrity.
Finally, user experience, support, and the presence of AI-powered insights differentiate leading solutions. An intuitive interface reduces the learning curve and increases adoption, while responsive customer support ensures issues are quickly resolved. The increasing integration of artificial intelligence for anomaly detection, trend prediction, and automated recommendations provides a significant competitive advantage, transforming raw data into truly actionable intelligence.
Expert Commentary and Future Outlook
Industry experts consistently emphasize that robust social media dashboards are no longer a luxury but a fundamental component of any data-driven marketing strategy. "The ability to synthesize data from disparate sources into actionable insights is paramount for modern enterprises seeking to optimize their digital footprint and secure a competitive edge," states a leading marketing analyst. "In an environment where every marketing dollar is scrutinized, dashboards provide the undeniable evidence of impact."
Looking ahead, the evolution of social media dashboards is expected to accelerate. We can anticipate even deeper integration with emerging technologies, including more sophisticated AI for predictive analytics, hyper-personalized dashboard views for individual users based on their roles and needs, and enhanced cross-platform attribution modeling that more precisely links social interactions to ultimate business outcomes. The future of social media intelligence will likely see dashboards become even more proactive, offering prescriptive recommendations rather than just descriptive data, thereby transforming them from analytical tools into strategic growth engines.
In conclusion, the social media dashboard stands as the central nervous system for modern enterprise digital strategy. By offering a unified, real-time, and customizable view of performance across a fragmented social landscape, these tools empower organizations to move beyond guesswork. They facilitate efficient reporting, enable agile decision-making, and critically, provide the tangible evidence required to demonstrate social media’s profound impact on overarching business objectives, ensuring continued investment and strategic alignment in an ever-evolving digital world.