A social media dashboard serves as a pivotal centralized platform, meticulously aggregating and visualizing performance metrics from diverse social media accounts into a single, cohesive interface. This sophisticated tool is designed for comprehensive tracking, in-depth analysis, and streamlined reporting of social media performance, transcending the limitations of platform-specific analytics. In an era where digital presence is paramount, these dashboards offer businesses an indispensable unified view of their social media landscape, revealing insights into content effectiveness, audience engagement, and overall campaign success relative to broader business objectives.

The Evolution and Imperative of Centralized Social Analytics
The landscape of digital marketing has undergone a radical transformation over the past two decades. What began with rudimentary website traffic analysis and basic social media interaction counts has evolved into a complex ecosystem demanding sophisticated data management. Early social media efforts often relied on manual data extraction from individual platforms like MySpace, then Facebook, Twitter (now X), LinkedIn, and Instagram. This fragmented approach, while initially manageable for small operations, quickly became an insurmountable challenge as social media grew in ubiquity and complexity. The sheer volume of data, coupled with the proliferation of new platforms and content formats, necessitated a more integrated solution.
The advent of social media dashboards directly addressed this critical need. Instead of marketing teams logging into each platform separately to assess reach, engagement, or conversion rates, a dashboard consolidates this information. This integration provides a holistic picture, enabling marketers to identify trends, pinpoint effective strategies, and understand the interconnectedness of their social efforts across various channels. The shift from siloed data to a unified visual interface represents a significant leap in operational efficiency and strategic decision-making.
With projections indicating over $121 billion in US social ad spending by 2026, according to eMarketer, and global social media ad spending on track to reach $480 billion by 2030, the financial stakes in social media marketing are higher than ever. For enterprise teams navigating multiple accounts, complex campaigns, and diverse stakeholder expectations, social media dashboards are no longer a luxury but a strategic imperative. They solve critical operational challenges, from simplifying reporting to empowering real-time strategic pivots.
Key Benefits for Modern Enterprises
The strategic advantages offered by a well-implemented social media dashboard are multifaceted, impacting efficiency, responsiveness, and accountability within an organization.
- Expedited and Streamlined Reporting: One of the most significant benefits is the drastic reduction in time spent compiling performance reports. Manually collating data from disparate native analytics platforms can consume countless hours, diverting valuable resources from strategic planning and content creation. Dashboards automate this process, allowing for the rapid export of comprehensive data and visualizations for presentations and monthly reports. This efficiency translates directly into more time for strategic thinking and execution.
- Enabling Real-time Decision-Making: In the fast-paced digital environment, delayed reactions can lead to missed opportunities or prolonged underperformance. When performance data is scattered across multiple platforms, insights are often retrospective. A centralized dashboard, providing real-time or near-real-time data, offers an immediate, at-a-glance view of campaign effectiveness. This agility enables marketing teams to identify successful content, detect underperforming campaigns, and pivot strategies promptly. Advanced dashboards often incorporate AI-enhanced insights, which can proactively surface emerging trends, anomalies, or potential issues that might otherwise go unnoticed, further empowering proactive adjustments.
- Demonstrating Return on Investment (ROI) to Leadership: A persistent challenge for social media teams is quantifying their contribution to broader business outcomes. This challenge is exacerbated by budget constraints, with Gartner reporting that 59% of CMOs feel they have insufficient budget to execute their strategies. Dashboards provide the critical data necessary to bridge this gap. By presenting performance in context with historical data, tracking progress against specific business goals over time, and linking social media metrics to tangible outcomes such as revenue generation, lead acquisition, and brand health, teams can effectively justify investments and secure future resources. This data-driven approach fosters greater transparency and accountability, aligning social media efforts with overarching corporate objectives.
Tailoring Dashboards to Strategic Goals: Key Metrics and Types

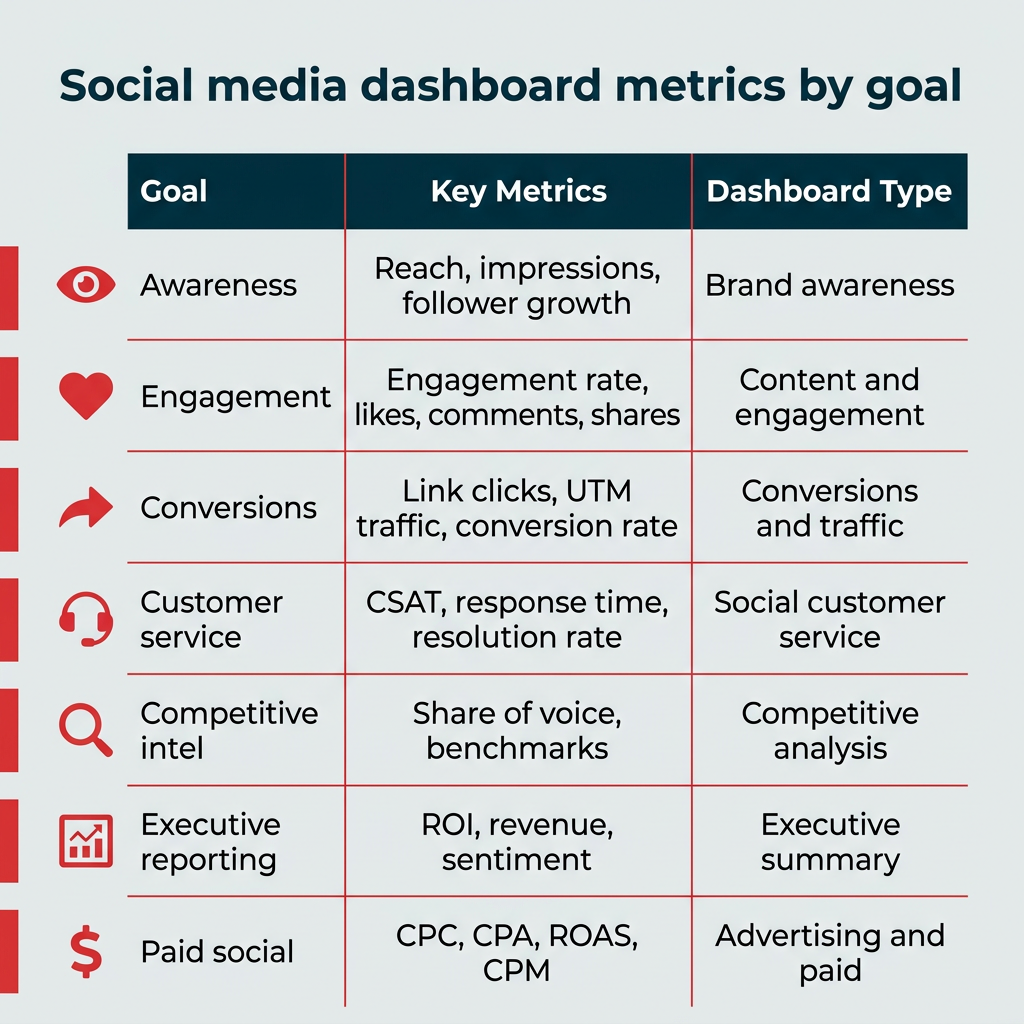
Effective social media dashboards are meticulously designed to align with specific organizational goals. Over-tracking leads to clutter, while strategic tracking facilitates informed decision-making. The choice of metrics and dashboard type should directly correspond to the objectives being pursued.
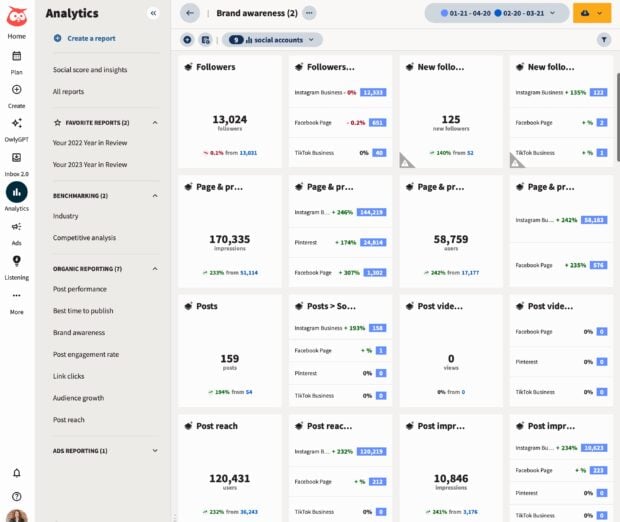
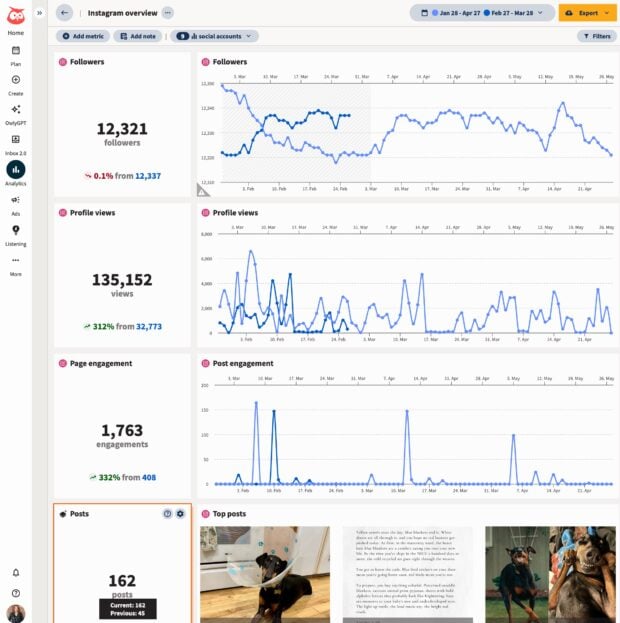
- Brand Awareness Dashboard: This dashboard focuses on metrics that quantify brand visibility and audience growth. Key metrics include Reach (the number of unique users who saw your content), Impressions (the total number of times your content was displayed), and Follower Growth (the rate at which your audience is expanding). For enterprises, tracking awareness is crucial for measuring the impact of large-scale brand campaigns and understanding audience expansion across various demographics or regions.
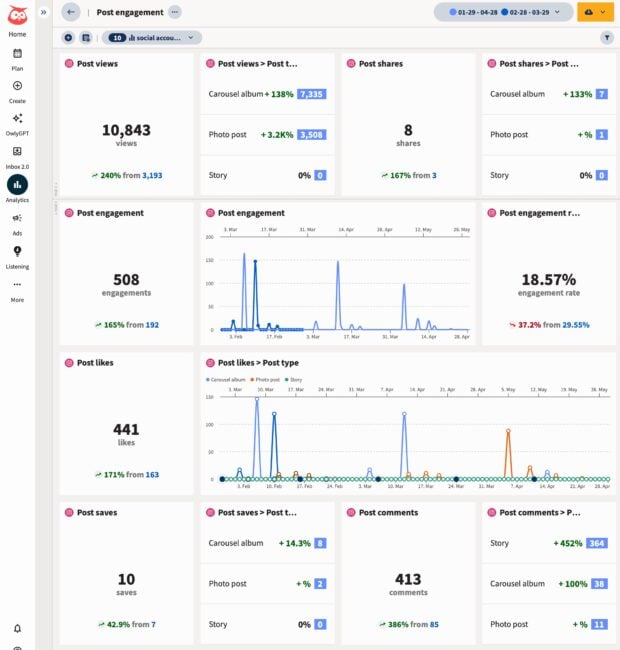
- Content and Engagement Performance Dashboard: This type of dashboard provides insights into how audiences interact with content. Essential metrics include Engagement Rate (the percentage of your audience that interacts with your content), Likes, Comments, Shares, and Saves. Engagement rate is far from a vanity metric; it directly reflects content resonance. This dashboard helps identify top-performing content formats and topics, allowing for strategic content repurposing and optimization.
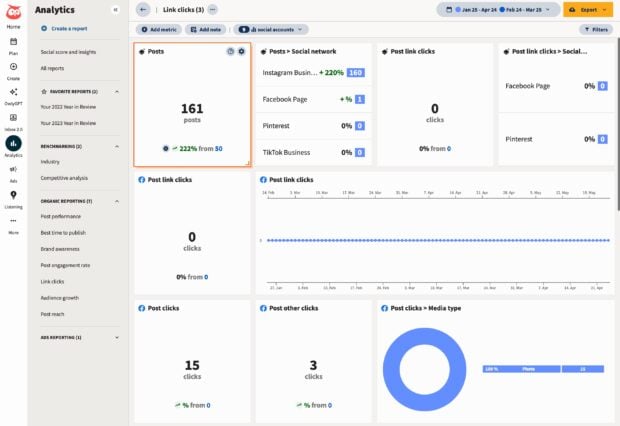
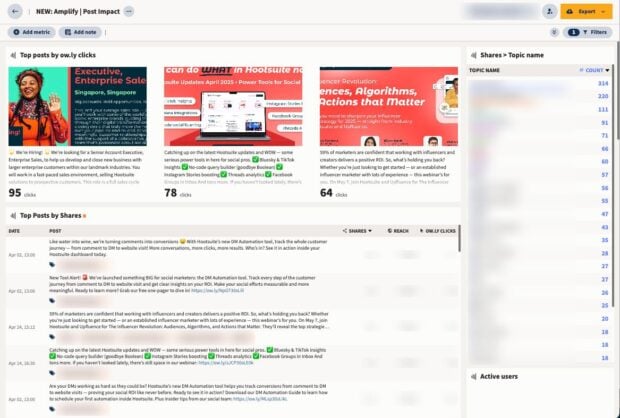
- Conversions and Traffic Dashboard: Designed to measure the tangible business impact of social media, this dashboard tracks actions beyond engagement. Key metrics include Link Clicks (how many users clicked on links in your posts), UTM-tracked Traffic (traffic attributed to specific social campaigns using UTM parameters), and Conversion Rate (the percentage of clicks that result in a desired action, such as a signup or purchase). To achieve full-funnel measurement, data from this dashboard should be integrated with external tools like Google Analytics or a CRM system, connecting social interactions to downstream business outcomes.
- Network-Specific Dashboards: While aggregate dashboards offer a holistic view, platform-specific dashboards delve into the nuances of individual social networks (e.g., Instagram, LinkedIn, Facebook, X, TikTok). These dashboards track metrics relevant to each platform’s unique content formats and audience behaviors. They are crucial for optimizing content strategy for each channel, ensuring that content is tailored to platform expectations and trends.
- Social Listening Dashboard: Moving beyond owned channels, social listening dashboards monitor public conversations across social media to understand brand sentiment, identify emerging trends, and track competitor mentions. Metrics include Mentions (how often your brand or relevant keywords are discussed), Sentiment Analysis (the emotional tone of mentions), and Share of Voice (your brand’s percentage of overall conversation in a specific market). This data is invaluable for reputation management, content strategy refinement, and identifying customer service opportunities.
- Competitive Analysis Dashboard: This dashboard provides a comparative view of your performance against competitors and industry benchmarks. Key metrics include Share of Voice (compared to competitors), Competitor Engagement Rates, Follower Growth Benchmarks, and Content Performance Comparisons. Understanding competitive performance informs strategic positioning, identifies market gaps, and justifies marketing investments.
- Social Customer Service Dashboard: With 81% of customers expecting faster service due to new technologies, efficient social customer service is paramount. This dashboard tracks metrics such as Customer Satisfaction (CSAT) Score (from social interactions), Response Time (how quickly inquiries are addressed), and Resolution Rate (the percentage of issues resolved). These metrics help evaluate the effectiveness of social customer care initiatives and demonstrate their ROI.
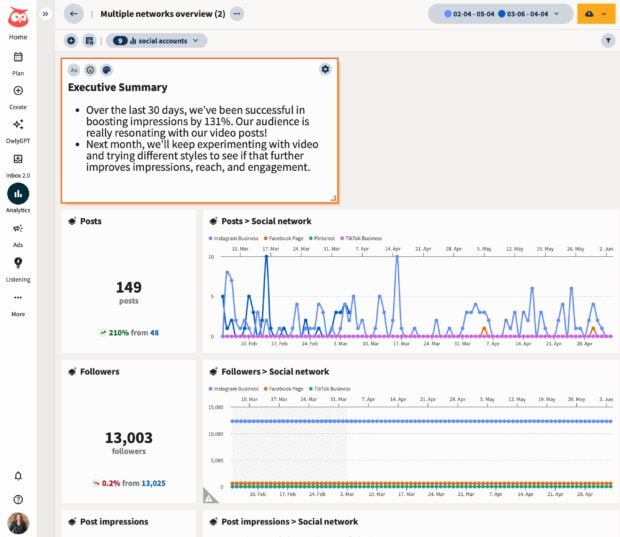
- Executive Summary Dashboard: Tailored for senior leadership, this dashboard presents high-level KPIs and ROI data without overwhelming detail. It typically includes metrics like Overall ROI, Revenue Impact, Progress Towards Business Goals, and aggregated Brand Sentiment. The goal is to provide a concise, actionable snapshot of social media’s contribution to the organization’s strategic objectives.
- Employee Advocacy Dashboard: This dashboard measures the impact of programs where employees share pre-approved company content on their personal social media profiles. Metrics include Employee Reach Expansion, Engagement on Employee-Shared Content, and Lead Generation from Employee Advocacy. Such programs significantly amplify reach and build trust, as content shared by employees often carries more authenticity.
- Advertising and Paid Social Dashboard: Essential for managing paid campaigns, this dashboard tracks the financial and performance metrics of social media advertising. Key metrics include Cost Per Click (CPC), Cost Per Acquisition (CPA), Return on Ad Spend (ROAS), and Cost Per Mille (CPM). This integrated view allows marketers to optimize ad spend, understand the synergy between organic and paid content, and maximize campaign efficiency.
Best Practices for Maximizing Dashboard Utility
The effectiveness of a social media dashboard extends beyond its initial setup; ongoing maintenance and strategic usage are crucial.

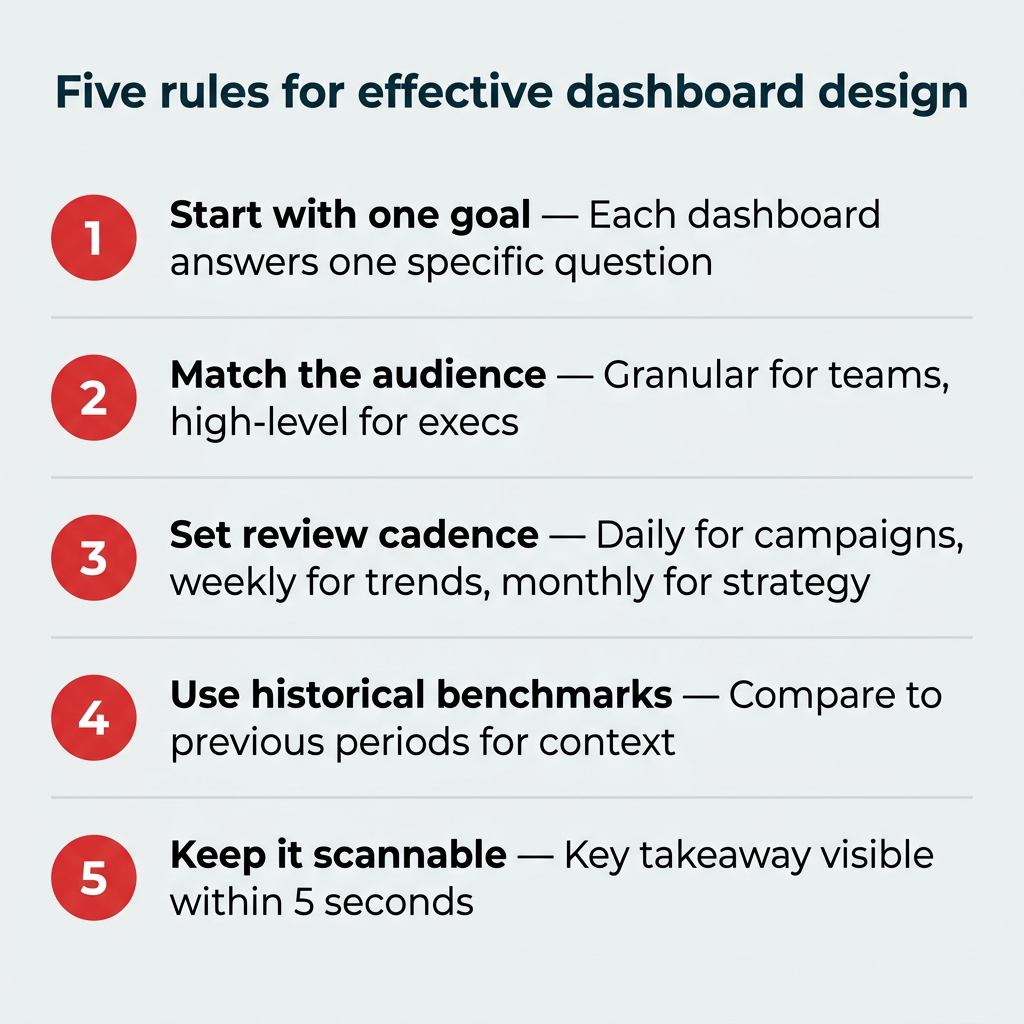
- Align with Specific Goals: Each dashboard should be purpose-built to answer specific business questions or track progress towards defined objectives. Avoid the temptation to include every possible metric; prioritize those that are most actionable and relevant to the dashboard’s purpose.
- Keep it Simple and Visual: Dashboards are meant to provide quick insights. Overly complex designs or excessive data points can lead to cognitive overload. Utilize clear charts, graphs, and visual indicators that make trends and performance instantly recognizable.
- Ensure Data Accuracy and Reliability: The utility of any dashboard hinges on the accuracy of its underlying data. Regularly verify data sources and ensure proper integration to prevent skewed insights.
- Provide Context and Benchmarks: Raw numbers often lack meaning without context. Include historical data comparisons (e.g., month-over-month, year-over-year), industry benchmarks, and defined targets to provide a clear understanding of performance.
- Iterate and Refine Regularly: Social media platforms, algorithms, and business goals are constantly evolving. Dashboards should not be static; regularly review their effectiveness, solicit feedback from users, and make adjustments to ensure they remain relevant and valuable.
Building a Basic Social Media Dashboard with Google Looker Studio
For organizations seeking a cost-effective entry into centralized social media reporting, tools like Google Looker Studio (formerly Google Data Studio) offer a free, albeit more manual, solution. This platform allows users to pull data from various sources and visualize it. To begin, users typically need a Google account, data from their social media platforms (which can often be linked via Google Analytics for website traffic driven by social), and a clear understanding of the metrics they wish to track.
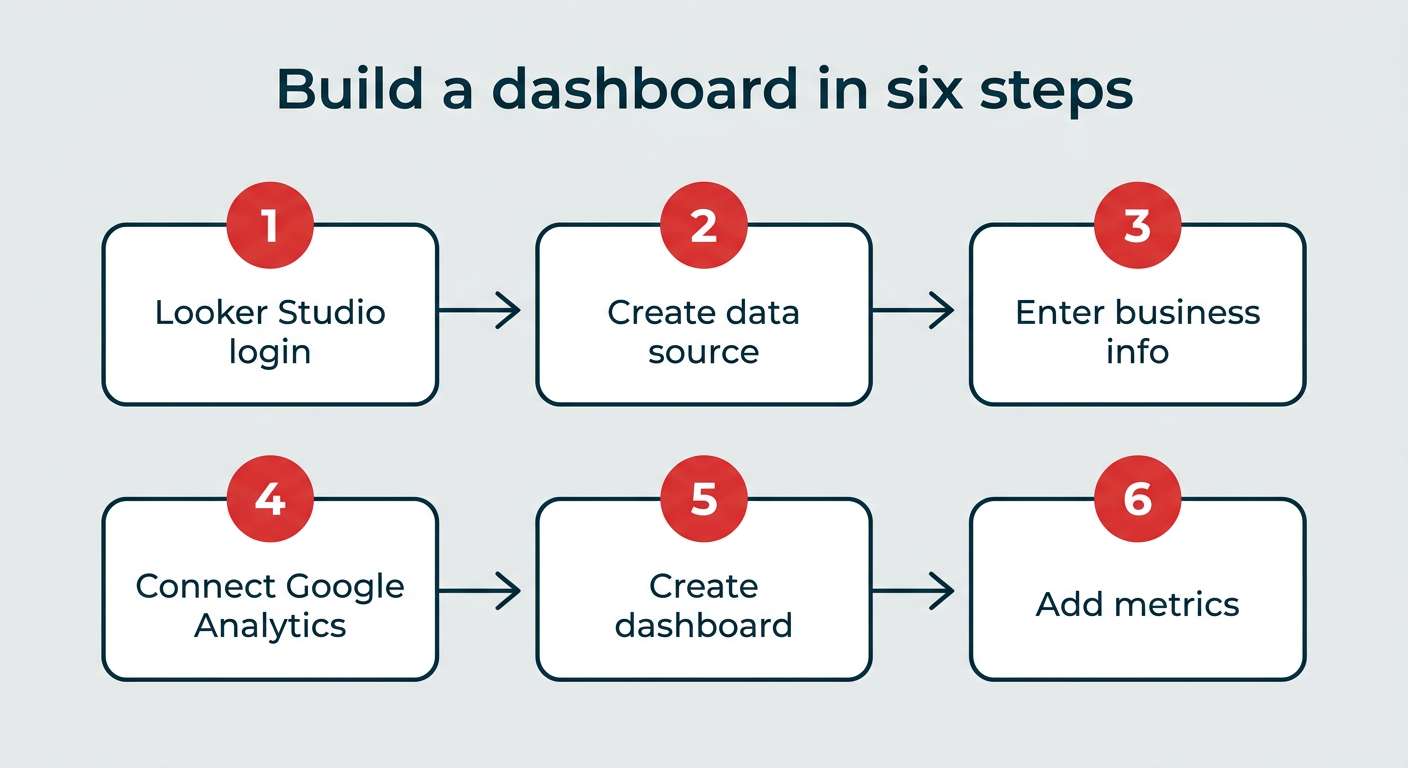
The process involves six key steps:
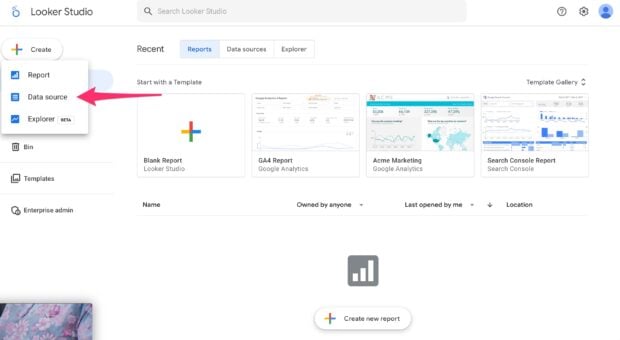
- Log in to Google Looker Studio: Access the platform using a Google account.
- Create a Data Source: Initiate the creation of a new data source within the platform.
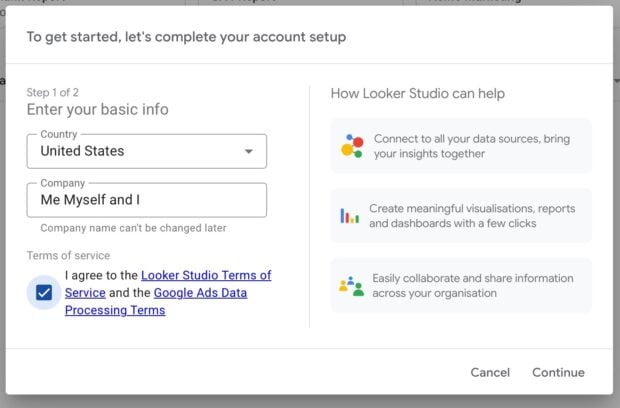
- Enter Business Information: Provide basic organizational details and agree to terms.
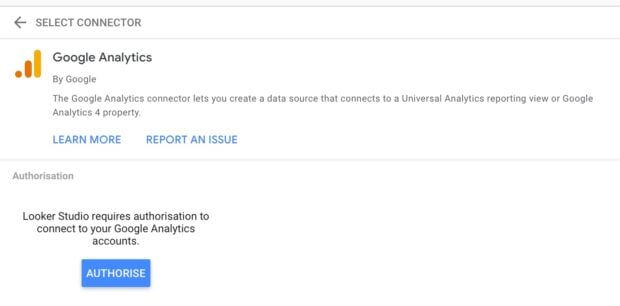
- Connect Google Analytics: Authorize and connect your Google Analytics account, which serves as a crucial bridge for website traffic and conversion data originating from social media. For direct social media platform data, third-party connectors or manual data uploads may be necessary.
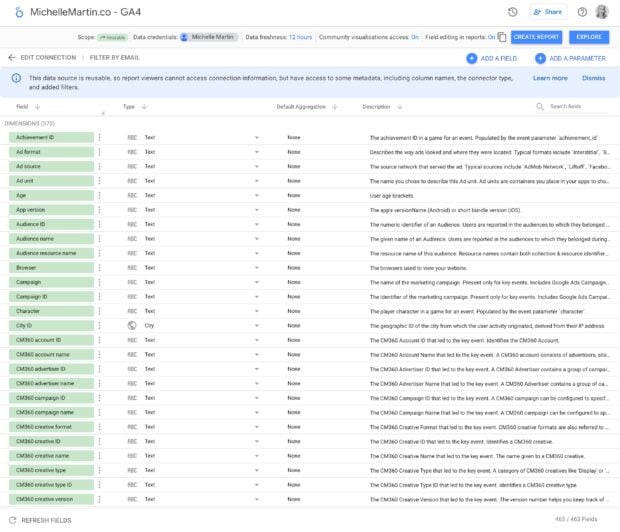
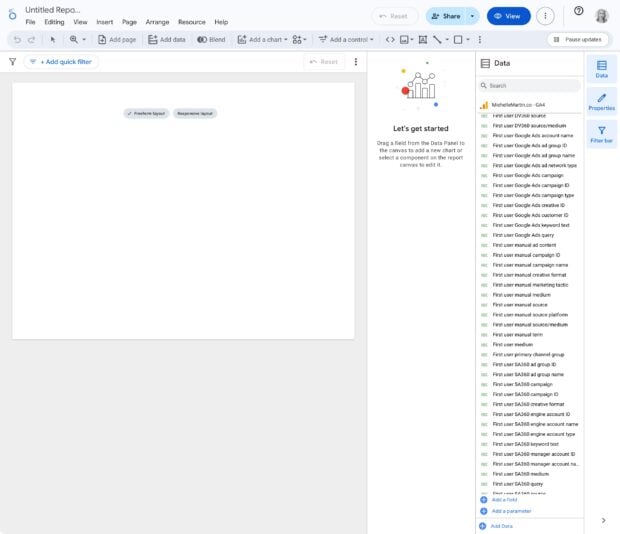
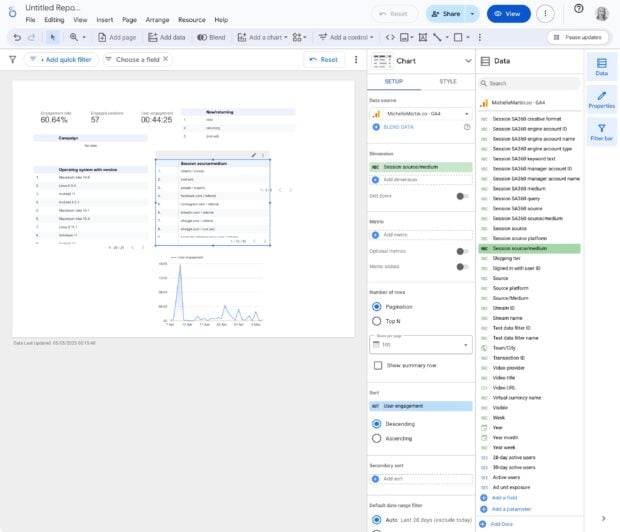
- Create Your Dashboard Report: After connecting data, a blank canvas is provided to begin constructing the visual report.
- Add Metrics and Finalize: Individually add desired metrics from the available data fields. Users then position these elements, add headings, and adjust the layout to create a customized dashboard.
While Google Looker Studio offers flexibility and cost savings, it requires a significant time investment in setup and ongoing maintenance. The lack of automatic updates for evolving platform APIs, which dedicated social media management platforms typically handle, can also be a challenge.
Selecting the Right Dashboard Solution: Key Evaluation Features
Choosing a social media dashboard tool requires careful consideration of several factors, including team size, the number of platforms managed, and the desired level of automation. Key features to evaluate include:
- Multi-Platform Integration: The ability to seamlessly connect and pull data from all relevant social media platforms (Facebook, Instagram, X, LinkedIn, TikTok, Pinterest, YouTube, etc.) is fundamental.
- Customizable Reporting: The flexibility to create bespoke reports and visualizations tailored to specific goals and stakeholder needs is essential. This includes filtering by date range, campaign, geographic region, or content type.
- Real-time Data Updates: Access to current data allows for immediate insights and agile strategy adjustments.
- Historical Data Analysis: The capacity to track performance over extended periods and compare against previous benchmarks is crucial for understanding long-term trends and ROI.
- User-Friendly Interface: An intuitive design ensures that the dashboard is accessible and actionable for all team members, regardless of their technical proficiency.
- AI-Powered Insights and Automation: Advanced features like anomaly detection, predictive analytics, and automated reporting can significantly enhance efficiency and strategic foresight.
- Scalability and Security: For enterprise operations, the solution must be capable of handling large volumes of data and multiple user accounts, while also adhering to robust data security and privacy standards.
Broader Implications and Future Outlook
The widespread adoption of sophisticated social media dashboards signifies a broader shift towards data-centric decision-making in marketing. This trend has several profound implications:
- Enhanced Accountability: Dashboards provide quantifiable metrics that directly link social media activities to business outcomes, fostering a culture of accountability within marketing departments.
- Strategic Agility: The ability to monitor performance in real-time allows businesses to quickly adapt to market shifts, competitor actions, and evolving audience preferences, maintaining a competitive edge.
- Optimized Resource Allocation: By clearly demonstrating ROI, dashboards enable more informed allocation of marketing budgets, ensuring that resources are directed towards the most effective channels and campaigns.
- Improved Customer Understanding: Social listening and engagement dashboards offer deep insights into customer sentiment, pain points, and preferences, informing not just marketing but also product development and customer service strategies.
- Integration with Broader Business Intelligence: The future of social media dashboards lies in even deeper integration with broader business intelligence (BI) platforms, creating a unified view of customer data across all touchpoints, from social media to sales and support. This holistic approach will further unlock predictive analytics and personalized customer experiences.
In conclusion, social media dashboards have transitioned from helpful tools to indispensable strategic assets for businesses navigating the complexities of the digital age. By centralizing data, streamlining reporting, and empowering real-time decision-making, they provide the clarity and insight necessary to optimize social media efforts, prove their value, and drive tangible business growth. As social media continues to evolve, these dashboards will remain at the forefront of data-driven marketing, continually adapting to provide the comprehensive views needed for sustained success.