 Ammar Sabilarrohman

The conversion rate optimization (CRO) industry currently finds itself at a crossroads between statistical purity and the pragmatic demands of corporate finance. For years, practitioners have debated whether it is possible—or even responsible—to forecast future revenue based on the results of isolated A/B tests. While a 10% lift in a controlled experiment suggests a significant improvement in user behavior, translating that percentage into a reliable monthly revenue figure remains one of the most complex challenges in digital marketing. The core of the controversy lies in the inherent volatility of the digital ecosystem; a successful test result does not exist in a vacuum, and the leap from a "winning" variant to a permanent website change involves a multitude of external variables that can dilute or even erase projected gains.

The Problem of Revenue Disconnect
The primary reason revenue forecasting remains a contentious topic is the lack of a one-to-one correlation between experimental lift and long-term financial performance. Even when an experiment yields a statistically valid result, several factors interfere with the realization of those gains once the change is implemented permanently. Industry analysts point to the "novelty effect," where users react positively to a change simply because it is new, only for their behavior to normalize over time. Furthermore, the volume of users exposed to an experiment often represents only a fraction of the total site traffic, meaning a 10% lift on a specific landing page may only result in a 0.5% increase in total site revenue.
External factors frequently complicate these projections. A decrease in advertising budget, a competitor’s aggressive keyword bidding strategy, shifting economic conditions, or even seasonal holidays can skew post-implementation data. This is precisely why randomized controlled A/B testing is preferred over simple pre-and-post-comparison models. In a pre/post model, a 10% increase in performance might be masked by a 10% market-wide downturn, leading a business to believe a change was "flat" when it actually prevented a significant loss.

Establishing Causality Through Robust Statistics
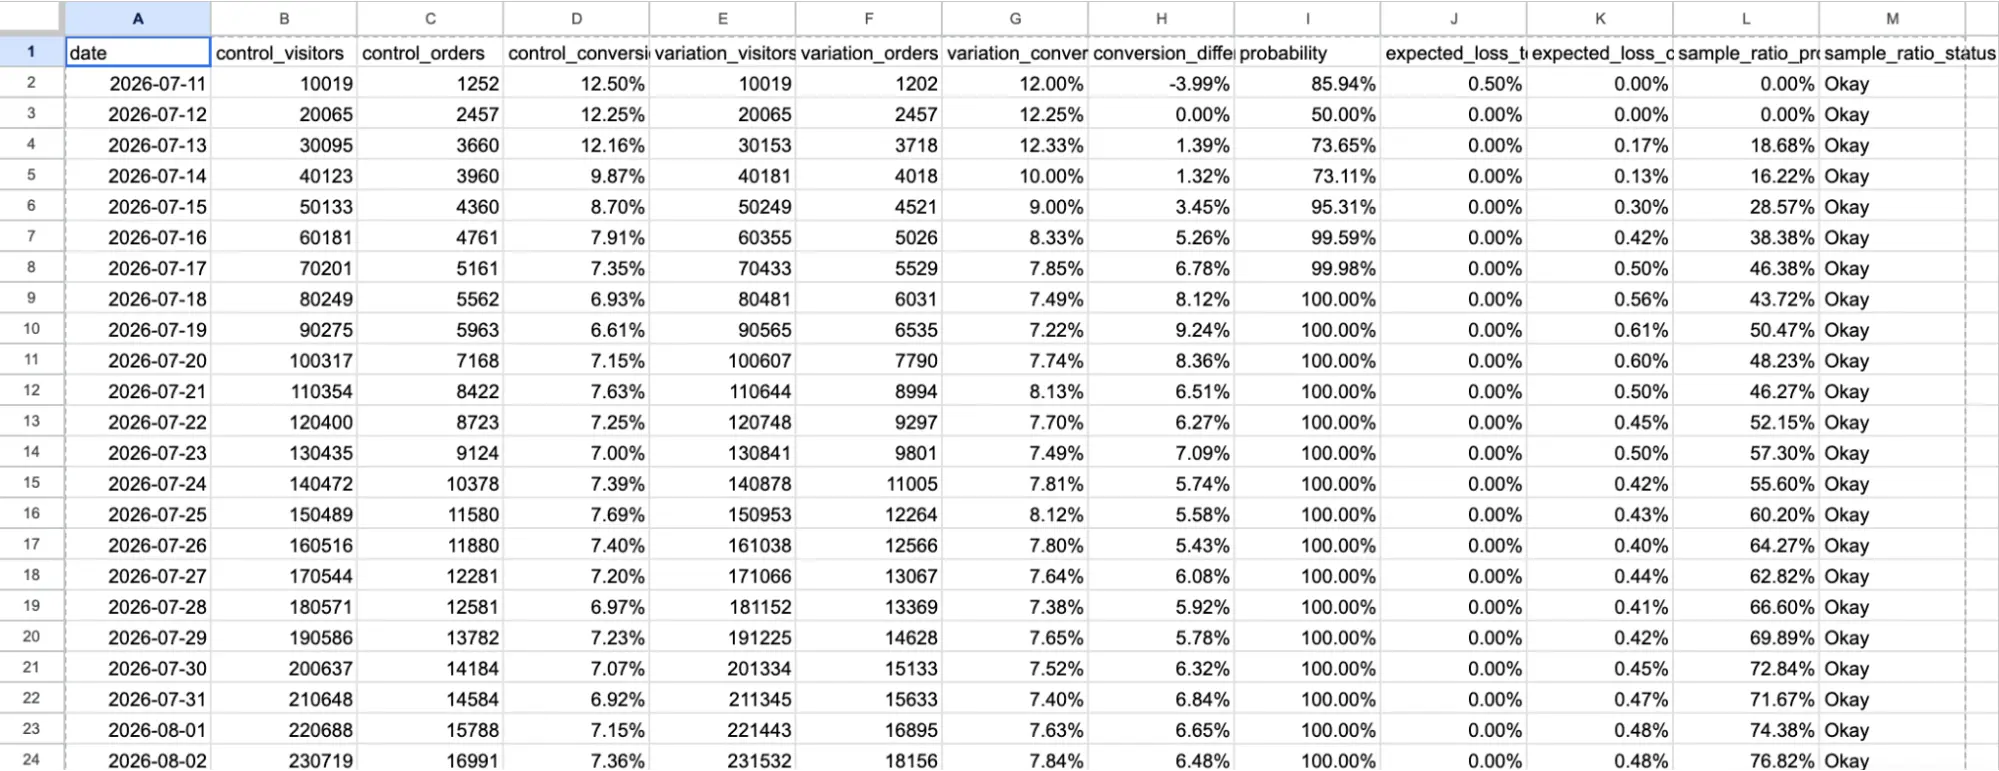
To build a revenue forecast that satisfies executive scrutiny, practitioners must first ensure the underlying data is beyond reproach. The gold standard for proving causality in any scientific field, including medicine and behavioral economics, is the randomized controlled trial. In the context of CRO, this means adhering to strict statistical parameters. For an experiment to serve as a reliable foundation for a forecast, it must be adequately powered—meaning the sample size is large enough to detect the effect—and it must reach a high level of statistical significance, typically 95% or higher.
However, statistics alone are not enough. Organizations must also define their individual parameters for what constitutes a "win." This includes accounting for the "Minimum Detectable Effect" (MDE) before the test begins. If a business requires a 2% lift to break even on the development costs of a new feature, a test that shows a 1% lift, even if statistically significant, should not be factored into a positive revenue forecast. By maintaining these rigorous standards, CRO teams can provide executives with the confidence that their projections are based on proven behavioral shifts rather than statistical noise.
The Necessity of Conservative Forecasting
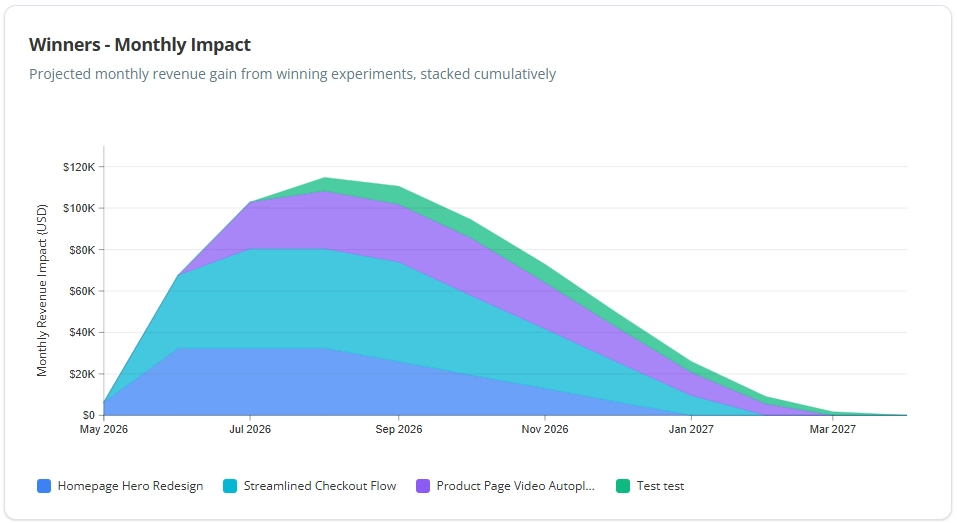
One of the most common pitfalls in the CRO world is the "case study trap," where a 10% lift in a two-week test is multiplied by an organization’s annual revenue to claim a multi-million dollar impact. This approach is widely considered unrealistic for three primary reasons. First, it assumes that the test conditions will remain identical for an entire year. Second, it ignores the fact that different traffic sources (organic, paid, social) may respond differently to the same change. Third, it fails to account for the natural "decay" of an optimization’s effectiveness over time.
To counter this, industry leaders advocate for a conservative "haircut" approach to forecasting. This involves several layers of defensive modeling:
- The Initial Haircut: Reducing the projected lift by a standard percentage (e.g., 10%) to account for the discrepancy between a testing environment and a live production environment.
- Implementation Delay: Accounting for the time gap between the end of a test and the actual deployment of the winning variant.
- The Steady Period: Projecting the full impact for only a limited window, such as three to four months.
- The Decay Rate: Gradually reducing the projected impact by a set percentage (e.g., 20% month-over-month) after the initial steady period to account for market saturation and changing user preferences.
A Practical Model for Revenue Calculation
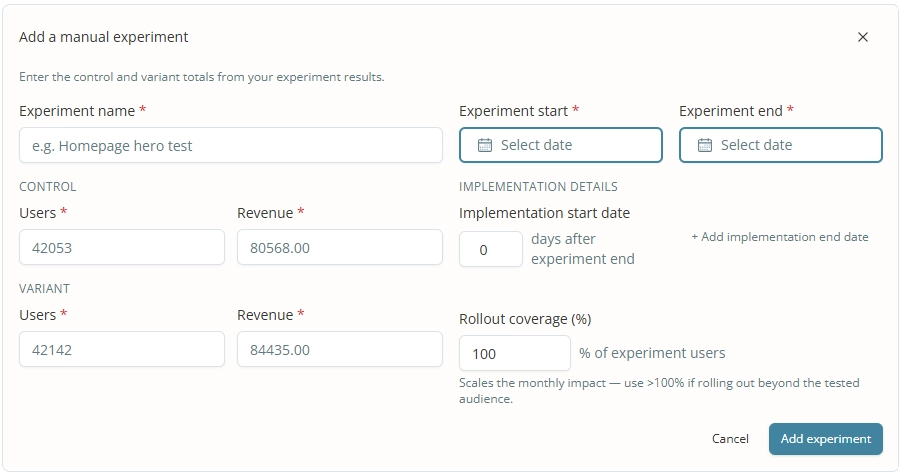
When building a revenue projection, the calculation must be granular and time-sensitive. A standard journalistic or financial model for this process follows a specific chronology. First, the Revenue Per User (RPU) for both the control and the variant must be established. The "lift" is the difference between these two figures. This lift is then multiplied by the number of users expected to be exposed to the change in a given month.
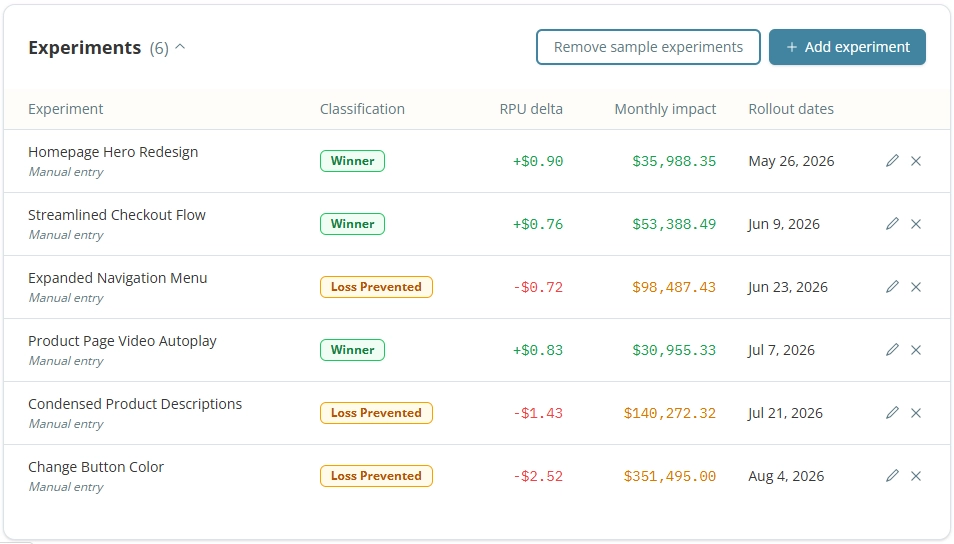
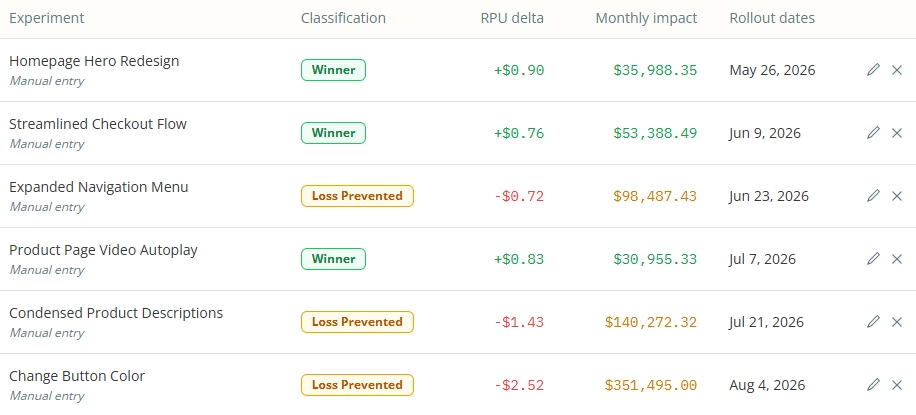
The complexity arises when multiple tests are "stacked." If a team runs five successful tests over six months, the cumulative impact is not merely the sum of the parts. Each subsequent change is built upon a new baseline established by previous winners. Sophisticated analytics tools, such as the Katsed experimentation platform, automate this process by allowing users to enter experiment start and end dates, revenue data, and rollout coverage. This creates a "stacked" chart that shows how the impact of individual tests compounds over time while simultaneously accounting for the natural decline of older experiments.
The Role of "Loss Prevention" in Projections
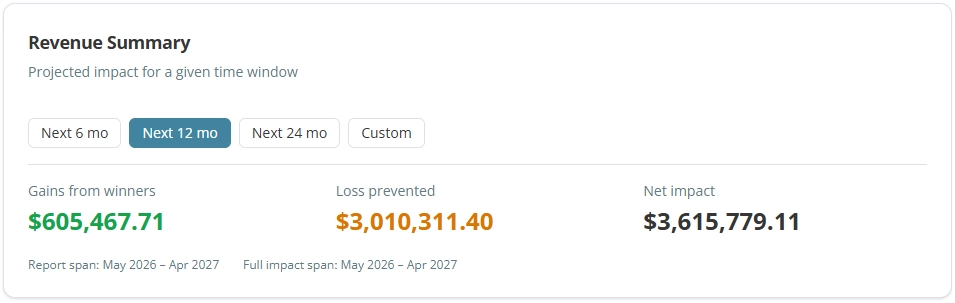
A frequently overlooked aspect of revenue forecasting is the value of "loss prevented." In many cases, a proposed site change or a new feature might have actually decreased revenue had it been implemented without testing. By running an experiment that shows a negative result, the CRO team has effectively saved the company from a financial downturn. While it is more difficult to explain "money not lost" to a CFO than "money gained," including these figures in a comprehensive report provides a more accurate picture of the testing program’s total value. It demonstrates that the CRO department acts not just as a growth engine, but also as a risk mitigation department.
Stakeholder Communication and the Executive Perspective
For many practitioners, the hesitation to forecast revenue stems from a fear of being "wrong." However, in the executive suite, estimates and projections are the standard language of business. Chief Financial Officers and CEOs are accustomed to working with models that include assumptions and margins of error. They are often less interested in p-values and confidence intervals than they are in the "bottom line" potential of a program.

The key to successful reporting at this level is transparency. By making the assumptions of the model explicit—such as the 10% haircut or the 20% monthly decay—the CRO team shifts the conversation from "Is this number 100% accurate?" to "Is this model a reasonable representation of our impact?" This approach transforms CRO from a technical silo into a core business function that speaks the language of Return on Investment (ROI).
Integrating Revenue Gains with Program Costs
A complete revenue forecast must eventually be weighed against the cost of the experimentation program to determine its true ROI. This side of the equation includes:
- Human Capital: The salaries of the CRO specialists, data analysts, and designers.
- Engineering Resources: The cost of developer time used both to build the tests and to implement the winners permanently.
- Technology Stack: The licensing fees for A/B testing platforms, heatmapping tools, and analytics software.
By comparing the cumulative projected revenue gain against these total costs, organizations can determine the "payback period" of their testing program. If a program costs $500,000 a year but is projected (conservatively) to generate $2 million in incremental revenue, the case for further investment becomes undeniable.
Conclusion: The Future of CRO as a Financial Discipline
Forecasting the effect of experiments on future revenue is not an exact science, nor should it be treated as one. It is a strategic modeling exercise designed to provide a directional understanding of value. As the digital marketplace becomes increasingly competitive and ad costs continue to rise, the ability to turn experimental data into financial projections will become a mandatory skill for optimization professionals.
By moving away from "vanity lifts" and toward robust, conservative, and stacked revenue models, the CRO industry can bridge the gap between the lab-like environment of A/B testing and the reality of the corporate balance sheet. The goal is not to possess a crystal ball, but to build a reliable framework that translates human behavior into business value, ensuring that every experiment contributes to a sustainable and measurable bottom line.


 Raul Delapena Setiawan