The global mobile application market, currently valued at over $200 billion and projected to grow exponentially through 2030, has reached a point of saturation where mere functionality is no longer a competitive advantage. In this hyper-competitive landscape, mobile app professionals have historically relied on quantitative analytics—the hard numbers of downloads, daily active users (DAU), and churn rates—to steer their product roadmaps. However, an industry-wide shift is occurring as developers and product managers realize that quantitative data alone provides an incomplete narrative. While traditional analytics can pinpoint where a user drops off, they fail to explain the "why" behind the behavior. To bridge this intelligence gap, a new standard workflow is emerging: the integration of qualitative analytics, specifically touch heatmaps and user session recordings, into the core development lifecycle.
The Quantitative Blind Spot in Modern App Management
For over a decade, the standard for app optimization was built on a foundation of metrics such as session length, retention rates, and conversion funnels. These tools act as a vital alarm system for any mobile business. If a shopping cart abandonment rate spikes from 20% to 50%, quantitative tools will flag the anomaly immediately. Yet, this is where the utility of traditional analytics often hits a plateau.
A product manager seeing a spike in abandonment is left with a series of hypotheses: Is the "Checkout" button broken? Is the shipping cost too high? Is the UI confusing on smaller screens? Without qualitative data, the process of answering these questions involves expensive A/B testing and "blind stabs" at solutions that may or may not address the root cause. This reliance on trial and error not only drains development resources but also risks alienating the existing user base during the experimentation phase.
The fundamental flaw in the traditional workflow is the absence of the human element. Data points are abstractions of human frustration, confusion, or satisfaction. Qualitative analytics seeks to re-humanize this data by providing visual evidence of the user experience, transforming abstract percentages into actionable visual insights.
The Mechanics of Qualitative Intelligence: Heatmaps and Recordings
To understand the revolution in workflow, one must first understand the primary instruments of qualitative analysis: touch heatmaps and user session recordings.
Touch Heatmaps and the "Unresponsive Gesture" Phenomenon
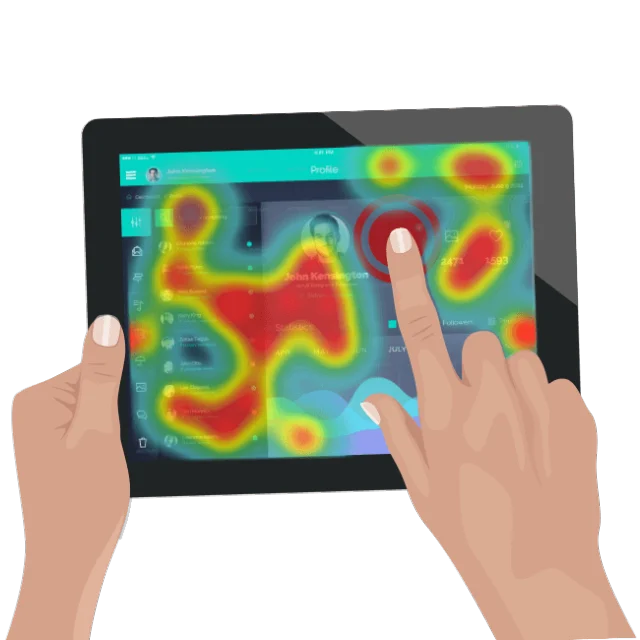
Touch heatmaps aggregate every interaction—taps, swipes, and pinches—across a specific screen to create a visual representation of user activity. Unlike traditional click-tracking, which only records successful interactions with buttons, touch heatmaps capture the "white space" of an app.
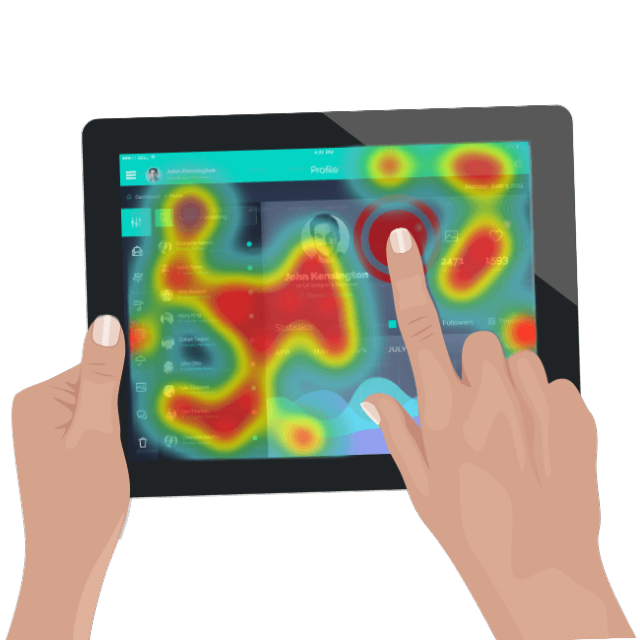
A critical metric derived from these heatmaps is the "unresponsive gesture." This occurs when a user interacts with an element they believe to be functional, but the app provides no feedback. This is often a symptom of poor UI design—such as an image that looks like a button—or a technical bug where a link is broken. In the context of user psychology, unresponsive gestures are primary drivers of "app rage," leading to immediate uninstalls. By identifying these clusters of frustration, developers can make surgical strikes on UI flaws that quantitative data would never reveal.
User Session Recordings: The Unfiltered Truth
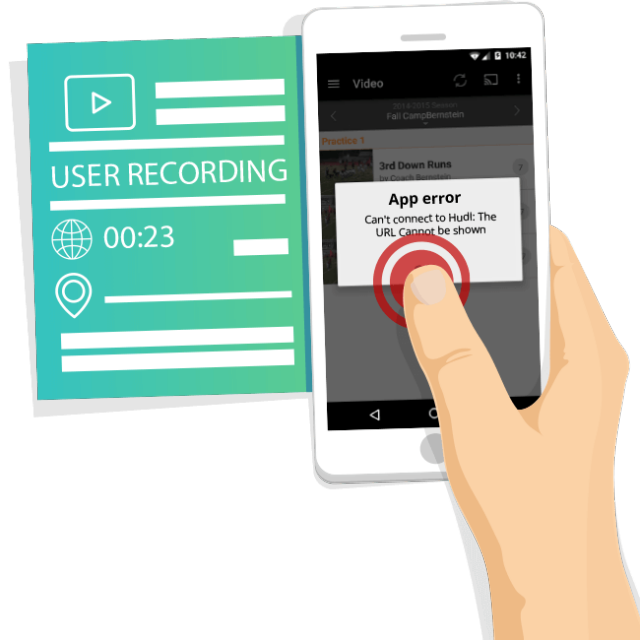
User session recordings provide a real-time, video-like playback of a user’s journey through the app. This tool allows professionals to observe the sequence of events leading up to a crash or a churn event. Crucially, these recordings are captured "in the wild," meaning they represent the actual behavior of users in their natural environments, rather than the staged behavior seen in usability labs.
The power of session recordings lies in their ability to highlight "friction points." For example, a recording might show a user repeatedly trying to enter a promo code, only for the keyboard to obscure the "Apply" button. Such a nuance would be invisible in a spreadsheet but is glaringly obvious when watched as a recording.
Chronology of Analytics Evolution: From Hits to Humans
The shift toward qualitative data is the fourth major era in the timeline of mobile measurement:
- The Era of Popularity (2008–2012): Early app success was measured almost exclusively by download counts. Analytics were rudimentary, focusing on "hits" and store rankings.
- The Era of Engagement (2013–2016): As the market matured, the focus shifted to retention. Tools like Flurry and Google Analytics for Mobile popularized DAU/MAU (Monthly Active Users) ratios and session lengths.
- The Era of Events (2017–2020): Developers began tracking specific "events" within the app, such as "Level 5 Completed" or "Added to Cart." This allowed for the creation of basic conversion funnels.
- The Era of Experience (2021–Present): The current era prioritizes the "User Experience" (UX) above all. Qualitative tools like Appsee (now part of LogRocket), Hotjar, and Mixpanel have integrated behavioral visualization to provide a 360-degree view of the user.
Data-Fueled Optimization: A New Operational Standard
The most significant impact of qualitative analytics is found in the "Data-Fueled Optimization" workflow. This methodology uses quantitative data to identify where a problem exists and qualitative data to identify what the problem is.
Consider the following industry-standard scenario: An e-commerce app notices a 40% drop-off rate on its registration page.
- Quantitative Step: The analytics dashboard shows that users spend an average of 45 seconds on the registration screen before closing the app.
- Qualitative Step: The product team watches ten session recordings of users on that specific screen. They notice that when users tap the "Date of Birth" field, the date picker is difficult to scroll, leading to multiple errors.
- Resolution: The developers replace the scroll-style date picker with a manual text input field.
- Result: The drop-off rate falls to 10%, and the conversion rate increases.
This "Lather, Rinse, Repeat" cycle of Alert, Investigate, and Resolve is becoming the gold standard for agile development teams. It reduces the time spent in meetings debating "gut feelings" and replaces it with evidence-based decision-making.
Proactive Troubleshooting and Technical Integrity
Beyond optimization, qualitative analytics is fundamentally changing the way QA (Quality Assurance) and technical troubleshooting are handled. Traditionally, troubleshooting was reactive: a user submits a bug report, and the developer tries to recreate the crash on their own device.
With qualitative analytics, troubleshooting becomes proactive. By monitoring session recordings, developers can spot "near-misses"—scenarios where an app almost crashed or where a user experienced a logic error that didn’t trigger a formal crash report. Furthermore, when a crash does occur, the session recording provides a "black box" recording of exactly what the user did in the seconds leading up to the failure. This eliminates the "it works on my machine" defense, as the developer can see the specific device, OS version, and sequence of gestures that triggered the fault.
Industry Implications and the ROI of Empathy
The broader implications of this shift are financial as well as technical. The cost of user acquisition (CAC) has skyrocketed in recent years. According to industry reports, the average cost to acquire a mobile app user who makes a purchase can exceed $80 in certain sectors. With such high stakes, losing a user due to a fixable UI friction point is a significant financial loss.
By utilizing qualitative analytics to improve retention, companies are seeing a direct impact on the Lifetime Value (LTV) of their customers. Research by Bain & Company suggests that increasing customer retention rates by just 5% can increase profits by 25% to 95%. Qualitative data is the primary lever for this retention.
Furthermore, the rise of "Human-Centric" data is forcing a cultural shift within tech organizations. Designers, developers, and marketers are no longer siloed; they are united by a shared visual understanding of how their customers interact with their product. This fosters a culture of empathy, where the goal is not just to "hit the numbers" but to solve genuine user problems.
Future Outlook: AI-Enhanced Qualitative Analysis
As we look toward the future, the next frontier for qualitative analytics is the integration of Artificial Intelligence. Currently, the main drawback of qualitative data is the time required to watch hundreds of session recordings. However, new AI-driven platforms are beginning to automate this process. Machine learning algorithms can now "watch" thousands of recordings and automatically flag sessions that contain "rage clicks," "looping behavior," or "abnormal navigation paths."
This evolution will allow even small development teams to gain the insights of a massive usability study at a fraction of the cost. The integration of qualitative and quantitative data is no longer a luxury for top-tier tech giants; it is a fundamental requirement for any mobile application that intends to survive in the modern digital economy. By understanding the "why" behind the "what," app professionals can finally move past the flaws of traditional analytics and deliver the ultimate user experience.