In the dynamic landscape of digital marketing, understanding how an audience interacts with content is paramount. Engagement rate, a critical social media metric, quantifies the degree to which an audience actively interacts with shared content. It serves as a vital indicator, defining the level of interaction a specific piece of content, an entire campaign, or even a brand’s social media presence receives relative to its reach or overall audience size. This metric has evolved significantly, moving beyond superficial follower counts to provide deeper insights into content efficacy and audience connection.

The Evolving Significance of Social Media Engagement
The importance of engagement rate has steadily grown, particularly as social media platforms have refined their algorithms to prioritize meaningful interactions. Initially, metrics like follower count and impressions dominated the focus, often referred to as “vanity metrics” due to their limited insight into actual audience connection. However, as algorithms became more sophisticated, favoring content that genuinely resonated with users, engagement rate emerged as the true barometer of content success. When users actively choose to like, comment, share, or save a post, it signals a strong connection to the content, indicating that it is perceived as either interesting, useful, or thought-provoking. This active participation is a powerful signal to social algorithms, which, in turn, often boost the visibility of highly engaging content to broader audiences, including those outside a brand’s immediate follower base.

Beyond algorithmic visibility, high engagement rates bolster a brand’s credibility and appeal. For first-time profile visitors, an active comment section or a flurry of shares can transform a mere presence into a vibrant community, fostering trust and encouraging further exploration. For large-scale enterprise teams and marketing departments, engagement rate offers one of the most tangible and quantifiable ways to demonstrate social media’s return on investment (ROI) to leadership. By directly linking content performance to measurable audience behavior, it provides clear evidence of strategy effectiveness, helping to justify marketing spend and inform future tactical decisions.
Deconstructing Engagement: What Counts on Each Platform?
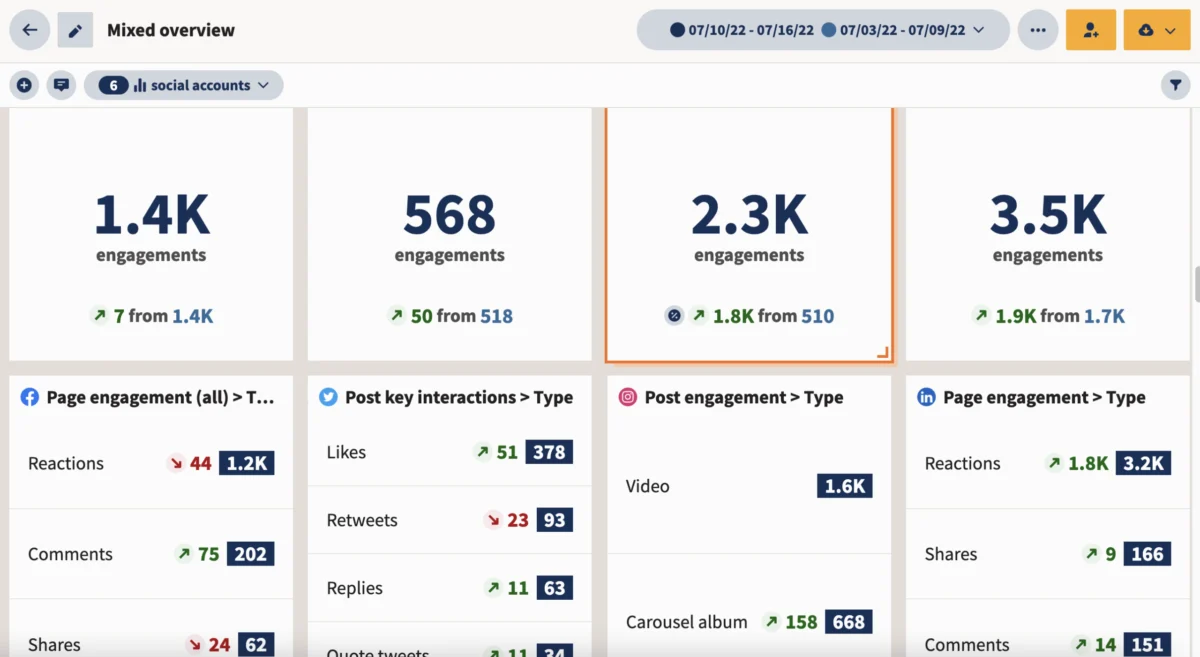
While the core concept of engagement—user interaction—remains universal, the specific actions that platforms categorize as engagement can vary significantly. These distinctions are crucial for accurate calculation and fair cross-channel performance comparisons. Understanding what contributes to the engagement formula on each network allows marketers to tailor their content strategies and interpret data with greater precision.
Generally, engagement actions encompass:

- Likes/Reactions: A quick affirmation of interest or approval.
- Comments: Direct textual responses, fostering conversation.
- Shares: Spreading content to one’s own network, indicating value.
- Saves: Archiving content for future reference, denoting high utility.
- Poll Responses: Active participation in content-driven questions.
- Messages: Direct communication initiated by content.
- Link Clicks: Demonstrating interest in further information or action.
However, each major social network has its nuances:
- Facebook: Includes reactions (Like, Love, Haha, Wow, Sad, Angry), comments, shares, link clicks, video views (often beyond a few seconds), and event responses.
- Instagram: Likes, comments, saves, shares (to stories or direct messages), profile visits, and story interactions (poll responses, emoji sliders, quiz answers). Instagram Reels also count shares, saves, and comments.
- X (formerly Twitter): Likes, replies, retweets, quote tweets, profile clicks, link clicks, and media views.
- LinkedIn: Likes, comments, shares, and clicks on posts (including “see more” clicks for expanded text).
- TikTok: Likes, comments, shares, saves, and follows initiated from a video.
- YouTube: Likes, comments, shares, and subscriptions from a video.
Crucially, passive metrics such as impressions (how many times content was displayed) and views (how many times content was seen, often with a low duration threshold) typically do not count as engagement on their own. These metrics measure exposure, not interaction. Marketers should always consult a platform’s native analytics dashboard to confirm the exact actions included in their reported engagement figures before conducting manual calculations to ensure consistency and accuracy.
Calculating Engagement Rate: Diverse Formulas for Specific Insights
Calculating engagement rate accurately is fundamental to performance analysis. While various tools, including free online calculators and advanced social media analytics platforms like Hootsuite, can automate this process, understanding the underlying formulas is essential for informed decision-making. Different formulas provide distinct perspectives, making the choice of calculation dependent on the specific objective of the analysis (e.g., overall account health, campaign performance, or individual post success).
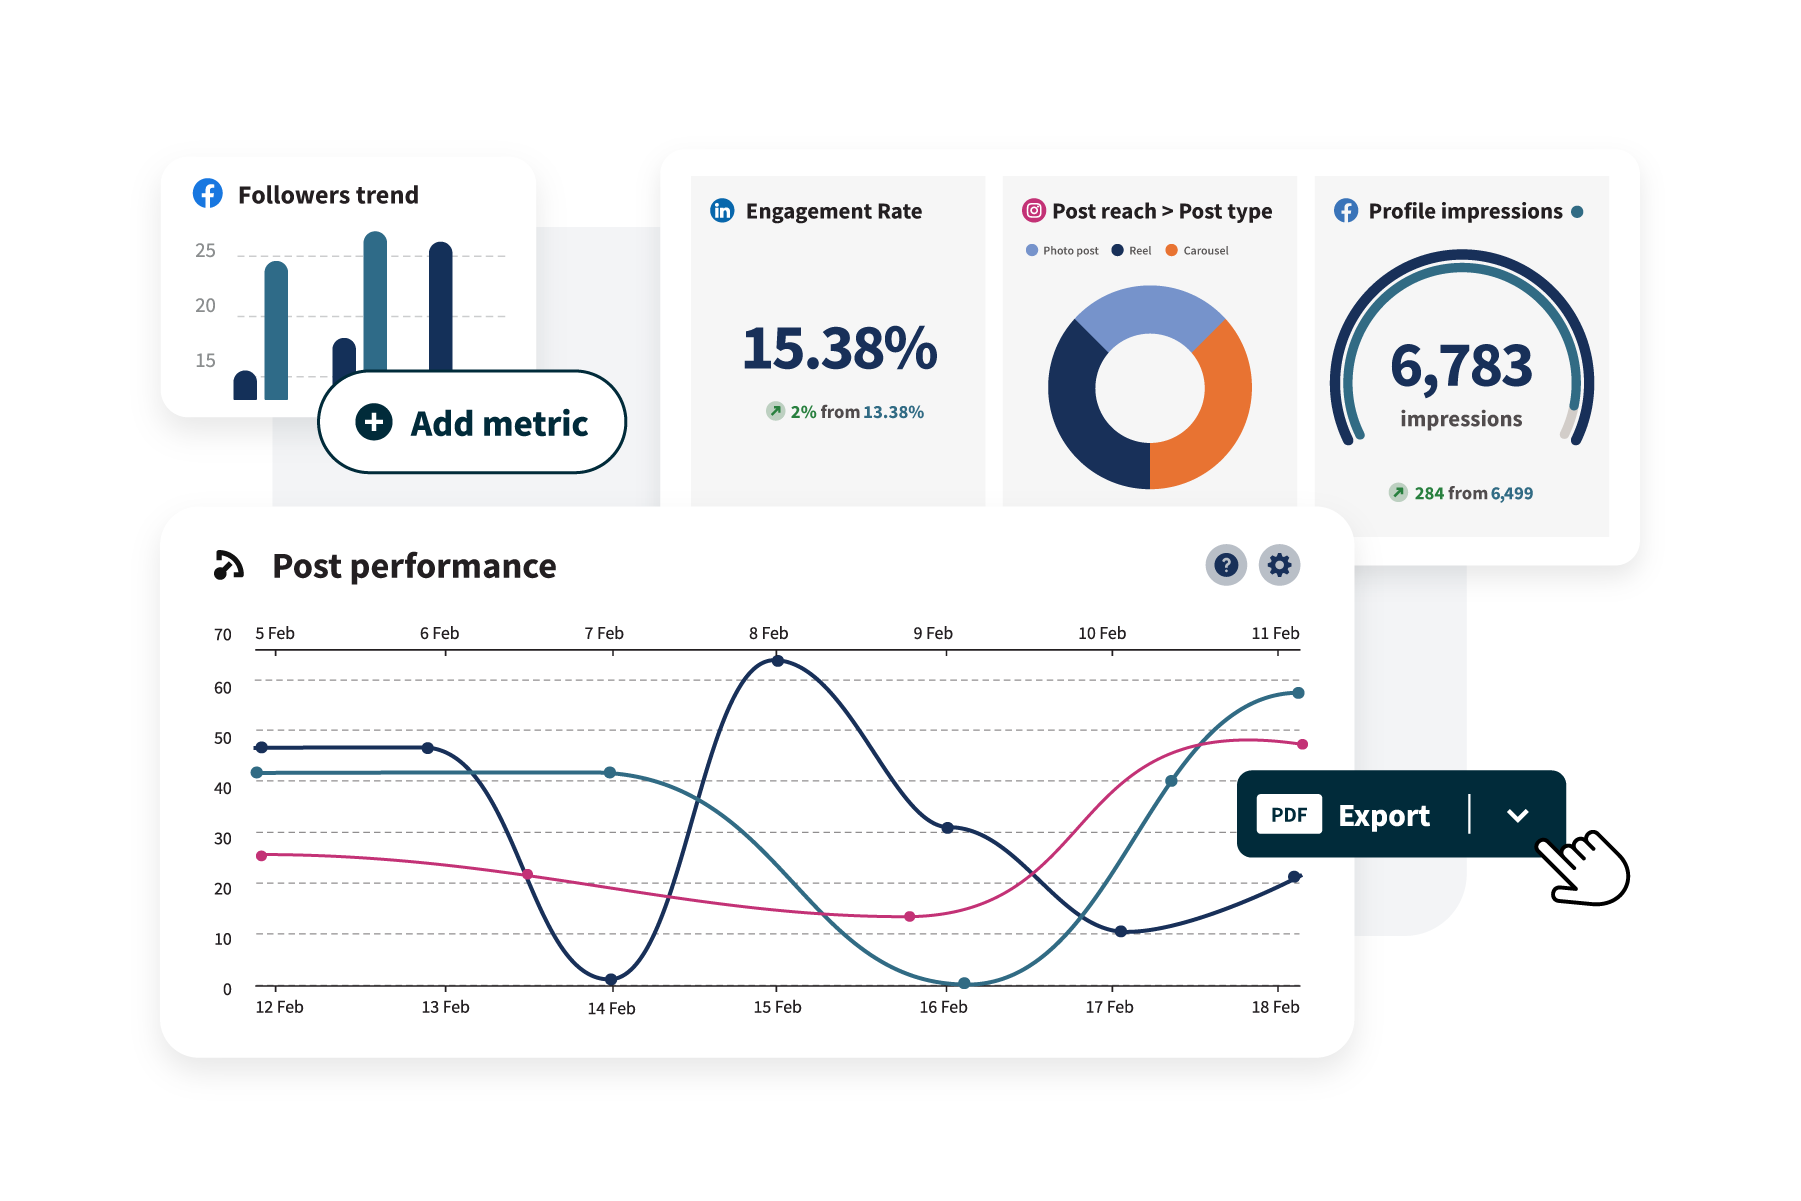
There are six primary formulas commonly used to calculate social media engagement rates:
-
Engagement Rate by Reach (ERR): The Standard for Organic Content
ERR measures the percentage of unique individuals who interacted with content after seeing it. It’s considered one of the most accurate for organic content because it accounts for the actual number of people exposed to the post.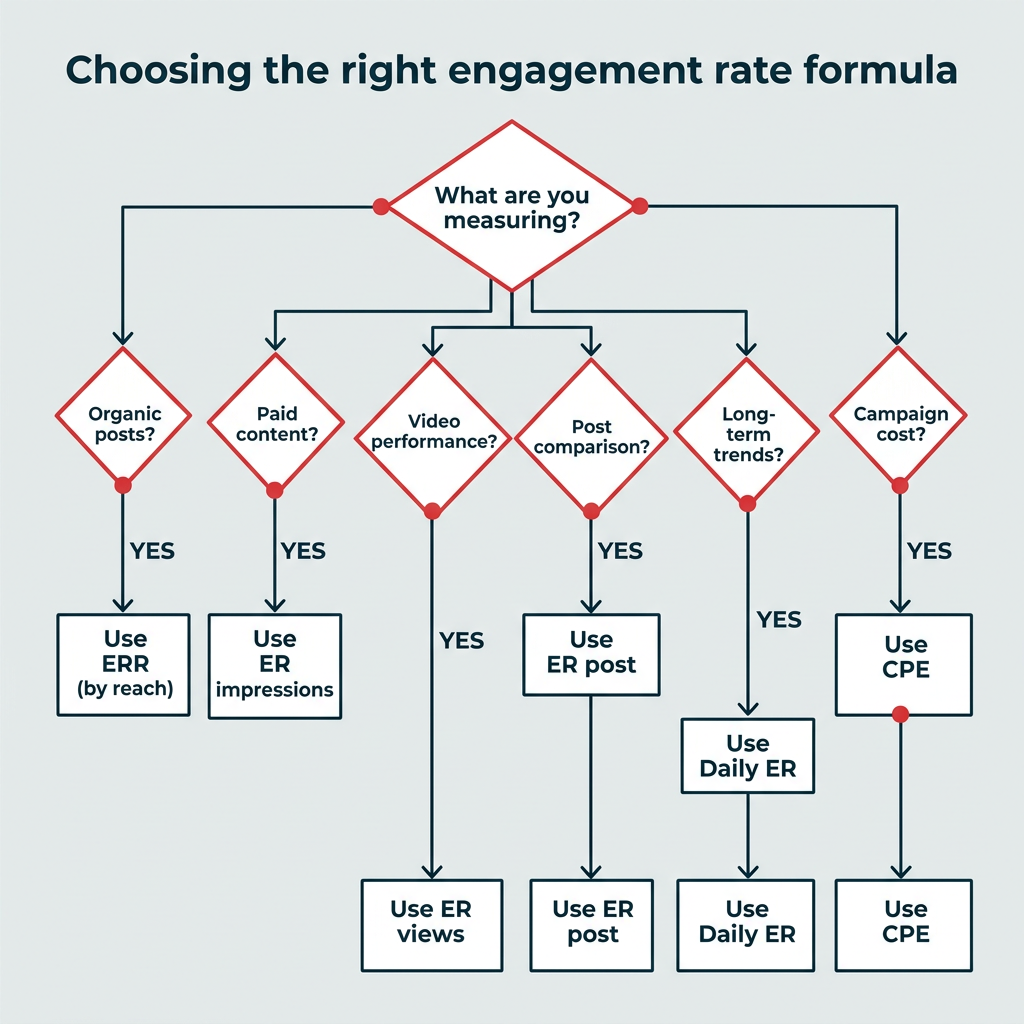
- Formula: ERR = (Total Engagements on a Post / Reach of that Post) * 100
- Average ERR: (Sum of ERR for each post / Total number of posts)
- Example: A post receives 100 engagements and reaches 5,000 unique users. ERR = (100 / 5,000) * 100 = 2%. If a second post has 120 engagements and 6,000 reach (2%), the average ERR for these two posts is (2% + 2%) / 2 = 2%.
- Pros: Reflects real interaction relative to actual exposure. More precise than follower-based metrics in algorithm-driven feeds where not all followers see every post.
- Cons: Reach can be inconsistent. A low reach can artificially inflate engagement, while a high reach might dilute it, requiring careful interpretation.
-
Engagement Rate by Post (ER Post): Ideal for Comparing Individual Posts
ER post evaluates how many people engage with a specific post relative to the total follower count. This method is particularly useful for comparing the performance of individual pieces of content over time or against competitors, and is a common metric for social media influencers.- Formula: ER Post = (Total Engagements on a Post / Total Followers) * 100
- Average ER Post: (Sum of ER Post for each post / Total number of posts)
- Example: A post garners 150 engagements from an account with 10,000 followers. ER Post = (150 / 10,000) * 100 = 1.5%.
- Pros: Provides a stable baseline for post-by-post comparison, as follower count is a relatively consistent variable.
- Cons: Doesn’t account for viral reach beyond the follower base. This rate tends to decrease as follower counts grow, as it becomes harder to engage a larger percentage of a vast audience.
-
Engagement Rate by Impressions (ER Impressions): Best for Paid Content and Ad Performance
ER impressions measures engagements against the total number of times content was displayed, including repeat views by the same user. This formula is especially relevant for paid advertising campaigns where impressions are a key billing metric (e.g., Cost Per Mille/Thousand Impressions – CPM).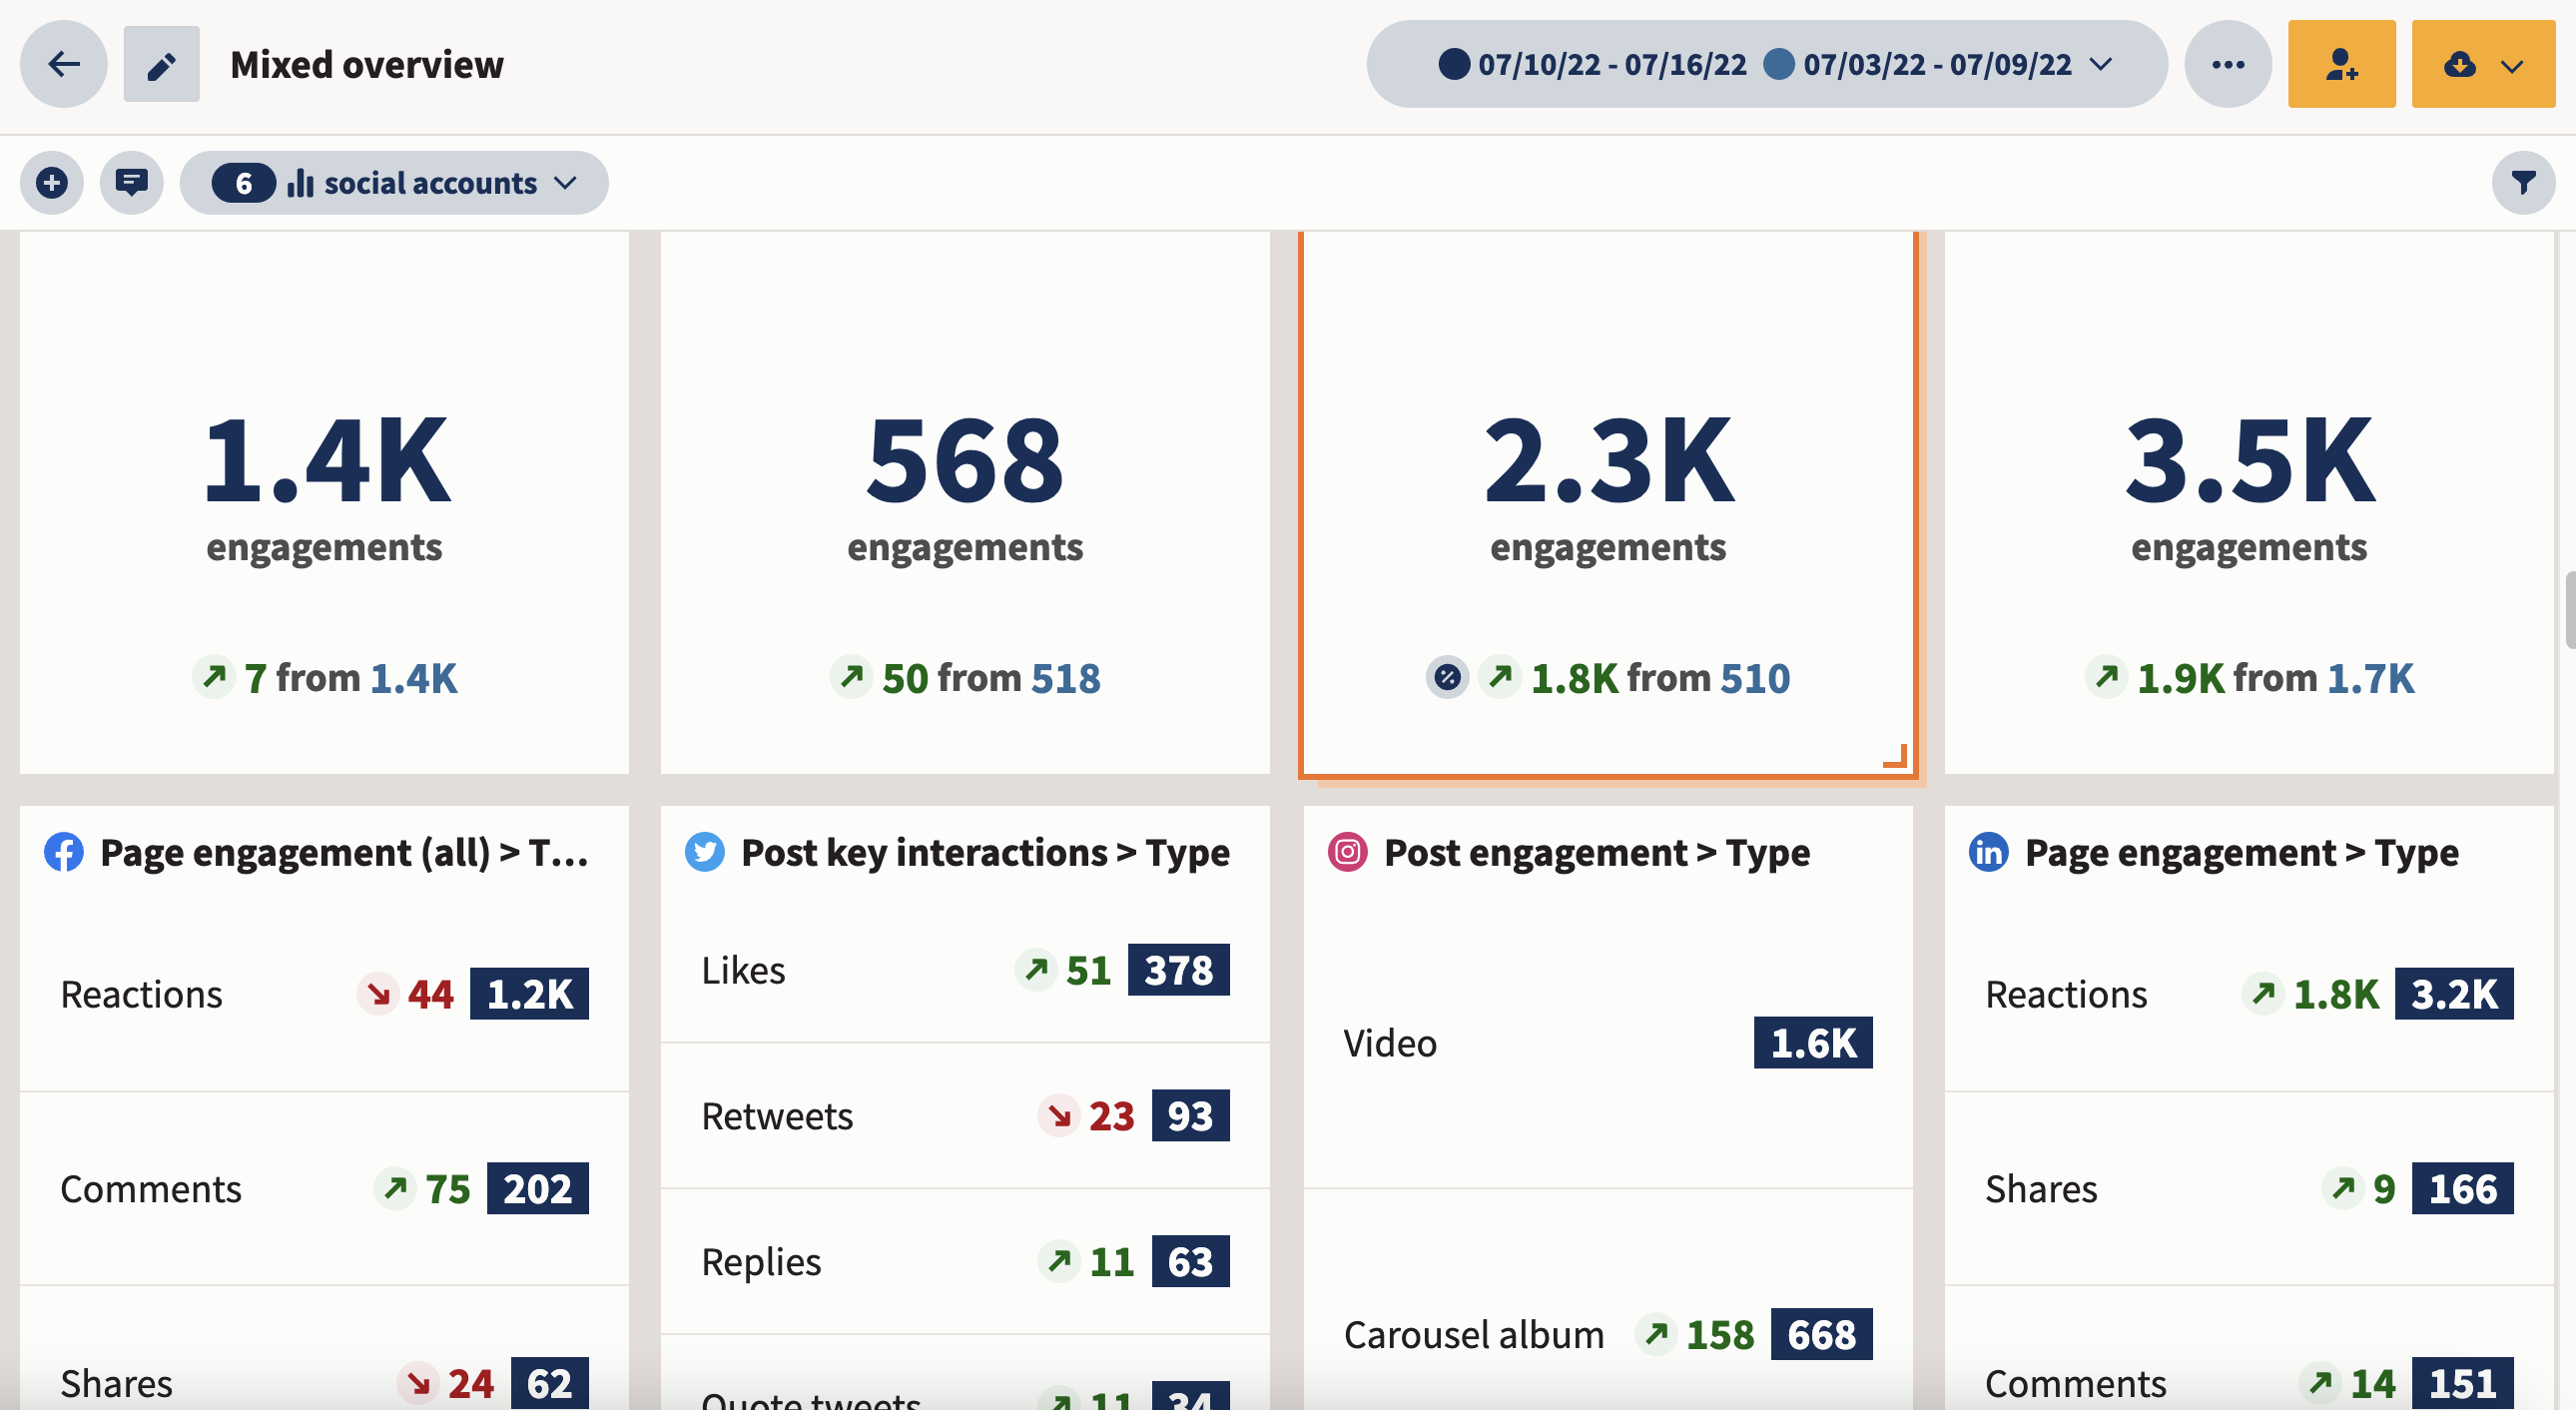
- Formula: ER Impressions = (Total Engagements on a Post / Total Impressions) * 100
- Average ER Impressions: (Sum of ER Impressions for each post / Total number of posts)
- Example: An ad receives 200 engagements and generates 20,000 impressions. ER Impressions = (200 / 20,000) * 100 = 1%.
- Pros: Directly aligns with the cost structure of many paid social campaigns, making it excellent for measuring ad effectiveness.
- Cons: Typically yields lower rates than ERR or ER Post because impressions inherently count multiple views by the same user, who is unlikely to engage multiple times. Impressions can also fluctuate, similar to reach.
-
Daily Engagement Rate (Daily ER): For Long-Term Account Health
Daily ER assesses the average daily interaction with an account relative to its total followers. This metric provides a holistic view of overall account engagement, including interactions with older posts.- Formula: Daily ER = (Total Engagements in a Day / Total Followers) * 100
- Average Daily ER (over X days): (Total Engagements for X days / (X Total Followers)) 100
- Example: An account with 5,000 followers records 100 engagements over a single day. Daily ER = (100 / 5,000) * 100 = 2%.
- Pros: Captures all interactions across all content, regardless of posting date. Useful for understanding ongoing audience activity and brand stickiness. Can be tailored to specific actions (e.g., daily comments only).
- Cons: Cannot differentiate between one highly active follower and many less active ones. Volume can be influenced by posting frequency, necessitating parallel tracking of content output.
-
Engagement Rate by Views (ER Views): Specific to Video Content
ER Views measures engagements against the total number of video views. This is particularly useful for assessing the performance of video content where views are a primary metric.
- Formula: ER Views = (Total Engagements on Video Post / Total Video Views) * 100
- Average ER Views: (Sum of ER Views for each video / Total number of videos)
- Example: A video receives 50 engagements and 2,500 views. ER Views = (50 / 2,500) * 100 = 2%.
- Pros: Directly links engagement to video consumption, ideal for objectives centered on video interaction.
- Cons: View counts often include repeat views from the same user, potentially lowering the perceived engagement rate.
-
Cost Per Engagement (CPE): For Influencer Marketing and Conversion Campaigns
CPE calculates the financial cost incurred for each engagement generated by a campaign. This metric is invaluable for paid campaigns, influencer collaborations, and any marketing effort with a direct budget.- Formula: CPE = Total Amount Spent / Total Engagements
- Example: A campaign costs $500 and generates 1,000 engagements. CPE = $500 / 1,000 = $0.50 per engagement.
- Pros: Directly measures the cost-efficiency of interactions, crucial for budget allocation and ROI analysis in paid media.
- Cons: Requires a consistent definition of “engagement” across all platforms and reporting tools to ensure fair comparison.
Automating Engagement Rate Tracking for Strategic Advantage
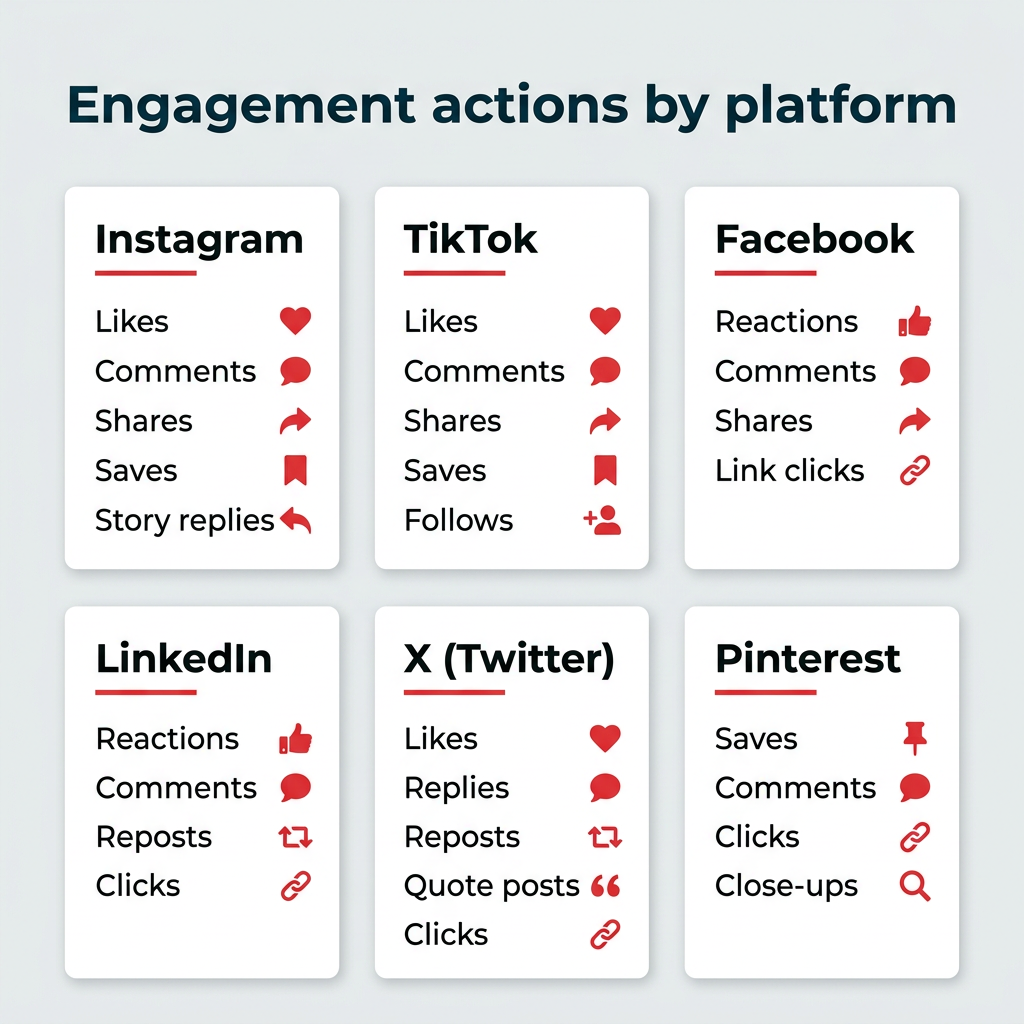
While manual calculations are possible, the complexity of managing multiple platforms and diverse content types makes automated tracking indispensable for modern social media management. Tools like Hootsuite aggregate engagement data from various social networks, applying standard formulas and presenting insights in intuitive dashboards. This automation drastically reduces manual labor, freeing up marketing teams to focus on strategy and content creation.
Hootsuite Analytics, for instance, offers automated engagement rate tracking, allowing users to:
- View overall account engagement rates across platforms.
- Identify content types that drive the highest engagement.
- Track engagement trends over specific time periods.
- Compare current performance against historical data.
- Generate customizable reports for stakeholders.
- Optimize posting schedules by identifying peak audience activity times.
For enterprise teams managing numerous accounts and complex campaigns, multi-platform tracking is a game-changer, providing a unified view of performance and enabling data-driven decision-making at scale.
Benchmarks for 2026: What Constitutes “Good” Engagement?
Defining a “good” engagement rate is not a one-size-fits-all answer. It’s a contextual assessment influenced by several factors, including the specific social media platform, the industry, the size of the audience, and the type of content being published. Generally, an engagement rate between 1% and 5% is considered healthy, but this range is highly adaptable.
A comprehensive analysis conducted by the Hootsuite team in partnership with data science agency Critical Truth, examining over 1 million social posts across diverse industries and networks, provides valuable benchmarks for 2026. This data offers a reliable foundation for strategic planning and performance evaluation.
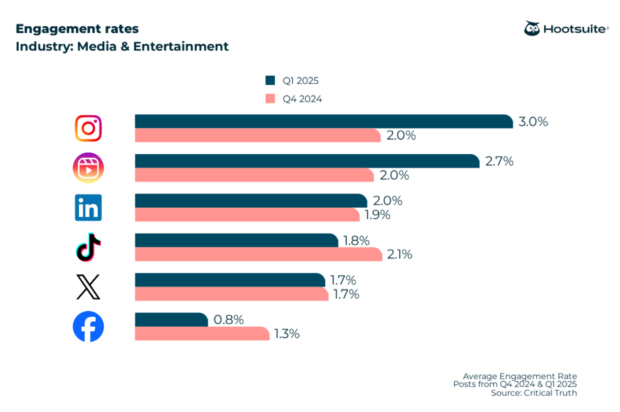
Overall Engagement Rate Benchmarks (All Industries, 2026):
- Instagram: 3%
- Instagram Reels: 2.7%
- LinkedIn: 2%
- X (formerly Twitter): 1.8%
- TikTok: 1.5%
- Facebook: 0.8%
Analysis of Platform-Specific Benchmarks:
- Instagram often leads due to its highly visual nature and user base that is receptive to image and short-video content. The slightly lower rate for Reels might indicate a saturation in the short-form video market or a higher bar for viral content.
- LinkedIn maintains a strong 2% average, reflecting its professional audience’s tendency to engage with informative, industry-specific content, even if interactions are more measured than on consumer-focused platforms.
- X and TikTok show moderate engagement, with X’s real-time, conversational environment and TikTok’s rapid content consumption contributing to their respective averages.
- Facebook consistently shows the lowest average engagement rate. This can be attributed to several factors: its vast and diverse user base, an increasingly competitive news feed, and algorithmic changes that have prioritized content from friends and family over brand pages in recent years. Many brands also use Facebook more for reach and awareness than direct engagement, influencing the overall average.
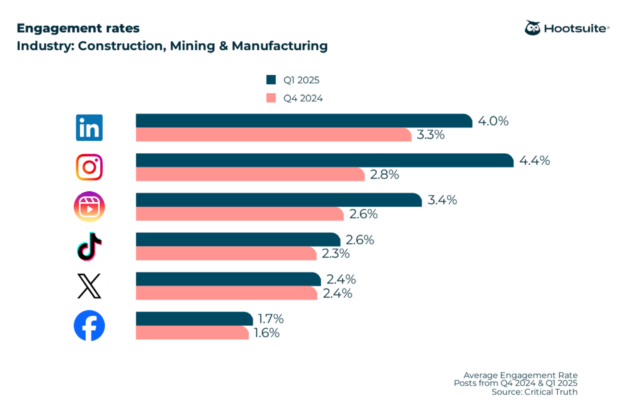
Industry-Specific Benchmarks (2026):
- Construction, Mining, and Manufacturing: Instagram leads at 4.4%, demonstrating the power of visual storytelling even in traditionally industrial sectors. LinkedIn follows with a respectable 2.5%.
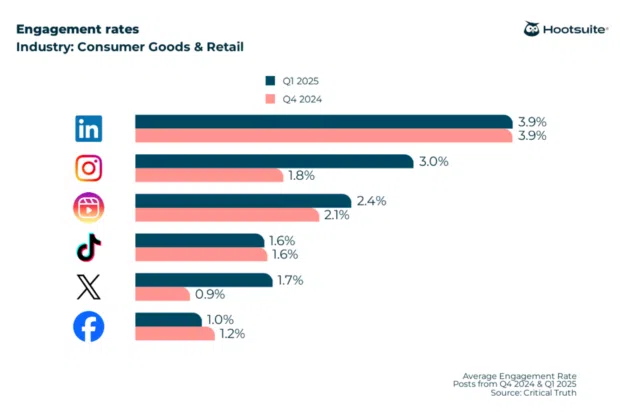
- Consumer Goods and Retail: LinkedIn surprisingly shows the highest at 3.9%, possibly reflecting B2B partnerships and corporate announcements. Instagram is strong at 3.2%, as expected for visual product-centric content.
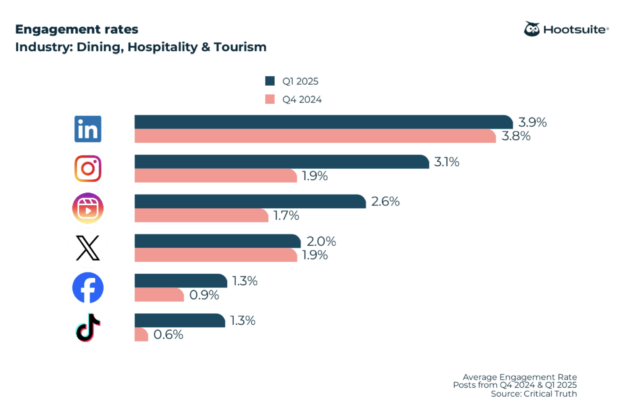
- Dining, Hospitality, and Tourism: Instagram and its Reels are dominant, reaching 3.8% and 3.5% respectively, underscoring the visual appeal of travel and culinary experiences.
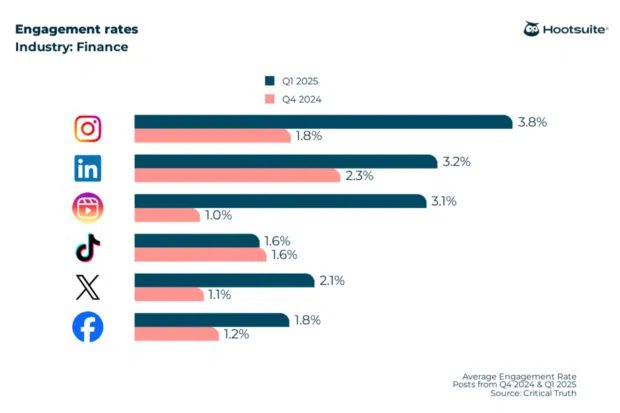
- Finance: Instagram again leads at 3.8%, suggesting that financial institutions are increasingly connecting with audiences through accessible, visual content. LinkedIn is critical at 3.3% for professional networking.
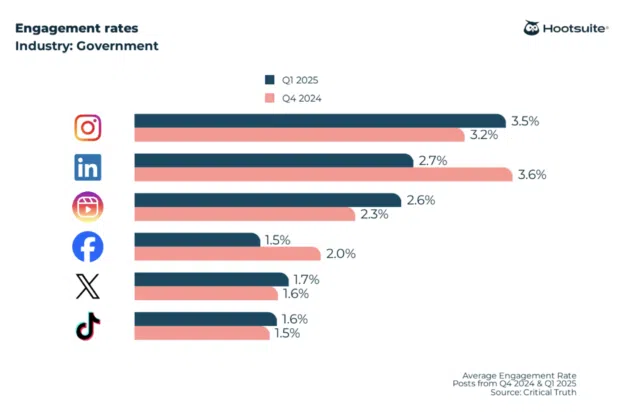
- Government: Instagram at 3.2% and LinkedIn at 2.5% show effective public communication channels.
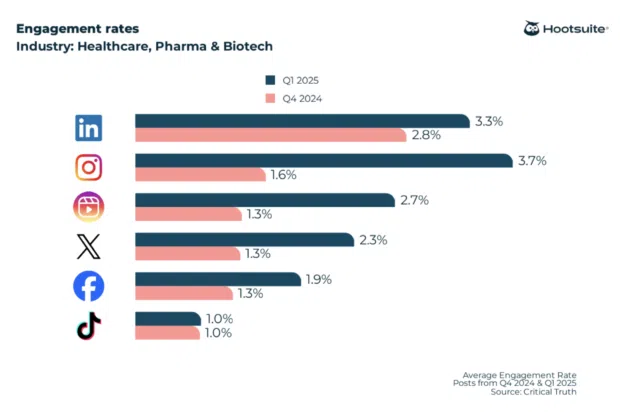
- Healthcare, Pharma, and Biotech: Instagram leads at 3.7%, indicating successful efforts to demystify complex topics visually. LinkedIn is also strong at 2.8% for professional discourse.
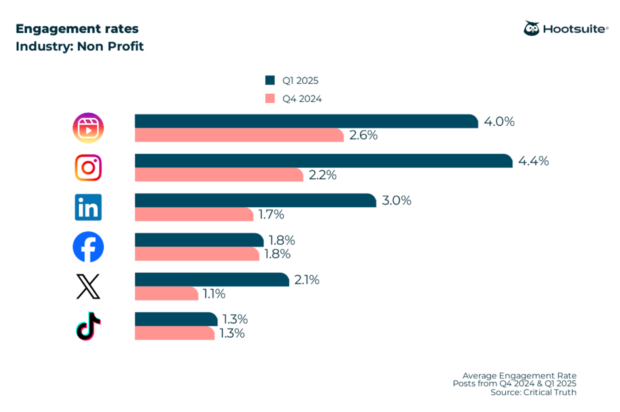
- Nonprofit: Instagram leads significantly at 4.4%, showcasing the platform’s power for emotional storytelling and community building around causes.
These benchmarks serve as crucial reference points, allowing organizations to compare their performance not against a generic ideal, but against relevant industry and platform averages.
Strategies for Elevating Engagement Rates
Improving engagement rates requires a strategic, data-informed approach. The most effective method is to analyze what currently resonates with the audience and then amplify those successful elements. By understanding preferred formats, topics, and optimal posting times, brands can move from guesswork to intentional content creation.
Key tactics to boost engagement include:
- Post When Your Audience is Most Active: Utilize analytics to pinpoint peak activity times for your specific audience on each platform. Scheduling content during these windows maximizes initial exposure and potential interaction.
- Experiment with Engaging Content Formats: Diversify content to include carousels, polls, quizzes, user-generated content (UGC), behind-the-scenes glimpses, and interactive stories. Visual content, especially video (like Reels), consistently drives higher engagement.
- Ask Questions and Prompt Discussion: Encourage comments by posing open-ended questions in captions or using interactive features like polls and Q&As in stories. Directly invite users to share their opinions and experiences.
- Foster a Sense of Community: Respond promptly and thoughtfully to comments and direct messages. Acknowledge and appreciate user contributions. Running contests, challenges, or “ask me anything” (AMA) sessions can also build community.
- Leverage User-Generated Content (UGC): Encourage followers to create content related to your brand and then share or feature it (with permission). UGC builds authenticity and fosters a strong sense of community.
- Collaborate with Influencers or Other Brands: Partnering with relevant influencers or complementary brands can expose your content to new, engaged audiences and lend credibility.
- Optimize for Platform-Specific Best Practices: Understand each platform’s unique features and algorithmic preferences. For example, using relevant hashtags on Instagram, participating in trending topics on X, or creating visually appealing, concise posts on LinkedIn.
These consistent, incremental improvements across content timing, format, and community interaction collectively contribute to a significantly higher engagement rate over time.
Strategic Implications and the Future of Engagement
Engagement rate data is not merely a reporting metric; it is a strategic asset that informs content planning, campaign optimization, and broader business decision-making. Its true value emerges when analyzed for patterns across platforms, formats, and time periods, rather than focusing on isolated post performance.

Here’s how engagement rate data can inform strategic actions:
- Content Strategy Refinement: Identify top-performing content themes, formats, and calls to action. Double down on what works and iterate on less successful approaches.
- Audience Insights: Uncover deeper understanding of audience preferences, pain points, and interests based on their interactions. This can inform product development, customer service, and marketing messaging.
- Competitive Analysis: Benchmark performance against competitors to identify gaps and opportunities. Understand what resonates with their audiences and adapt strategies accordingly.
- Influencer Selection: For influencer marketing, engagement rate is a far more reliable indicator of an influencer’s true impact than follower count alone.
- Paid Media Optimization: Use high-engagement organic content as a testing ground for paid campaigns, or retarget engaged users with specific offers.
- Crisis Management: Monitor engagement patterns during sensitive times to gauge public sentiment and the effectiveness of communication efforts.
As social media continues to evolve, engagement will remain a cornerstone metric. The shift towards authentic connections and meaningful interactions underscores the importance of not just being present online, but actively participating and fostering community. By leveraging sophisticated analytics and applying data-driven strategies, brands can continuously enhance their engagement rates, translating online interactions into tangible business value and a robust social media ROI. The future will likely see even greater emphasis on qualitative engagement, moving beyond mere clicks to measure the depth and sentiment of interactions, making the role of comprehensive analytics tools even more critical.
Save time managing your social media marketing strategy with Hootsuite. Publish and schedule posts, find relevant conversions, measure results, and more – all from one dashboard. Try it free today.