In the hyper-competitive landscape of modern Software-as-a-Service (SaaS), the ability to decode customer sentiment has evolved from a secondary administrative task into a core strategic pillar for business survival. As acquisition costs continue to climb, companies are shifting their focus toward retention and expansion, placing a renewed emphasis on two foundational metrics: the Customer Satisfaction Score (CSAT) and the Net Promoter Score (NPS). While these metrics are often mentioned in the same breath, they provide fundamentally different insights into the health of a business. One captures the immediate "pulse" of a specific interaction, while the other offers a "big picture" view of brand loyalty and long-term viability.
The Foundation of Customer Centricity: Defining the Metrics
To understand the strategic application of these metrics, one must first define their functional boundaries. CSAT is a transactional metric designed to measure a user’s satisfaction with a specific event or interaction. It is the "right here, right now" feedback mechanism typically deployed immediately after a support ticket is resolved, a purchase is completed, or a new feature is engaged. By contrast, NPS is a relational metric. It ignores the minutiae of individual interactions to ask a broader question: "How likely are you to recommend our company/product to a friend or colleague?"
The divergence between these two scores often reveals the complexity of the user experience. A customer might be highly satisfied with a specific technical support interaction (High CSAT) but still remain unlikely to recommend the brand due to overall pricing concerns or a lack of long-term value (Low NPS). Conversely, a loyal advocate might tolerate a frustrating bug in the short term (Low CSAT) because they believe in the brand’s long-term vision (High NPS).
The Evolution of Feedback: A Chronology of Measurement
The journey toward modern sentiment analysis began in the late 20th century, primarily within call centers and retail environments. In the 1990s, CSAT emerged as the standard for measuring service quality. These early surveys were often cumbersome, conducted via phone or mail, and suffered from low response rates.
The landscape shifted dramatically in 2003 when Fred Reichheld, a partner at Bain & Company, introduced the Net Promoter Score in his landmark Harvard Business Review article, "The One Number You Need to Grow." Reichheld argued that traditional satisfaction surveys were too complex and failed to correlate with actual company growth. He proposed a single, simple question that could predict a company’s future health by identifying "Promoters" and "Detractors."
By the 2010s, the rise of SaaS and cloud computing necessitated a hybrid approach. Real-time feedback became essential as software moved from a one-time purchase to a continuous service model. Today, the integration of Artificial Intelligence and behavioral analytics represents the latest stage in this evolution. Modern platforms no longer just collect scores; they use generative AI to analyze the qualitative "why" behind the numbers, allowing product teams to predict churn before it happens.
Deep Dive: The Mechanics of CSAT
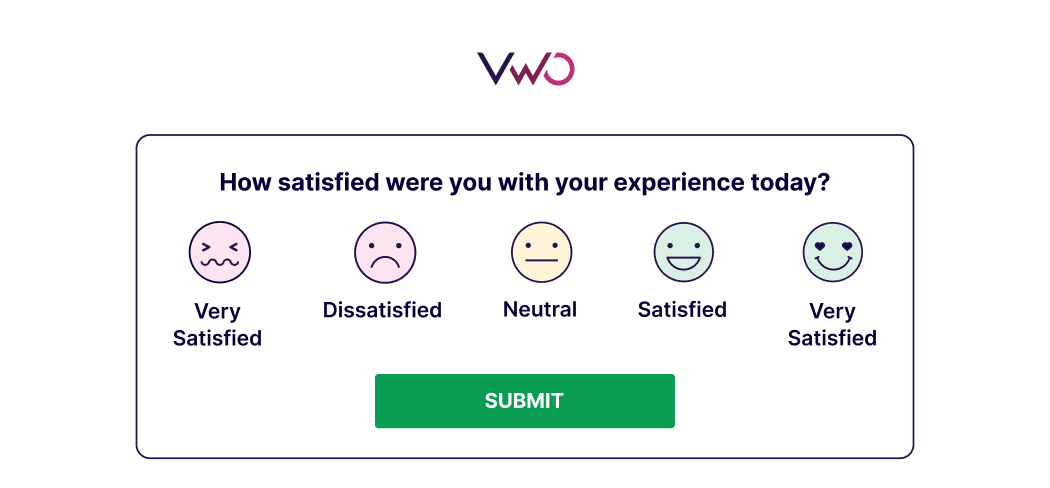
CSAT is valued for its simplicity and high response rates. The methodology typically involves asking a customer to rate their satisfaction on a scale—commonly 1–5 or 1–10. The score is calculated by taking the number of satisfied customers (those who responded with the highest two values) and dividing it by the total number of responses, then multiplying by 100 to get a percentage.
Supporting Data and Benchmarks:
Industry data suggests that for SaaS companies, a "good" CSAT score typically ranges between 75% and 85%. Because CSAT is tied to specific moments, it serves as an excellent diagnostic tool for operational performance. For instance, if a company releases a UI update and sees a sudden 15% drop in CSAT for "onboarding," the product team can pinpoint exactly where the friction lies.
The Limitations of CSAT:
The primary drawback of CSAT is its volatility. It is highly susceptible to "recency bias," where a customer’s mood at the moment of the survey outweighs their general perception of the brand. Furthermore, CSAT is a poor predictor of retention. A customer can be "satisfied" with a service but still leave for a competitor offering a lower price or a more robust feature set.

Deep Dive: The Mechanics of NPS
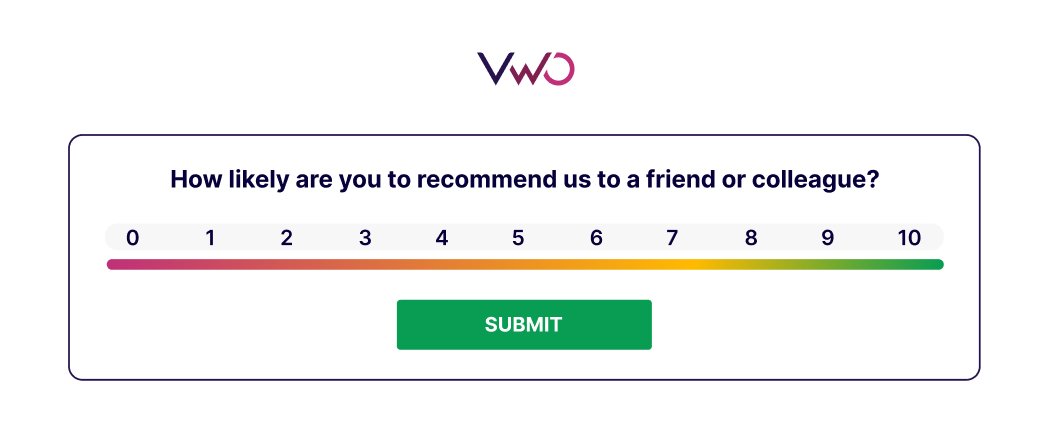
NPS categorizes respondents into three distinct groups based on a 0–10 scale:
- Promoters (9–10): Loyal enthusiasts who will keep buying and refer others.
- Passives (7–8): Satisfied but unenthusiastic customers who are vulnerable to competitive offerings.
- Detractors (0–6): Unhappy customers who can damage your brand through negative word-of-mouth.
The final NPS score is derived by subtracting the percentage of Detractors from the percentage of Promoters. This results in a score ranging from -100 to +100.
The Strategic Value of NPS:
NPS is a lead indicator of organic growth. Research by Bain & Company shows that in most industries, NPS leaders outpace their competitors’ growth by a factor of two. For a SaaS organization, NPS provides a high-level view of the "Product-Market Fit." A declining NPS score, even if revenue is currently stable, is often a precursor to a "churn crisis" six to twelve months down the line.
The Limitations of NPS:
Critics of NPS argue that it is too "noisy" and lacks actionable granularity. An NPS survey rarely tells a team what to fix; it only tells them that something is wrong. Additionally, the periodic nature of NPS (often sent quarterly) means it can miss rapid shifts in user sentiment that occur between survey cycles.
Comparative Analysis: Tactical vs. Strategic Utility
The choice between CSAT and NPS is not a matter of which is superior, but rather which is appropriate for the objective at hand. The following table summarizes the key distinctions:
| Feature | CSAT (Customer Satisfaction Score) | NPS (Net Promoter Score) |
|---|---|---|
| Primary Purpose | Measure immediate satisfaction | Measure long-term loyalty |
| Focus | Short-term "Reaction" | Long-term "Reputation" |
| Timing | Immediate (Real-time) | Periodic (Quarterly/Biannually) |
| Outcome | Tactical improvements (e.g., fixing a bug) | Strategic health (e.g., brand positioning) |
| Predictive Power | Low (Predicts short-term repeat use) | High (Predicts growth and churn) |
The Loyalty-Satisfaction Matrix: A Strategic Framework
The most sophisticated product and success teams do not view these metrics in isolation. Instead, they plot them together to create a "Loyalty-Satisfaction Matrix," which allows for highly targeted customer interventions.
- Brand Champions (High CSAT / High NPS): These are the ideal customers. They are satisfied with the product’s daily utility and loyal to the brand. Strategic move: Use them for case studies, testimonials, and referral programs.
- At-Risk Satisfied Users (High CSAT / Low NPS): These users find the tool useful but feel no emotional or strategic connection to the company. They are likely to switch to a competitor for a minor discount. Strategic move: Focus on brand-building, community engagement, and highlighting long-term value.
- Frustrated Loyalists (Low CSAT / High NPS): These customers believe in the brand’s vision but are struggling with the current product experience (perhaps due to bugs or a steep learning curve). Strategic move: Immediate technical intervention to fix friction points before their patience evaporates.
- Churn Risks (Low CSAT / Low NPS): These users have checked out both technically and emotionally. Strategic move: Immediate "save" attempts or a managed exit to prevent negative public reviews.
Expert Perspectives and Industry Responses
Industry leaders emphasize that the value of these metrics lies in the "Voice of the Customer" (VoC) they provide. Ali Good, Global Head of Strategy and Product Marketing at Quizizz, notes that VoC is a form of social proof that should be woven through all messaging. By using the actual language customers use in their feedback, companies can avoid "marketing-speak" and align their value proposition with actual user needs.
Furthermore, the rise of Generative AI has transformed how organizations handle feedback. Large-scale SaaS companies receiving thousands of responses monthly can no longer rely on manual tagging. AI-driven sentiment analysis can now surface recurring themes—such as "slow load times" or "confusing navigation"—automatically, allowing teams to move from data collection to action in a matter of hours.
Broader Impact and Implications for Business Growth
The integration of CSAT and NPS into a unified "Experience Optimization" engine has profound implications for business health. Research indicates that increasing customer retention rates by just 5% can increase profits by 25% to 95%. By using CSAT to optimize the "micro-moments" of the user journey and NPS to steer the "macro-strategy" of the brand, companies can create a sustainable growth loop.
Closing the loop is the final, and most critical, step. Collecting feedback without taking action is arguably worse than not collecting it at all, as it creates an expectation of change that, when unfulfilled, breeds resentment. Modern tools like VWO Pulse allow teams to bridge this gap by connecting survey results directly to behavioral analytics like heatmaps and session recordings. This allows a product manager to see that a customer gave a low CSAT score for "checkout" and then immediately watch a session recording to see exactly where the user clicked and failed.
In conclusion, while CSAT and NPS tell different stories, they are chapters in the same book. CSAT provides the tactical data necessary for day-to-day excellence, while NPS provides the strategic compass for long-term dominance. In the modern economy, the companies that win will be those that can listen to both the "pulse" and the "big picture," transforming raw feedback into a strategic lever for growth.