


The modern digital economy has entered a period of experimentation paralysis, where the very tools designed to drive growth are increasingly resulting in organizational stagnation. Data from industry simulations and reports from senior analytics leaders suggest that a significant majority of A/B tests—some estimates reaching as high as 85 percent—return "inconclusive" results when held to traditional academic standards. This phenomenon is creating a bottleneck in product development, leading to a decline in bold design proposals and a growing skepticism among stakeholders regarding the return on investment for experimentation programs. At the heart of this issue is a fundamental misalignment between the statistical thresholds used in academic publishing and the practical decision-making requirements of a fast-moving business environment.
The Crisis of the Inconclusive Result
For many conversion rate optimization (CRO) and product teams, the cycle is predictably frustrating. A team designs a variation, launches an experiment, and monitors traffic for a month, only to have their testing platform report that the results lack statistical significance. When these experiments are repeated, they frequently return the same inconclusive verdict. This pattern has profound psychological and operational consequences. Designers, wary of rejection, stop proposing radical changes; analysts produce reports that offer no actionable insights; and product managers find themselves unable to forecast progress.

Industry experts point out that this is rarely a failure of the teams themselves. Instead, it is a failure of the "decision policy" inherited by these organizations. Most experimentation platforms default to a 95 percent confidence interval (CI), a standard that requires an extremely high bar of evidence before certifying a winner. While this rigor is necessary for medical trials or peer-reviewed physics, it often proves counterproductive for business decisions where the cost of inaction may far outweigh the risk of a minor, directional error.
The Math of Uncertainty: A Simulation Analysis
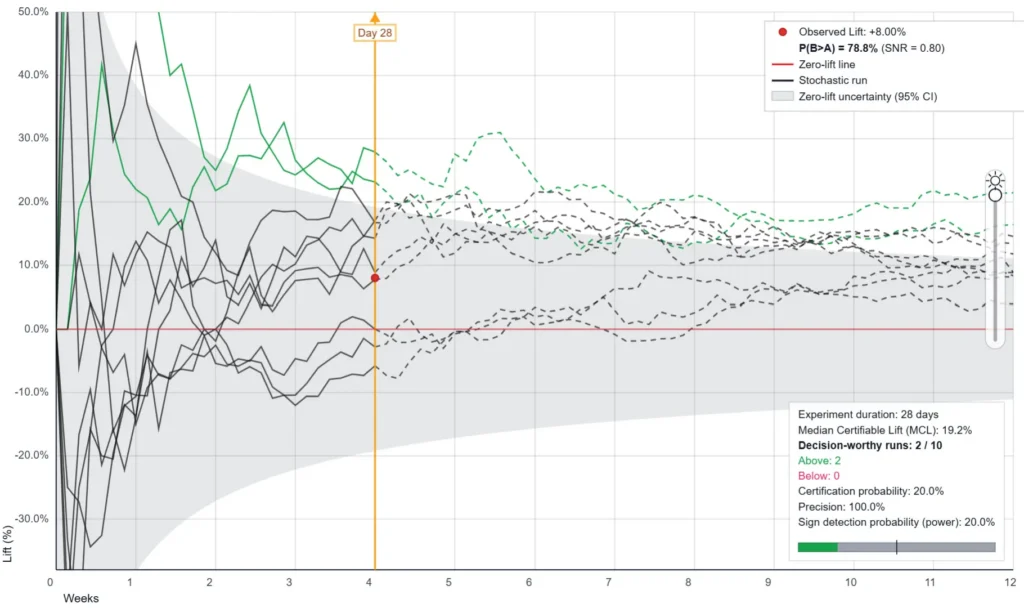
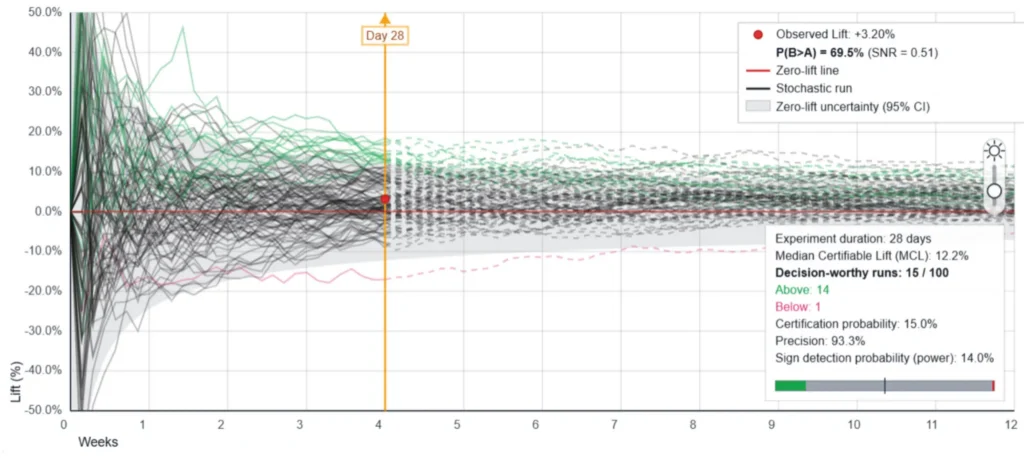
To quantify the impact of these rigid standards, recent simulations have modeled the performance of standard A/B testing policies under realistic business conditions. In a scenario where a business collects 500 conversions over four weeks with a true underlying lift of 3.2 percent—a respectable improvement in most commercial contexts—the traditional 95 percent confidence interval policy fails the business.
When this experiment was simulated 100 times, accounting for the random "noise" inherent in conversion rates, only 15 out of 100 experiments reached certification. The remaining 85 percent were returned as inconclusive. This suggests that the 95 percent CI policy is not designed to detect the subtle, incremental gains that characterize most successful digital optimizations. To reach a 50 percent chance of certifying a winner under these conditions, a "true lift" of 12.2 percent would be required—a threshold far beyond what most individual product tweaks can achieve.

This discrepancy highlights the "Median Certifiable Lift" (MCL), a metric that describes the true lift at which a specific policy has a 50 percent chance of certifying a winner. When the MCL is significantly higher than the actual effects being generated by a program, the program is mathematically destined to produce mostly inconclusive results, regardless of the quality of the ideas being tested.
The Double Standard in Business Risk
A critical analysis of organizational behavior reveals a stark double standard in how risk is managed. Corporate leaders routinely approve six-figure marketing campaigns or major product pivots based on customer interviews, creative intuition, or market trends that offer, at best, a 60 to 70 percent probability of success. These are considered sound business decisions.
However, when those same organizations run an A/B test, they suddenly demand a level of certainty that exceeds almost every other area of operation. A two-sided 95 percent confidence interval essentially requires a 97.5 percent one-sided confidence that the new version is better than the original. By holding experimentation to a bar 30 percentage points higher than other strategic bets, companies inadvertently stifle the very data-driven culture they aim to build.
Shifting the Paradigm: Signal-to-Noise Ratio (SNR)
In response to this paralysis, a growing movement within the data science community advocates for a shift toward decision policies based on the Signal-to-Noise Ratio (SNR). SNR measures the ratio between the observed difference in conversion rates (the signal) and the uncertainty of that difference (the noise).
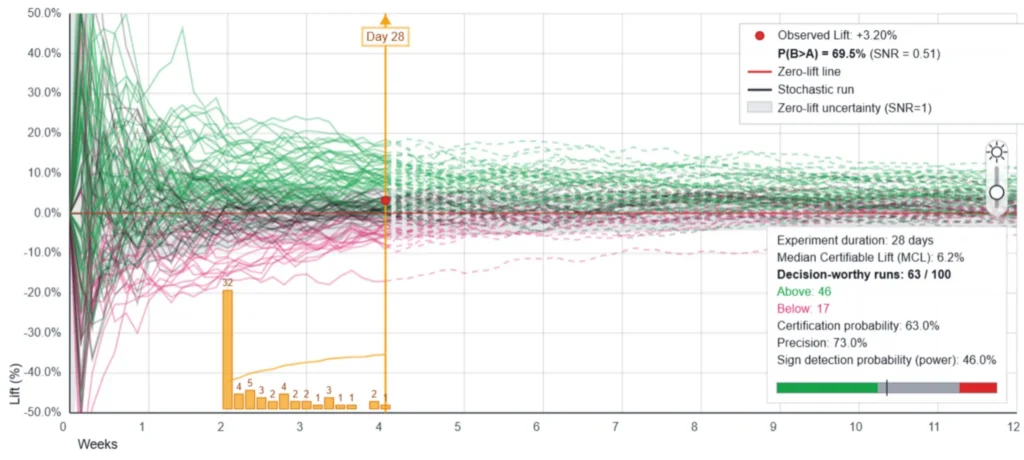
An SNR of 1 represents the natural first decision point—the moment where the observed signal is exactly as large as the uncertainty surrounding it. In mathematical terms, this corresponds to approximately an 84 percent one-sided posterior probability that the true direction of the change is positive.
When the same 100-experiment simulation was run using an SNR = 1 policy with daily monitoring after a two-week minimum, the results changed dramatically:
- Sign Detection: The probability of correctly identifying a winner rose from 14.1 percent to 46.1 percent.
- Inconclusive Rate: The number of inconclusive results dropped from 85 to 37.
- Precision: While precision (the percentage of "winner" calls that were actually correct) dropped from 93.3 percent to 73.0 percent, the overall velocity of the program increased nearly fourfold.
For a company running 50 experiments a year, this shift means moving from identifying seven real winners to identifying 23. While this path includes more "false positives," the aggregate gain from shipping three times as many winners often compensates for the smaller, negative impacts of incorrect calls.
Strategic Framework for Policy Design
To move away from inherited defaults, organizations are encouraged to design decision policies that match the stakes of the decision. This involves four key pillars of implementation:
- Pre-Launch Sign Detection Analysis: Before starting a test, teams should calculate the probability that their current policy can actually detect a realistic lift given their traffic. If the probability is low (e.g., 14 percent), the test is effectively a waste of resources before it begins.
- Negative Scenario Simulation: Organizations should simulate what happens when a change is actually detrimental (e.g., a -3 percent or -5 percent lift). A policy is considered safe if it maintains a precision level of 70-80 percent even in these "danger zones."
- Reversibility Calibration: The threshold for success should be tied to how easily a decision can be undone. A minor headline change on a landing page (highly reversible) should require a lower threshold than a fundamental change to a subscription pricing model (hard to reverse).
- Explicit Trade-off Acknowledgement: Teams must document and accept the "precision cost" of higher velocity. By stating that they accept a 25 percent chance of a directional error in exchange for a 300 percent increase in winner identification, they prevent "post-hoc" second-guessing of the data.
Industry Implications and the Path Forward
The transition from academic rigor to business utility represents a maturation of the digital experimentation field. Industry analysts suggest that the "Growth Engine" model of the next decade will be defined by velocity and the ability to capture incremental gains, rather than the search for occasional "unicorn" lifts that clear the 95 percent confidence bar.
Critics of this approach, often referred to as "statistical purists," argue that lowering thresholds inflates false positive rates and invalidates the statistical properties of the tests. However, proponents argue that these critiques are often "mathematically valid but practically useless." In a scenario where a "properly powered" test would require 40 years of traffic to reach 95 percent confidence, the choice is not between "good math" and "bad math," but between making an informed, directional decision or making no decision at all.
The broader implication for the tech industry is a move toward "continuous monitoring" and "sequential testing" protocols. These methods allow businesses to act as soon as enough evidence is gathered, rather than waiting for a fixed-horizon date that may have been arbitrarily chosen.
Ultimately, the goal of experimentation is not to achieve scientific certainty, but to improve the quality of business decisions. By aligning statistical policies with the actual risks and rewards of the digital marketplace, organizations can break the cycle of inconclusive results and transform their testing programs from bureaucratic hurdles into genuine engines of growth. The standard for experimentation is shifting: it is no longer about being 95 percent sure; it is about being sure enough to win.







