The Evolution of Conversion Measurement: From Data to Insight
The landscape of digital marketing has undergone a fundamental shift from a "traffic-first" mentality to a "conversion-first" philosophy. Historically, marketing success was measured by top-of-funnel metrics such as clicks and impressions. However, as the digital marketplace becomes increasingly saturated, the focus has shifted toward Conversion Rate Optimization (CRO)—the systematic process of increasing the percentage of website visitors who take a desired action.
Effective CRO measurement is not a retrospective activity; rather, it is a foundational component that must be established before any testing or campaign deployment begins. The current consensus among growth experts, including Josh Gallant, founder of Backstage SEO, is that many organizations fail to see improvements because they treat analytics as a diagnostic tool for failure rather than a roadmap for growth. By establishing a robust measurement framework, companies can identify not just where users are dropping off, but why those friction points exist.
Step 1: Establishing Outcome-Focused Strategic Objectives
The first phase of a sophisticated CRO program involves defining success through the lens of business outcomes rather than vanity metrics. Vague goals such as "increasing traffic" or "getting more leads" often lack the specificity required to drive meaningful optimization.
Transitioning from KPIs to Business Outcomes
To achieve measurable growth, organizations are encouraged to adopt outcome-focused goals. This involves translating broad business desires into specific, actionable targets:

- Customer Acquisition Cost (CAC) Reduction: Instead of seeking "more leads," a focused goal might be to reduce the cost per qualified lead by 15% within a fiscal quarter.
- Average Order Value (AOV) Elevation: For e-commerce entities, the goal shifts from "more sales" to increasing the total value of each transaction through strategic cross-selling and upselling.
- Sales Pipeline Velocity: In B2B contexts, optimization is often measured by how quickly a lead moves from initial contact to a closed-won opportunity.
The Role of Industry Benchmarks
While internal growth is the primary metric, industry benchmarks provide a necessary reality check. Data from Unbounce indicates that different traffic sources yield vastly different results; for instance, email marketing continues to lead with an average conversion rate of 19.3%, while paid social and paid search hover around 12% and 10.9%, respectively. Understanding these baselines allows marketers to set realistic expectations for their optimization efforts.
Step 2: Implementing a Multi-Layered Conversion Framework
A comprehensive measurement strategy must account for both macro and micro conversions. Relying solely on the final sale (the macro conversion) provides an incomplete picture of the user journey, often ignoring the incremental steps that lead to a successful outcome.
Tracking Micro Conversions
Micro conversions are smaller actions that signal user intent and engagement. By tracking these metrics, marketers can identify where the conversion funnel begins to leak. Key micro conversions include:
- Video views and engagement depth.
- Downloads of whitepapers or technical specifications.
- Add-to-cart actions that do not result in immediate purchase.
- Newsletter sign-ups and account creations.
- Time spent on high-intent pages, such as pricing or feature comparisons.
Monitoring these signals allows for a granular analysis of friction. For example, if a high percentage of users view a product demo but fail to initiate a free trial, the barrier likely exists within the demo’s closing call-to-action or the complexity of the sign-up form.
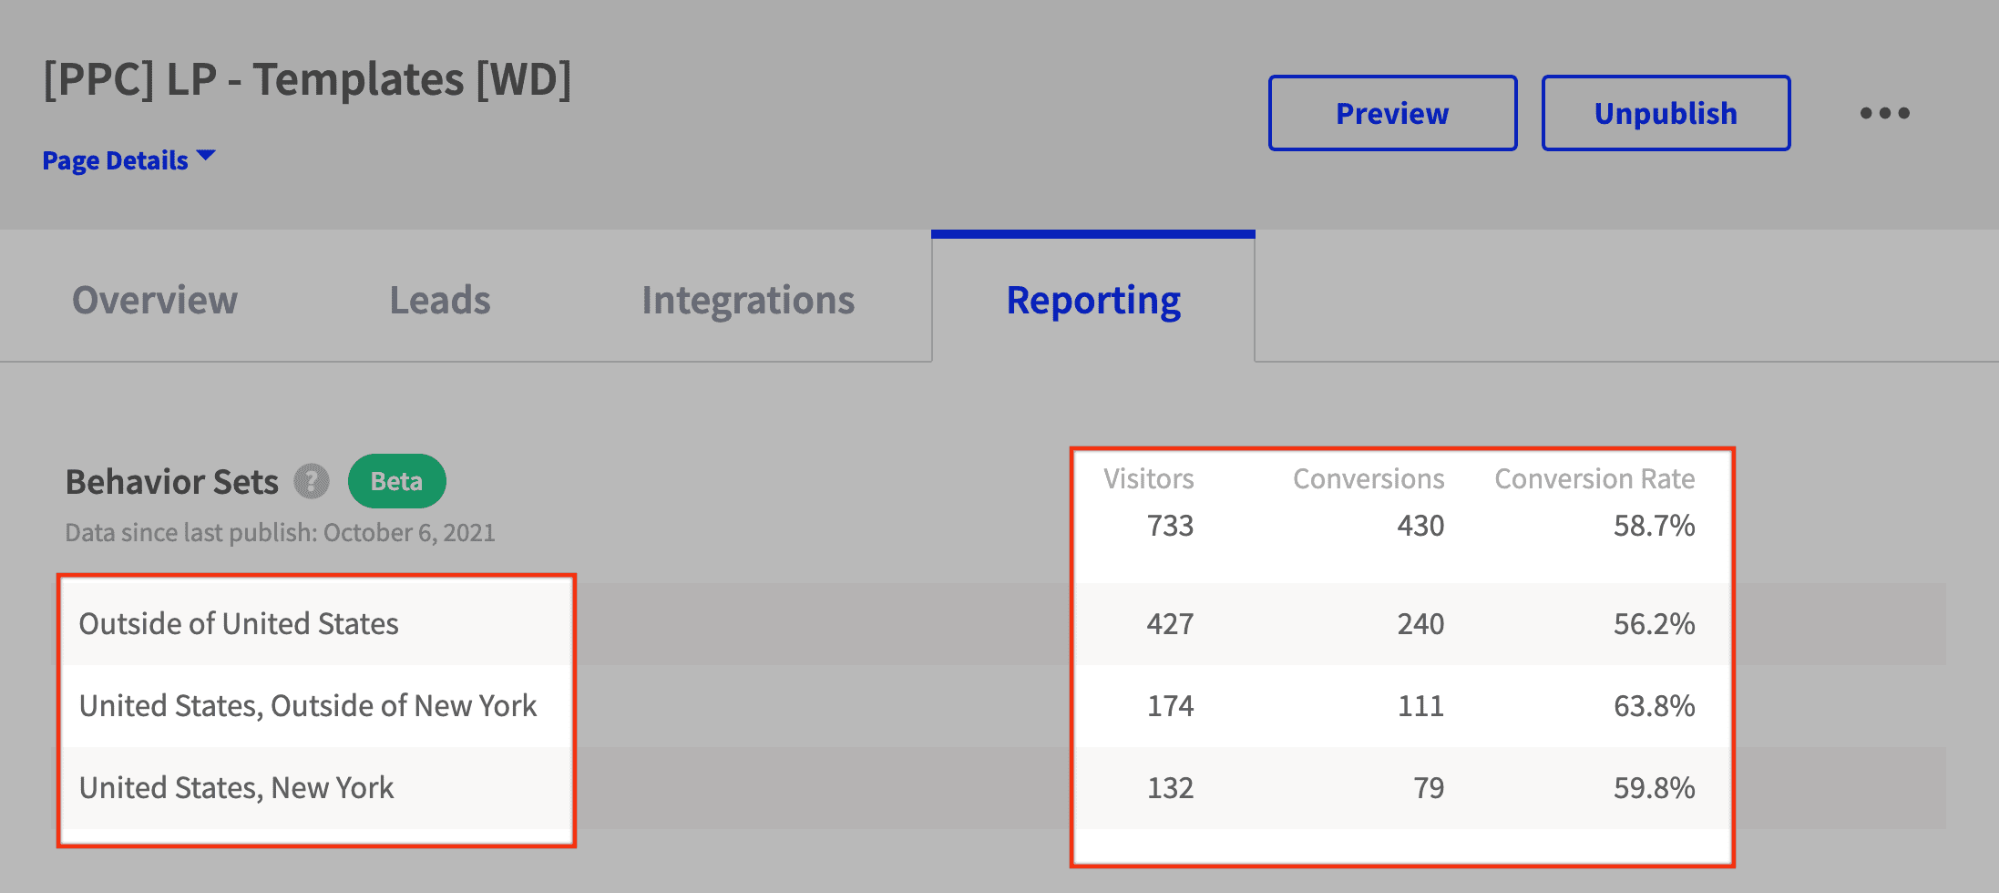
Funnel Analysis and Drop-Off Points
Modern analytics tools allow for the creation of funnel reports that visualize the step-by-step progression of a user. A typical funnel might track a visitor from the landing page to the product page, then to the pricing section, and finally to the checkout confirmation. Significant drop-offs—such as a 40% loss of users between the pricing page and the cart—provide clear directives for where optimization efforts should be prioritized.

Step 3: Integrating Qualitative Context into Quantitative Data
While quantitative data (the "what") provides the statistical foundation for CRO, qualitative data (the "why") offers the narrative context required for true understanding. Modern digital strategy requires the integration of visual and behavioral tools to bridge this gap.
Behavioral Mapping via Heatmaps and Recordings
Visual tools like heatmaps and session recordings allow marketers to observe user behavior at scale. Heatmaps can reveal "dead clicks"—instances where users click on non-interactive elements—or show that critical information is being ignored because it is placed "below the fold."
Recent analysis reveals a significant disparity in device-specific behavior. While approximately 83% of landing page visits now occur on mobile devices, desktop traffic still converts at an 8% higher rate on average. Session recordings can help explain this gap by highlighting mobile-specific friction points, such as unresponsive buttons or excessively long forms that are difficult to navigate on smaller screens.
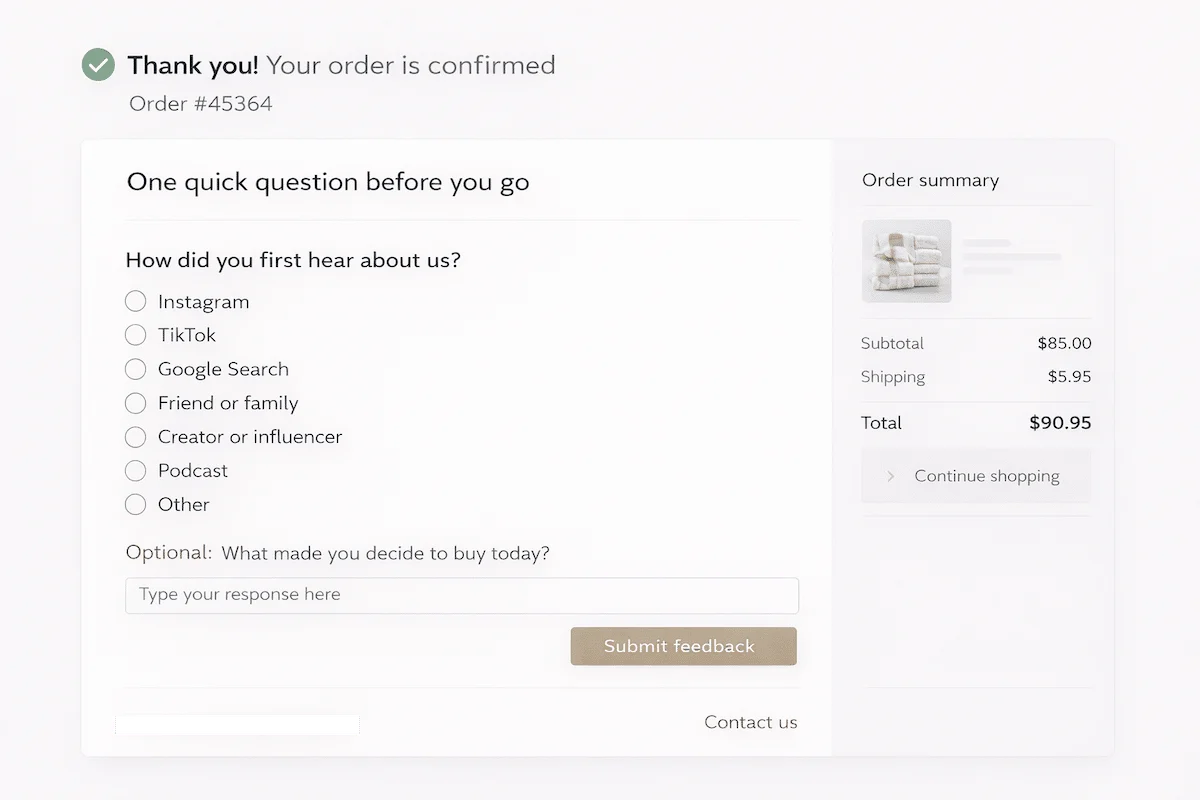
The Voice of the Customer (VOC)
Direct feedback through user surveys and exit-intent polls remains one of the most effective ways to identify conversion barriers. Questions such as "What nearly stopped you from completing your purchase today?" or "Was there anything missing from this page?" can uncover issues that no amount of data analysis would reveal, such as concerns over shipping costs or lack of clarity regarding a specific product feature.
Step 4: The Scientific Method in CRO: Data-Backed Hypotheses
The hallmark of a mature CRO program is the transition from "guess-and-check" testing to a rigorous scientific approach based on data-backed hypotheses.
Formulating the Hypothesis
A professional hypothesis follows a structured logical format: "Because we observed [specific data/insight], if we [implement this change], then [this metric] will [increase/decrease]." This ensures that every test is rooted in evidence rather than subjective opinion.
Prioritization and the 2×2 Matrix
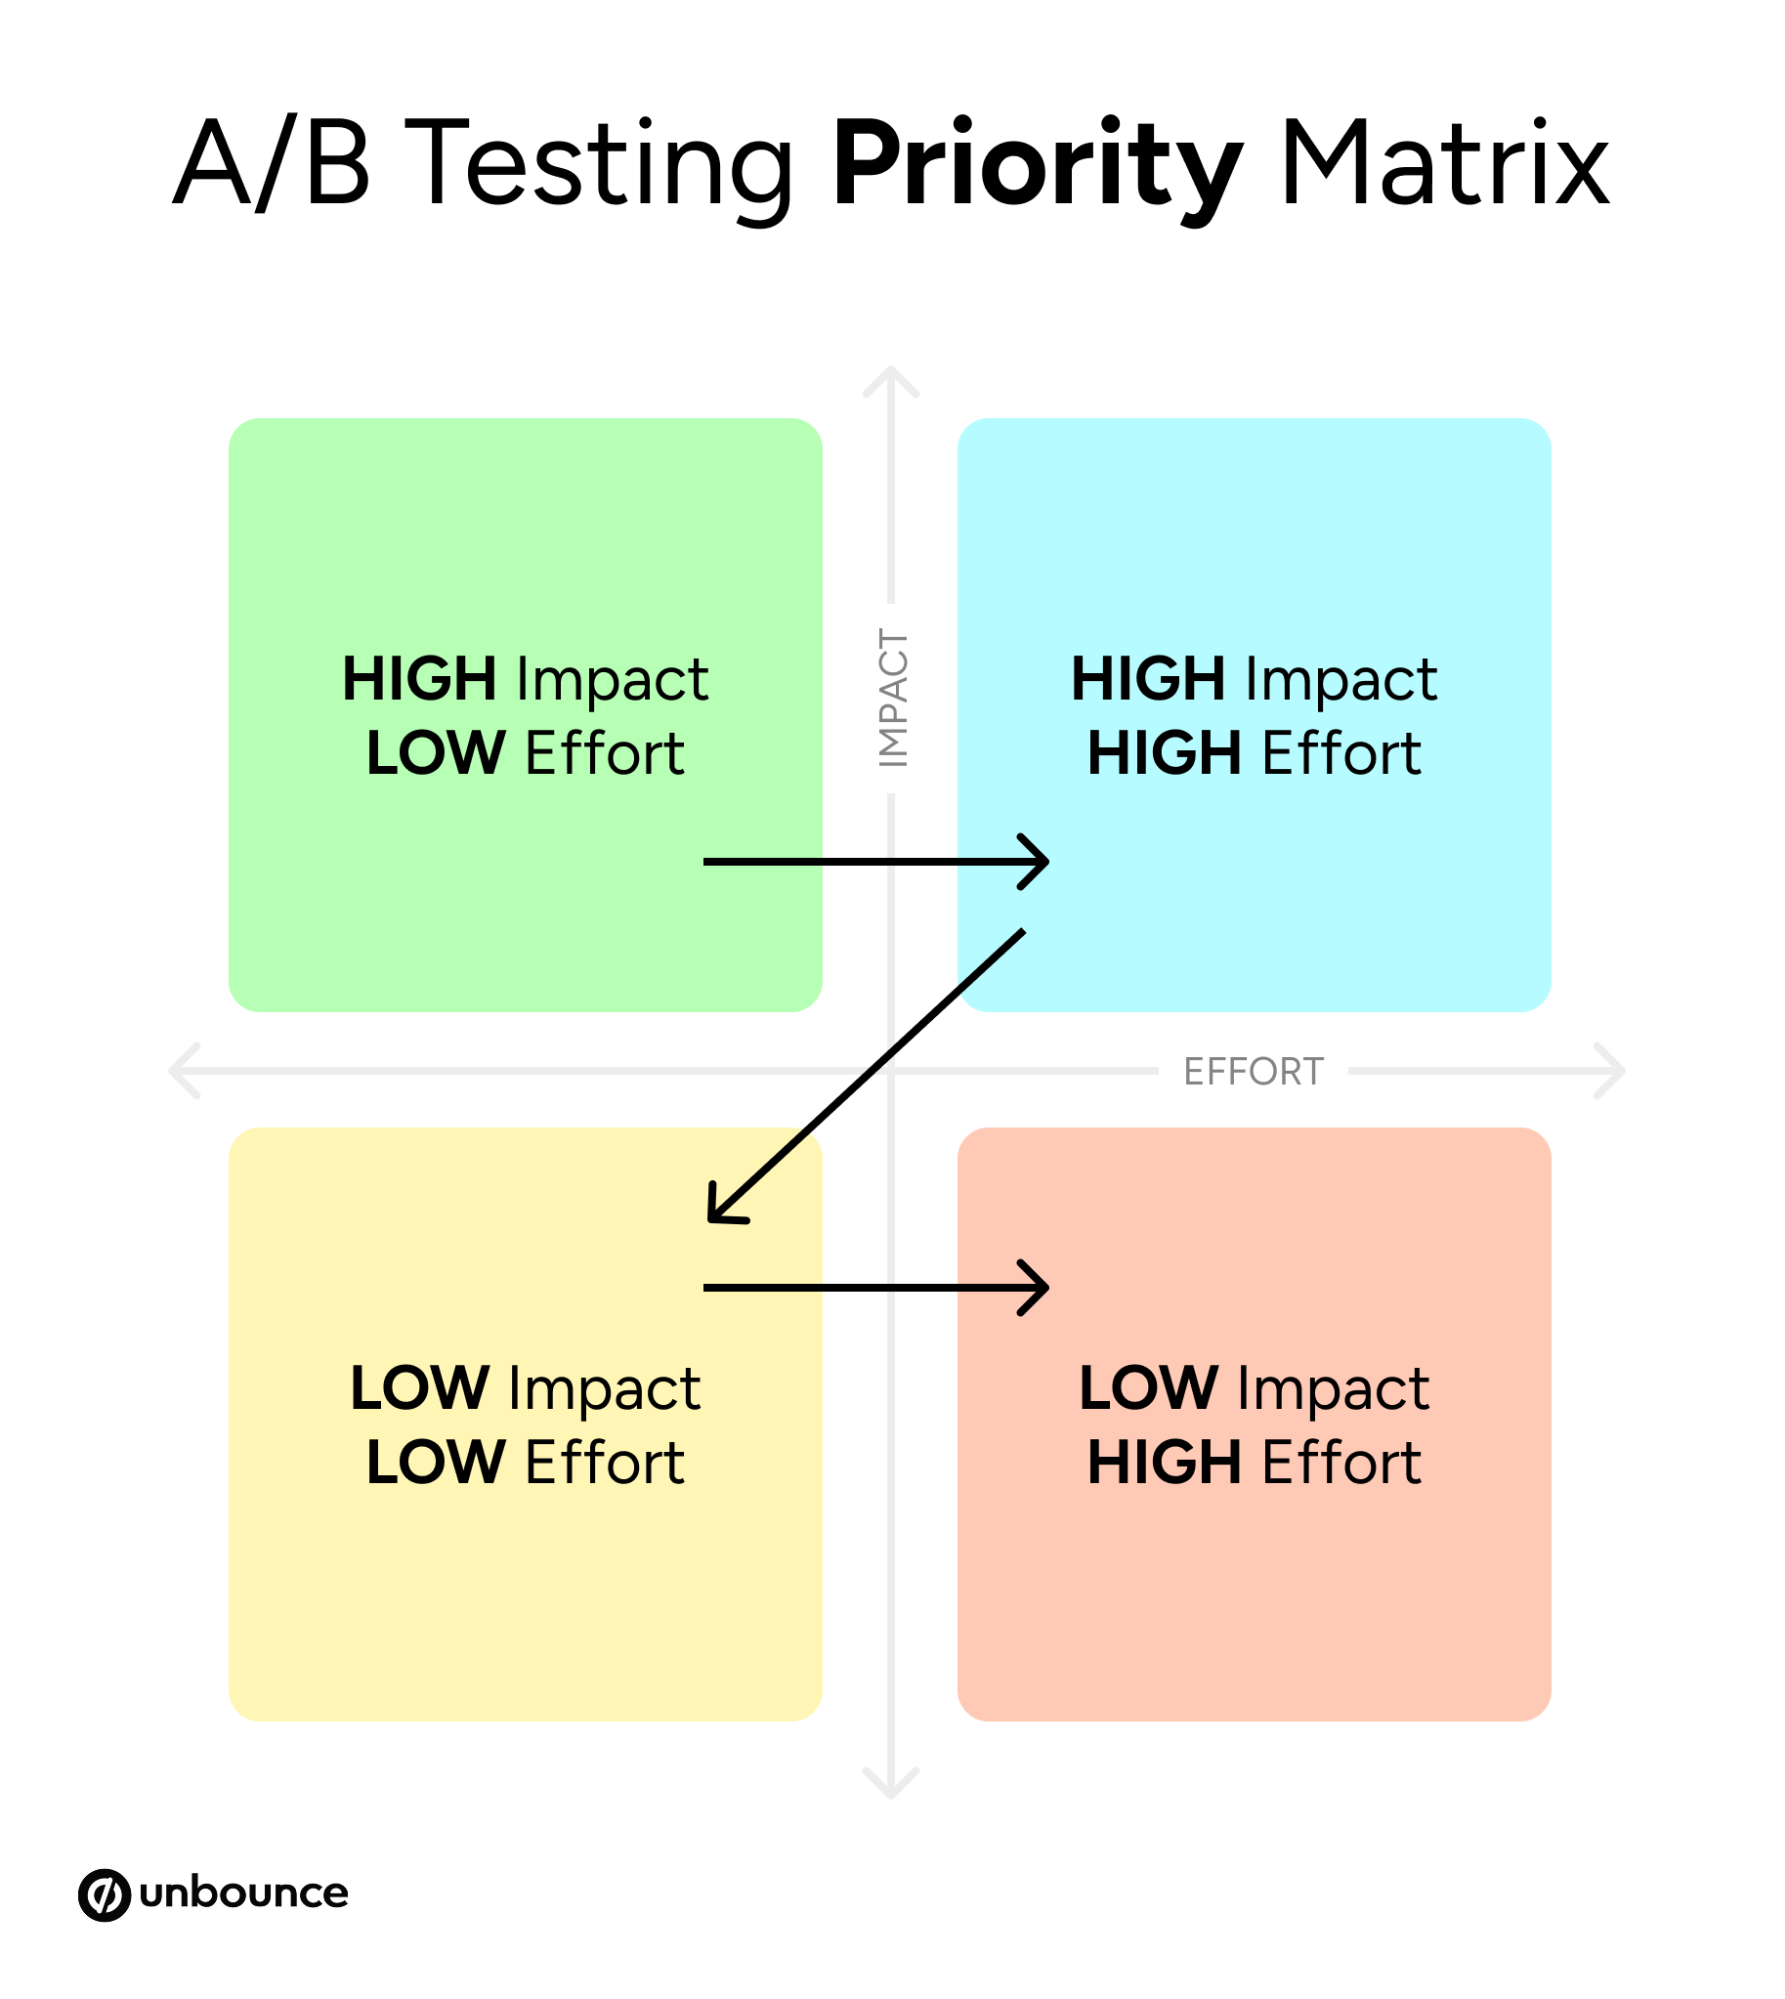
Organizations often face a backlog of potential tests. To manage resources effectively, tests should be evaluated using a prioritization matrix that weighs Potential Impact against Technical Effort.
- High Impact / Low Effort: These are "quick wins" that should be prioritized immediately.
- High Impact / High Effort: Strategic projects that require significant resources but offer high rewards.
- Low Impact / Low Effort: Minor adjustments that can be handled during routine maintenance.
- Low Impact / High Effort: Tasks that should generally be avoided or deprioritized.
Statistical Rigor and Significance
To ensure that test results are not the product of random chance, marketers must adhere to the principles of statistical significance. A result is typically considered significant if there is a 95% or higher probability that the observed difference is not due to chance. Prematurely declaring a "winner" in an A/B test can lead to the implementation of changes that do not actually improve performance in the long term.
Step 5: Building a Sustainable Culture of Experimentation
For CRO to drive long-term business growth, it must be integrated into the organizational culture as a continuous process rather than a one-off project. This "flywheel" effect occurs when the insights from one test inform the hypothesis for the next, creating a cycle of compounding gains.
The CRO Implementation Timeline
A standard cycle for a professional CRO program typically follows a monthly or quarterly cadence:
- Week 1 (Audit): Analyze funnel data and qualitative feedback to identify current bottlenecks.
- Week 2 (Hypothesis): Develop 3-5 data-backed hypotheses and prioritize them based on the impact/effort matrix.
- Week 3-4 (Testing): Deploy A/B or multivariate tests and monitor for statistical significance.
- End of Cycle (Analysis): Document learnings, implement winning variations, and use insights to plan the next cycle.
Broader Impact and Industry Implications
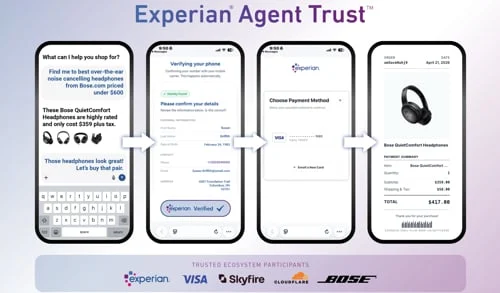
The implications of a robust CRO strategy extend beyond immediate revenue increases. In an environment where privacy regulations like GDPR and CCPA are limiting the effectiveness of third-party tracking, first-party data gathered through CRO becomes invaluable. Organizations that understand their users’ behaviors on their own platforms are better positioned to navigate the "cookie-less" future.
Furthermore, the integration of Artificial Intelligence (AI) into CRO tools is accelerating the pace of optimization. AI-driven platforms can now automate the delivery of personalized content and predict which variations will perform best for specific user segments, allowing marketing teams to focus on high-level strategy rather than manual testing.
Conclusion: Turning Metrics into Magic
The transition from drowning in data to driving conversions requires a disciplined adherence to the five-step framework: defining success, selecting the right metrics, adding qualitative context, building data-backed hypotheses, and fostering a culture of continuous improvement. By treating measurement as the prerequisite for optimization, businesses can move away from the uncertainty of guesswork and toward a future of predictable, scalable growth. As the digital landscape continues to evolve, the organizations that master the art and science of conversion measurement will be the ones that thrive in an increasingly competitive market.