The integrity of digital experimentation has become a focal point for data scientists and conversion rate optimization (CRO) specialists as the industry grapples with the phenomenon of "p-hacking." In the context of A/B testing, p-hacking refers to the manipulation or selective reporting of data until a result reaches the threshold of statistical significance. This practice, whether intentional or accidental, creates an illusion of success that can lead organizations to implement website changes that offer no real value or, in worse cases, actively harm user experience and revenue. As businesses increasingly rely on data-driven decision-making, understanding the mechanics of p-hacking and implementing rigorous statistical guardrails has transitioned from a technical preference to a commercial necessity.
The Statistical Foundation and the Rise of P-Hacking
Statistical significance, often represented by the p-value, is intended to measure the probability that the observed difference between a control group and a variant occurred by random chance. Traditionally, a p-value of less than 0.05 is considered significant, suggesting a 5% or lower probability that the result is a "false positive." However, the pressure to deliver "winning" experiments has led many practitioners to fall victim to Goodhart’s Law: the economic principle stating that when a measure becomes a target, it ceases to be a good measure.

In the fast-paced environment of B2B SaaS and e-commerce, the desire for rapid iteration often clashes with the slow, methodical requirements of sound statistics. P-hacking manifests when testers prioritize the "win" over the insight. By repeatedly checking data, switching metrics mid-stream, or stopping tests the moment a software dashboard turns green, experimenters inadvertently inflate their Type I error rate—the probability of rejecting a null hypothesis that is actually true.
The Scope of the Problem: Supporting Data and Analysis
The scale of p-hacking in the commercial sector was highlighted in a landmark 2018 analysis conducted by the Advertising Research Foundation (ARF) and the Marketing Science Institute (MSI). The study examined 2,101 commercially run A/B tests and discovered a startling trend: approximately 57% of experimenters engaged in some form of p-hacking when their results approached a 90% confidence level.
The consequences of this behavior are mathematically devastating to an experimentation program’s ROI. At a standard 90% confidence threshold, the False Discovery Rate (FDR)—the proportion of reported "wins" that are actually statistical noise—typically sits around 33%. When p-hacking behaviors are introduced, the FDR climbs to 42%. This means that nearly nearly half of the "successful" changes implemented by a team might have no impact on the bottom line, leading to what is known as "implementation debt," where code is added and maintained for features that provide zero utility.

Sundar Swaminathan, author of the experiMENTAL newsletter, notes that p-hacking is particularly dangerous because it cloaks random noise in the garb of significant results. According to Swaminathan, the premature termination of experiments based on interim p-values is essentially cherry-picking data points to support a preconceived hypothesis. This not only jeopardizes individual test results but undermines the institutional credibility of the entire experimentation department.
A Chronology of Experimentation Errors: When P-Hacking Creeps In
P-hacking is rarely the result of a single malicious act; rather, it is a cumulative series of shortcuts taken during the lifecycle of an experiment. To prevent it, organizations must recognize the specific moments where rigor typically fails.
Phase 1: Pre-Experiment Planning
The most common error occurs before the first visitor even sees the test. Failure to pre-calculate the required sample size and test duration leads to "under-powered" tests. Without a fixed horizon, testers are more likely to let a test run indefinitely until it happens to hit a significant result by chance, or conversely, kill a test before it has the statistical power to detect a real effect.

Phase 2: During the Experiment (The Peeking Problem)
The most frequent form of p-hacking is "peeking." In a traditional frequentist framework, the statistical assumptions require that the data be analyzed only once, at the conclusion of the test. However, modern testing dashboards provide real-time updates. If a tester looks at the results daily and decides to stop the test the moment the p-value dips below 0.05, they are exponentially increasing the risk of a false positive. Each "peek" acts as a new opportunity for random fluctuation to be misidentified as a trend.
Phase 3: Post-Experiment Analysis
Once a test concludes without a clear winner, the temptation to "find" a win elsewhere becomes intense. This often involves:
- Metric Switching: If the primary goal (e.g., completed purchases) shows no significance, the tester might look at secondary goals (e.g., add-to-carts) and report that as the "win."
- Post-Test Segmentation: Slicing the data by browser, region, or device until a significant result appears in a sub-group. While segmentation is valuable for generating new hypotheses, reporting a segment-specific win from a test designed for a general population is a classic p-hacking maneuver.
Strategic Safeguards and Technical Solutions
To combat these pitfalls, industry leaders are adopting sophisticated statistical methods and software tools, such as Convert Experiences, to enforce discipline. These solutions focus on creating "statistical guardrails" that prevent human bias from contaminating the data.
1. Primary Goal Labeling and Guardrail Metrics
A rigorous experiment must have one—and only one—primary metric defined before launch. All other metrics should be treated as "guardrails." For instance, if the goal is to increase "Sign-ups," a guardrail metric might be "Page Load Speed" or "Unsubscribe Rate." This ensures that the success of the test is judged solely on its intended impact, while secondary metrics serve only to ensure that no collateral damage was caused.
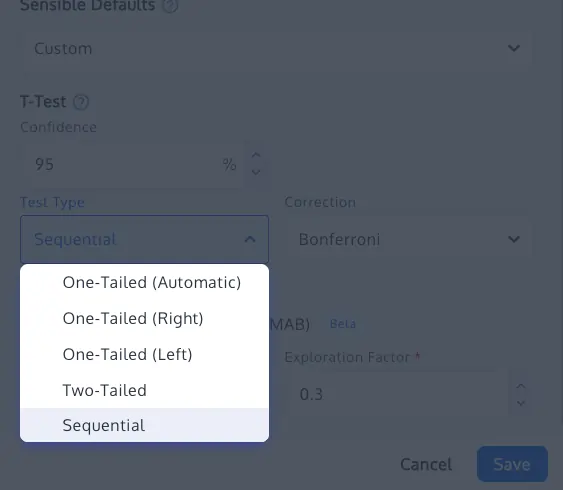
2. Sequential Testing and Always-Valid Inference
To address the "peeking problem" without slowing down business operations, many organizations are moving toward sequential testing. Based on recent research (such as Waudby-Smith et al., 2023), sequential testing uses confidence sequences that provide "always-valid" p-values. This allows teams to monitor data in real-time and stop tests early if a result is exceptionally strong, all while maintaining the integrity of the false positive rate.
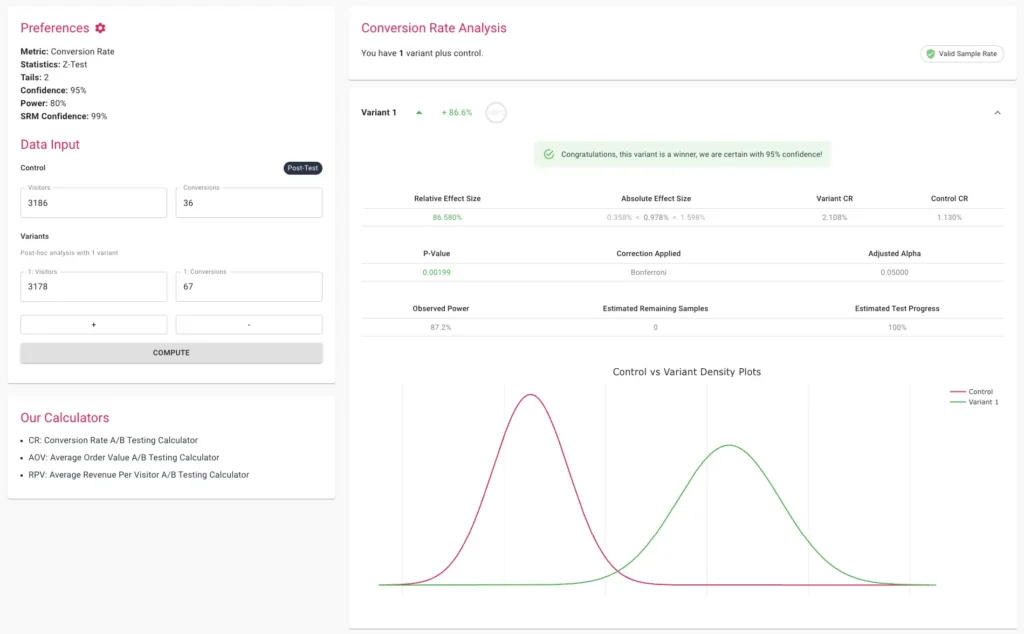
3. Multiple Comparison Corrections (Bonferroni and Sidak)
When testing multiple variants against a single control, the probability of a false positive increases. If you have five variants, the chance of one appearing as a winner by luck is much higher than 5%. To correct for this, statistical adjustments like the Bonferroni or Sidak corrections are applied. These methods tighten the significance threshold, requiring a much stronger result to declare a "win" when multiple comparisons are involved.

4. Sample Ratio Mismatch (SRM) Checks
Even a perfectly designed test can be invalidated by technical errors. A Sample Ratio Mismatch occurs when the actual traffic split (e.g., 48/52) deviates significantly from the intended split (e.g., 50/50). This often indicates a "broken" experiment caused by bot interference, tracking failures, or redirect issues. Modern platforms now include built-in SRM checks using Chi-square goodness-of-fit tests. If an SRM is detected, the results must be discarded regardless of the p-value, as the randomization—the very foundation of the A/B test—has been compromised.
The Role of Multi-Armed Bandits
In scenarios where the primary objective is rapid optimization rather than pure scientific proof, "Multi-Armed Bandit" (MAB) algorithms are becoming a preferred alternative to traditional A/B testing. MAB dynamically reallocates traffic to the better-performing variant in real-time. While this approach is not designed to provide classical statistical evidence of a causal effect, it minimizes "regret" (the loss incurred by sending traffic to a losing variant). This is particularly useful for short-term campaigns, such as holiday promotions, where the opportunity cost of running a long, fixed-horizon A/B test is too high.
Broader Impact and Industry Implications
The move away from p-hacking represents a maturing of the digital experimentation industry. In the early days of CRO, the focus was often on "quick wins" and "hacks." Today, as experimentation becomes a core pillar of product development at companies like Netflix, Amazon, and Booking.com, the focus has shifted toward building a "culture of experimentation" rooted in scientific integrity.
The business implications of moving toward more rigorous testing are profound. Organizations that eliminate p-hacking report:
- Higher Long-term ROI: By only implementing changes with true positive effects, cumulative gains are realized over years rather than disappearing after a few months.
- Reduced Technical Debt: Developers spend less time implementing and maintaining features that do not contribute to business goals.
- Improved Organizational Trust: When data is reliable, stakeholders across the company—from marketing to finance—are more likely to trust and invest in the experimentation program.
Conclusion: The Path Forward
P-hacking is a byproduct of the natural human desire to succeed and the organizational pressure to show progress. However, in the realm of statistics, shortcuts lead to mirages. By adopting rigid stopping rules, pre-defining success metrics, and utilizing advanced statistical methods like sequential testing and SRM checks, companies can transform their experimentation programs from "win-hunting" exercises into reliable engines for insight.
The future of digital experimentation lies in the balance between speed and rigor. While tools like Convert provide the technical infrastructure to prevent p-hacking, the ultimate responsibility lies with the experimenters themselves to maintain the discipline required for true discovery. As the 2018 ARF analysis suggests, the difference between a 33% and a 42% false discovery rate may seem small on paper, but in the competitive landscape of the digital economy, it is the difference between genuine growth and expensive noise.