 Nila Kartika Wati
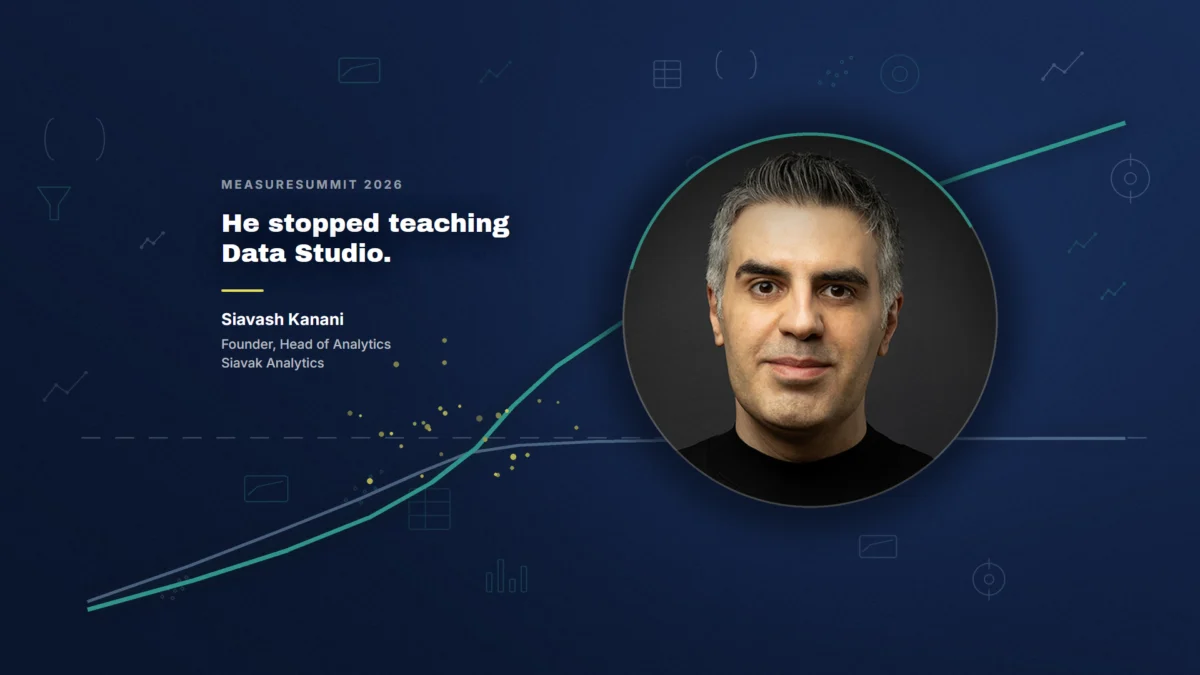
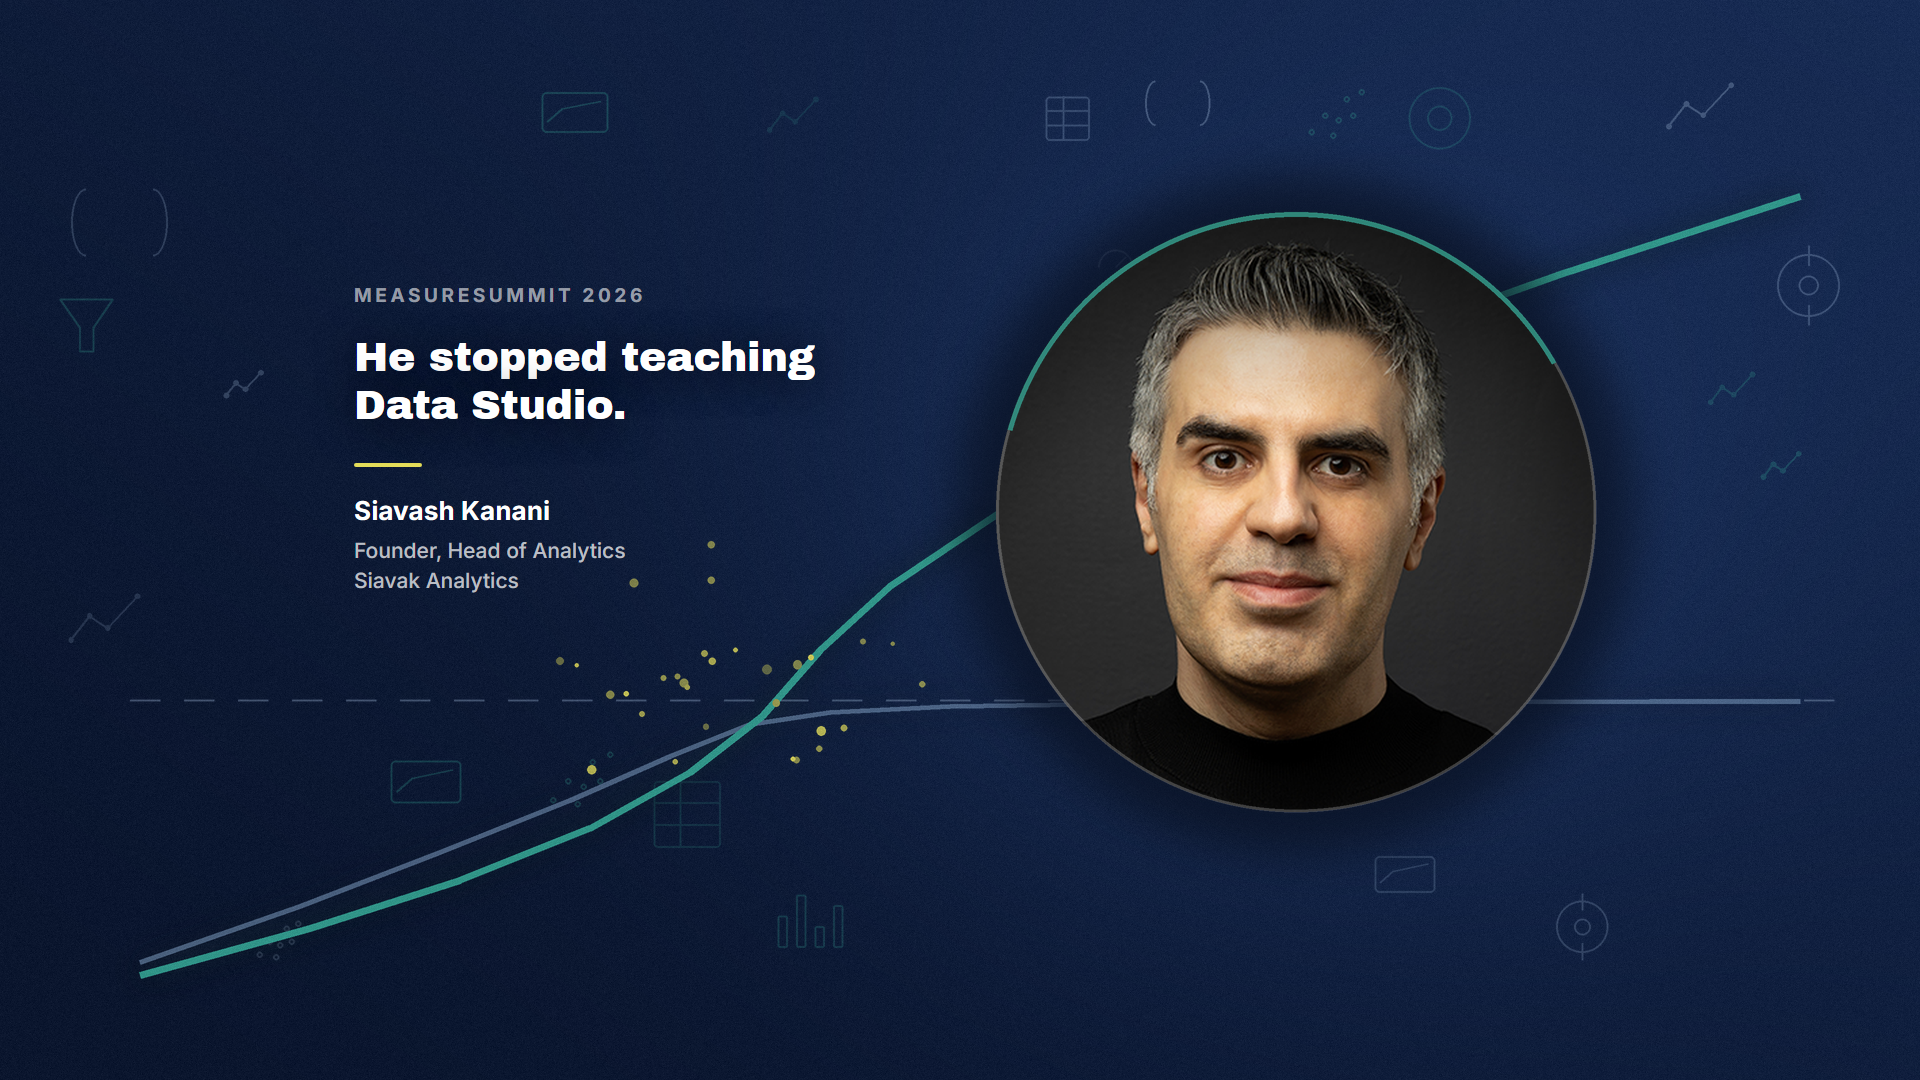
The landscape of business intelligence and data visualization underwent a significant shift during the MeasureSummit in October 2026, as industry leaders signaled a definitive move away from legacy reporting tools. Siavash Kanani, a prominent figure who has trained over a thousand professionals in Google’s data visualization ecosystem, announced his departure from teaching the platform, citing a fundamental misalignment between the tool’s strategic direction and the needs of professional agencies. This transition marks a broader trend in the analytics industry: the abandonment of "local maximums" in favor of custom-built, AI-assisted software applications that bypass the traditional limitations of browser-based dashboarding tools.
The Strategic Instability of Legacy BI Tools
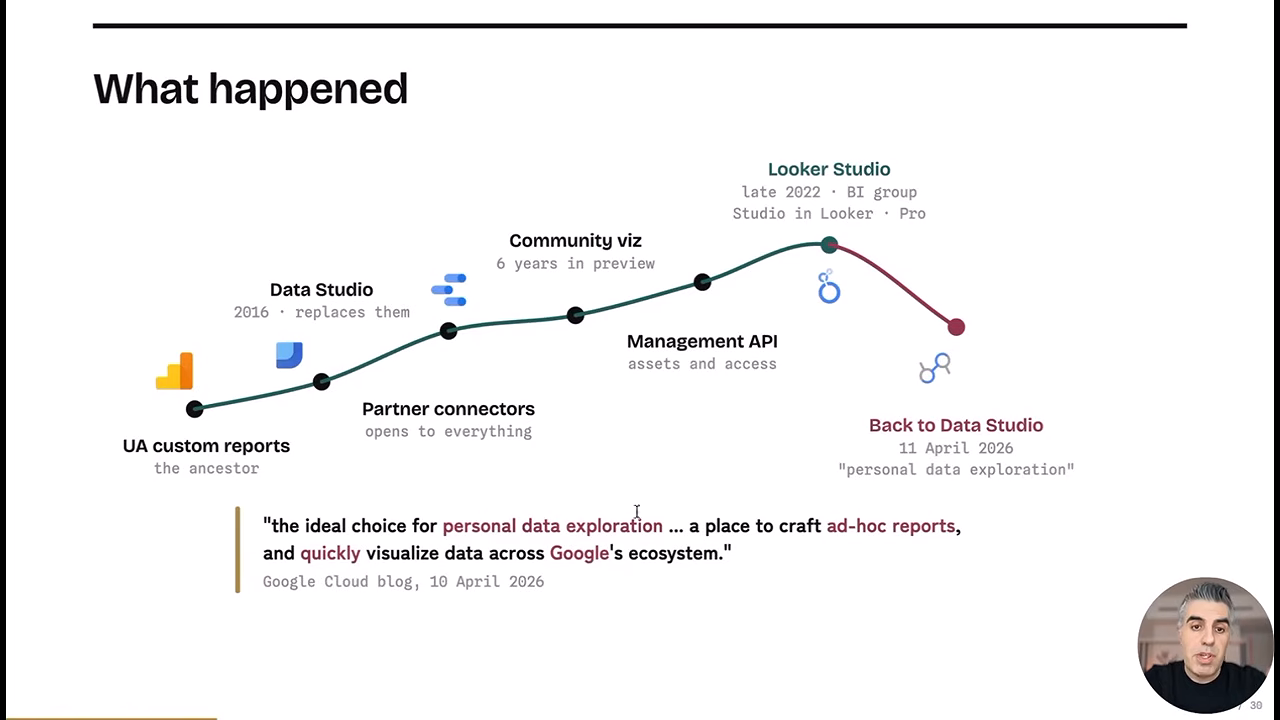
The catalyst for this industry-wide re-evaluation was a series of branding and strategic shifts within Google’s reporting suite. On April 11, 2026, Google officially reverted the name of its primary visualization tool from Looker Studio back to Data Studio, reversing a high-profile rebranding effort that began in late 2022. This move followed the original 2016 launch of Data Studio, creating a decade-long cycle of identity shifts that analysts suggest indicates a lack of long-term strategic priority within the Google ecosystem.
According to Google’s updated internal documentation, the tool is now explicitly positioned as a platform for "personal data exploration" and "ad hoc reports." This classification represents a significant downgrade for agencies that had previously utilized the tool as a primary client-facing reporting solution. By framing the product as a tool for personal use rather than enterprise-grade agency reporting, the developer has signaled that advanced features required for professional scaling may no longer be a roadmap priority.
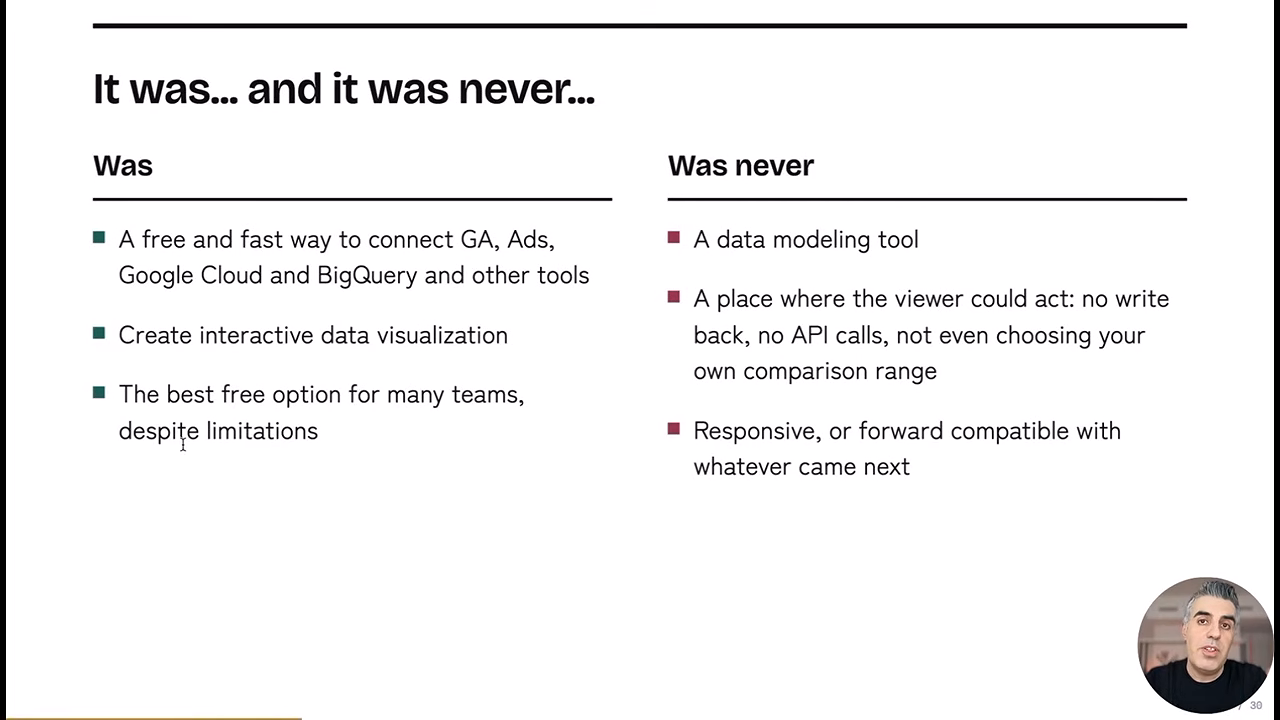
Furthermore, the integration of native dashboarding features within Google Analytics 4 (GA4) has created internal competition. As GA4 builds its own visualization layers, the necessity for an external tool like Data Studio diminishes for standard users, leaving professional analysts in a precarious position. The "ceiling" of the tool—the point at which a professional’s needs exceed the tool’s capabilities—has become an insurmountable barrier for those managing complex, multi-client data environments.
Chronology of the Visualization Ceiling
To understand the current migration toward custom applications, it is necessary to examine the timeline of limitations that have plagued legacy BI tools:
- 2016 – 2022: Data Studio gains massive adoption due to its free-to-use model and seamless integration with Google Ads and Analytics. However, core features like "Community Visualizations" enter a developer preview phase that remains stagnant for over half a decade.
- Late 2022: The transition to Looker Studio attempts to align the tool with enterprise-level business intelligence, yet the underlying infrastructure remains limited by browser performance and rigid API constraints.
- 2023 – 2025: Analysts begin developing "workarounds"—external scripts and third-party connectors—to patch holes in the software. These include tools for automated auditing, custom triggers, and enhanced data blending.
- April 2026: The reversion to the "Data Studio" name and the "personal exploration" label confirms to the market that the tool will not evolve into the fully customizable enterprise solution many had hoped for.
- October 2026: Leading educators and developers officially pivot toward custom SaaS (Software as a Service) builds, leveraging Large Language Models (LLMs) to bridge the technical gap.
The Technical Barriers of "The Boring 80%"
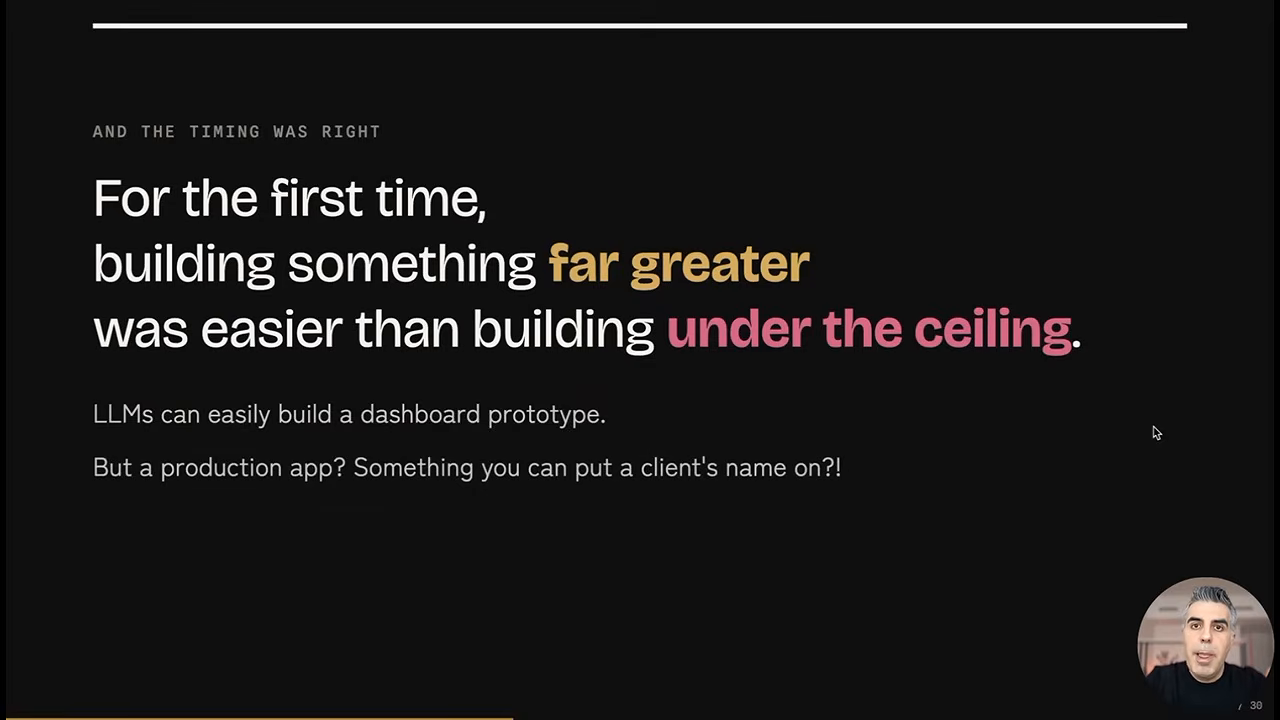
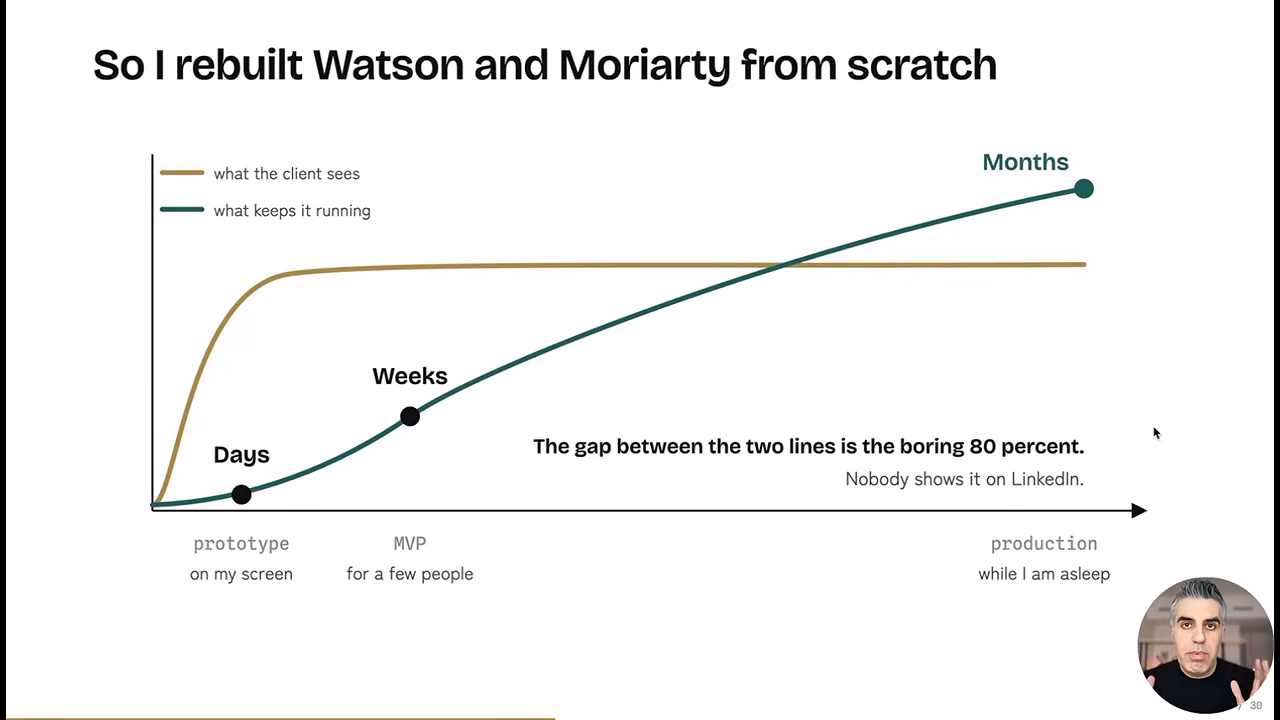
A central theme of the 2026 MeasureSummit was the concept of the "Boring 80%." While the rise of generative AI has made it possible to build a functional data dashboard prototype in a matter of days, the transition from a prototype to a production-ready application remains a rigorous engineering challenge.
Industry data suggests that while 20% of the effort goes into the visible data visualization, 80% of the labor involves unsexy production work: infrastructure, security, user authentication, and multi-tenant data architecture. For years, analysts accepted the limitations of Data Studio because the alternative—hiring a full-stack development team—was cost-prohibitive. However, the maturation of LLMs like Claude and GPT-5 has fundamentally altered the "build vs. buy" equation.
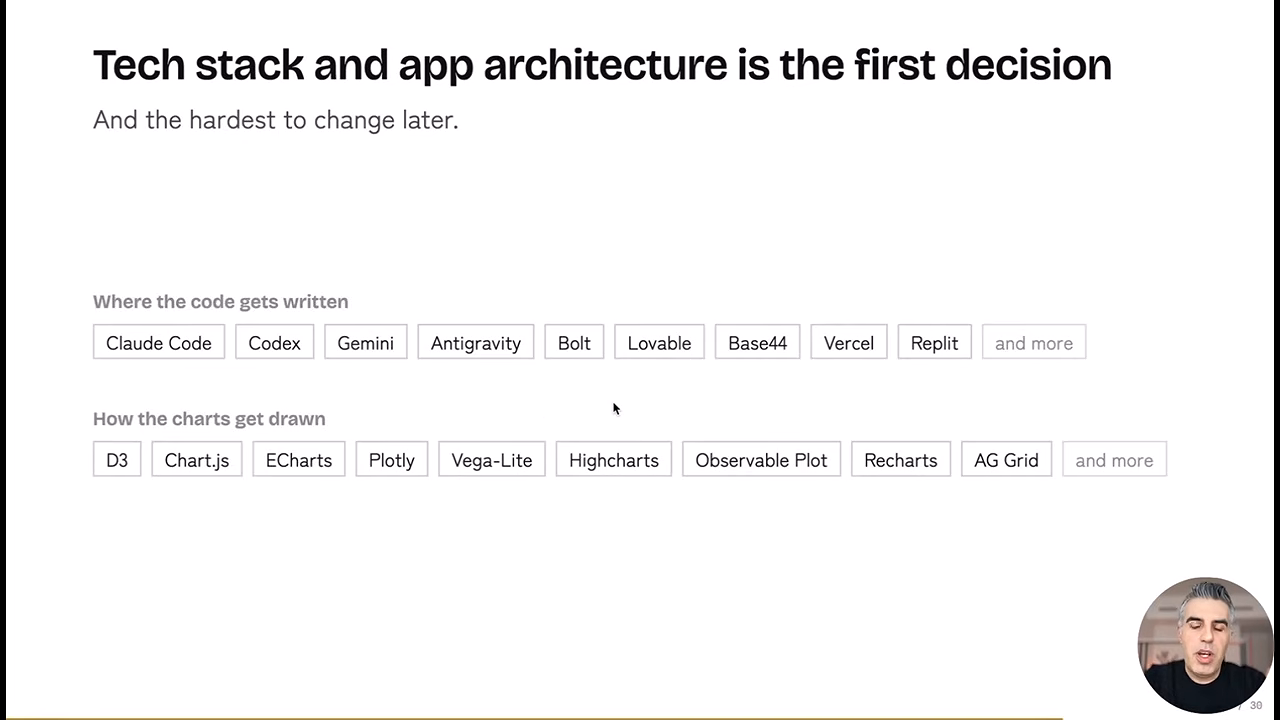
Analysts who are not traditionally trained as software engineers are now utilizing AI to write complex JavaScript, manage BigQuery integrations, and deploy applications on Vercel or AWS. This shift allows for the creation of "Adaptive Reporting," where the same underlying dataset can be presented through different lenses—strategic, operational, or narrative—depending on the user’s role. Such functionality is virtually impossible in standardized BI tools, which often struggle with dynamic text regeneration and cross-filtered narrative summaries.
Comparative Analysis: Legacy Dashboards vs. Custom Applications
The move toward custom builds is driven by specific technical requirements that legacy platforms have failed to address. Professional agencies require features that go beyond simple charts:
1. Ownership and Branding
Legacy tools host reports on the provider’s domain, often with limited white-labeling capabilities. Custom applications allow agencies to host reporting hubs on their own subdomains, creating a seamless brand experience. This includes custom login screens, branded navigation, and integrated client communication tools.
2. Analytical Depth and AI Integration
Standard dashboards are primarily descriptive—they show what happened. Custom applications, such as the rebuilt "Watson" (now known as Analytics Detective), utilize APIs to perform diagnostic and prescriptive analysis. These tools can automatically identify the root cause of a traffic drop in GA4 and provide an AI-generated summary of recommended actions, rather than just displaying a downward-trending line chart.
3. Performance and Scalability
Browser-based tools often suffer from latency when processing large datasets or complex "blended" data sources. By moving the processing to the server side in a custom app, developers can achieve near-instant load times. This is critical for agencies managing hundreds of client accounts where manual report refreshing is no longer viable.
Market Implications and Professional Reactions
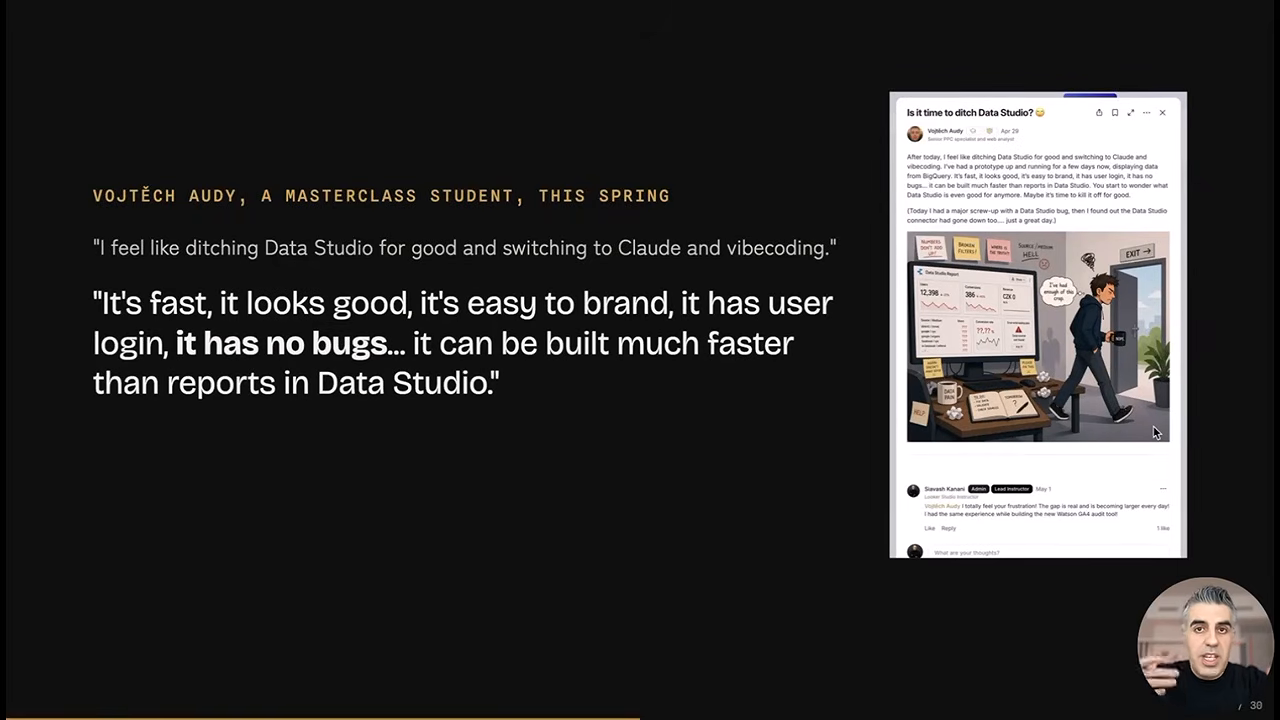
The reaction from the analytics community has been one of cautious optimism mixed with the realization that the skill set of a "Data Analyst" is evolving into that of a "Data Product Developer." Vojtěch Audy, a prominent analytics professional, noted that after just two days of working with AI-assisted coding, he was able to build a reporting interface that was faster, more secure, and more visually aligned with client needs than anything possible within the Google ecosystem.
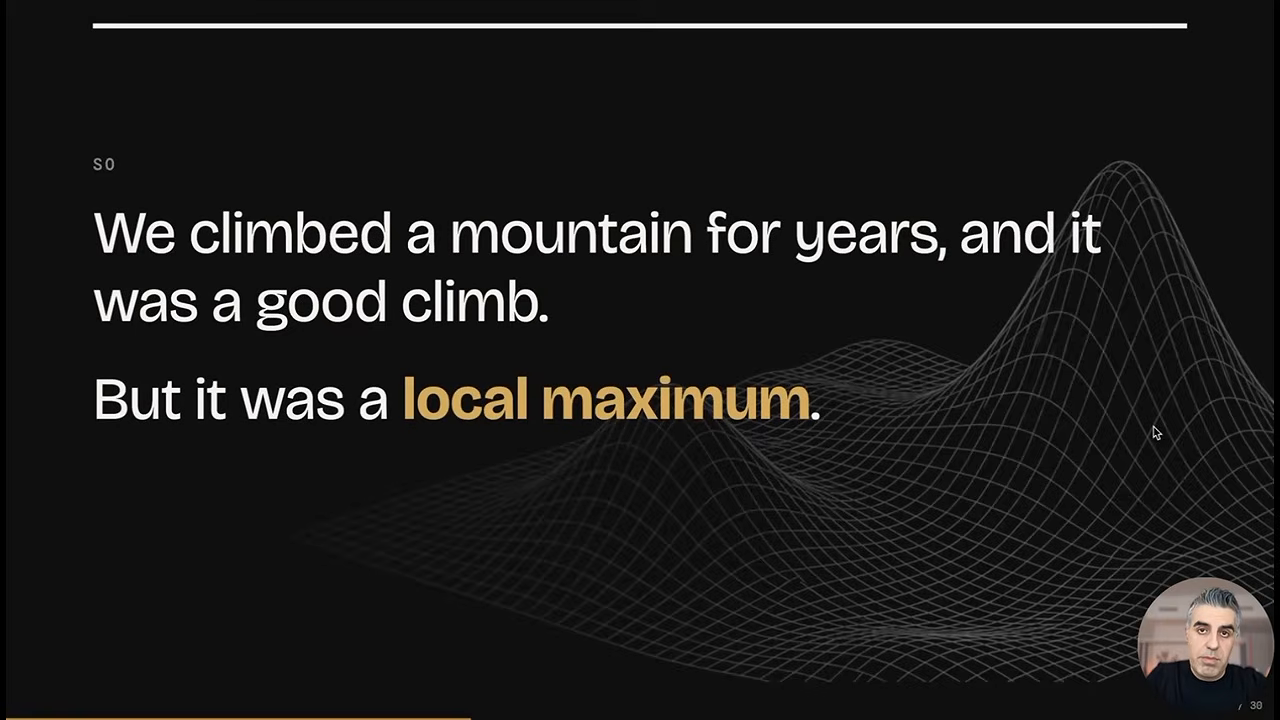
This sentiment reflects a broader market correction. For the past decade, the industry has been at a "local maximum," perfecting the art of working within the constraints of free or low-cost tools. The 2026 shift indicates that the industry has realized that the cost of these constraints—in terms of manual labor, limited insights, and lack of differentiation—now exceeds the cost of building custom solutions.
However, this path is not universal. For small businesses or internal teams with basic reporting needs, legacy tools remain the most efficient choice. The "custom build" movement is specifically targeted at agencies and high-growth companies that view data as a product rather than a utility.
Future Outlook: The End of the "One-Size-Fits-All" Dashboard
As we look toward 2027, the role of the dashboard is being redefined. The traditional static report is being replaced by interactive "data hubs." These hubs do not just display metrics; they act as collaborative environments where AI agents provide context, teams leave annotations, and data flows bidirectionally between the reporting tool and the company’s CRM or project management software.
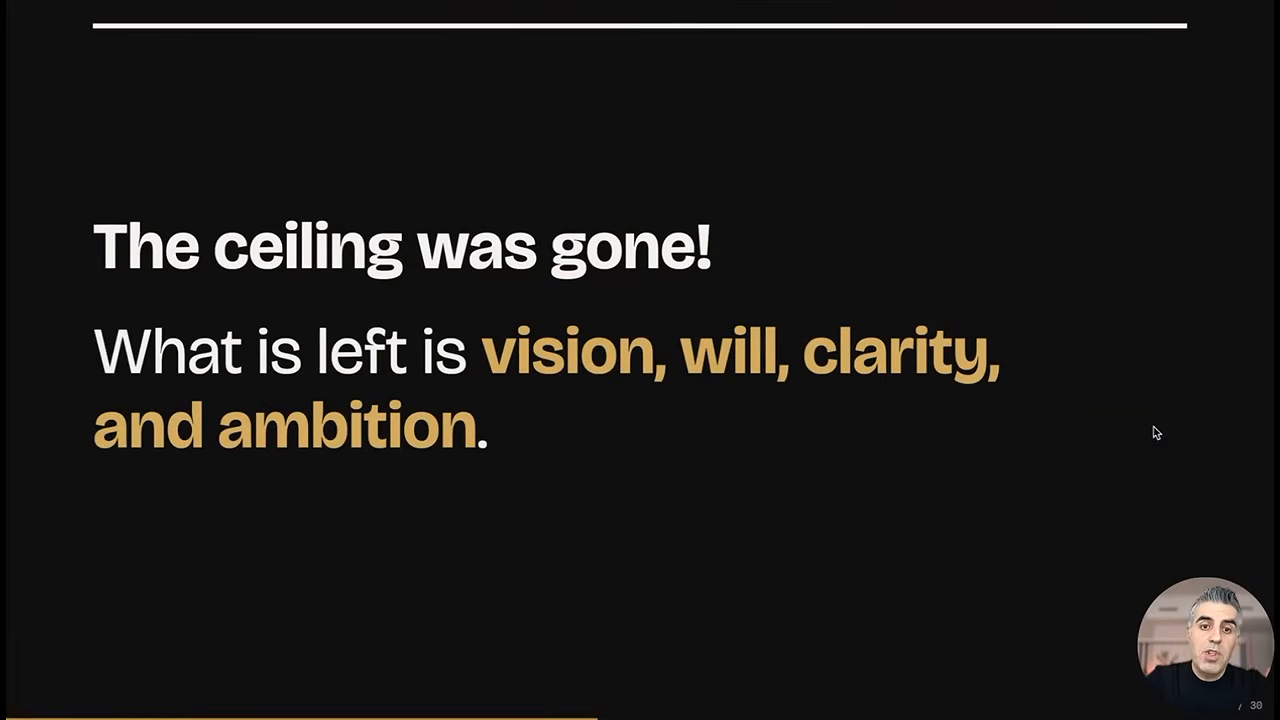
The strategic confusion surrounding Google’s Data Studio has inadvertently accelerated this evolution. By signaling that their tool is for "personal exploration," Google has cleared the way for a new generation of developers to build the professional-grade tools that the market demands. The "ceiling" has not just been raised; for those willing to embrace AI-assisted development, it has been removed entirely.
The final takeaway for the measurement industry is clear: technical infrastructure can be learned, and workarounds are no longer a sustainable business model. The transition from "dashboard builder" to "application architect" represents the next frontier in business intelligence, where the only limit is the clarity of the analyst’s vision and the ambition to build beyond the provided templates.


 Siti Muinah
 Dwi Wanna