
In the high-stakes environment of digital commerce and product development, Conversion Rate Optimization (CRO) teams frequently encounter a statistical phenomenon that can undermine months of experimental labor: the multiple comparison problem. This invisible trap occurs when a team runs an A/B/n test—typically involving one control and several variations—while tracking multiple success metrics simultaneously. A common scenario involves a team observing a p-value of 0.04 on a specific variant, declaring a winner, and deploying the change, only to find that the anticipated revenue never materializes. This failure is often not the result of poor design, but of a fundamental misunderstanding of how cumulative probability affects statistical significance.
The core of the issue lies in the fact that as the number of comparisons increases, the likelihood of encountering a "false positive"—a result that appears statistically significant purely due to random chance—rises exponentially. To combat this, statisticians and data scientists employ various adjustment methods, most notably the Bonferroni correction. This procedure offers a rigorous, albeit conservative, framework for maintaining the integrity of experimental data when multiple hypotheses are tested at once.
The Statistical Foundation of the Multiple Comparison Problem
To understand the necessity of the Bonferroni correction, one must first examine the standard significance threshold used in most industrial experiments. By convention, the significance level, or alpha (α), is set at 0.05, or 5%. This threshold represents the risk an experimenter is willing to accept that a detected difference is actually the result of random noise rather than a true effect. This error is formally known as a Type I error.

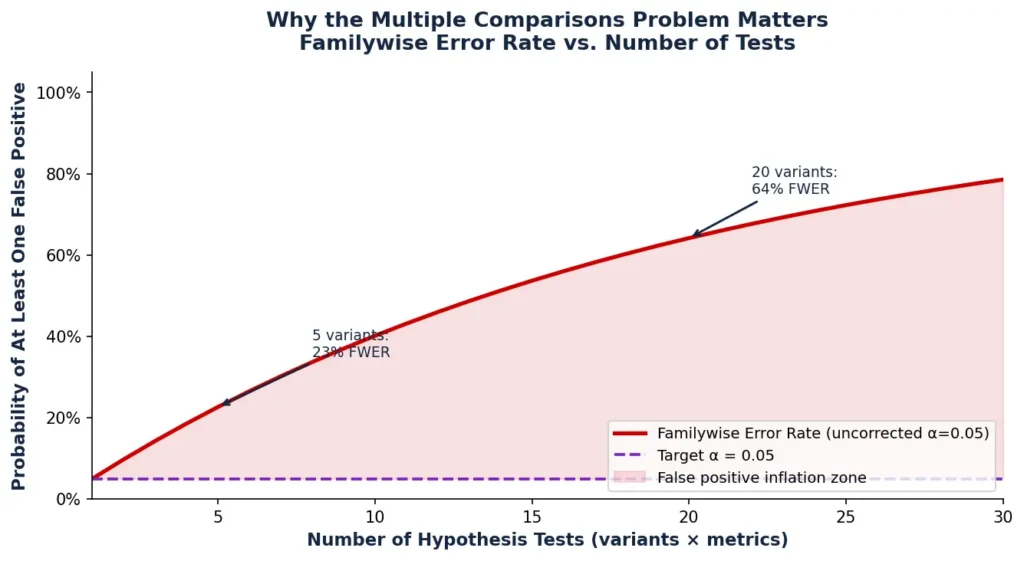
While a 5% risk is generally considered acceptable for a single comparison, the risk does not remain static as more variables are introduced. If a team tracks three metrics across four variants, they are effectively performing 12 separate comparisons. If each comparison is held to a 0.05 threshold, the probability of at least one false positive appearing across the entire "family" of tests—known as the Family-Wise Error Rate (FWER)—climbs to approximately 46%.
The mathematical formula for determining the FWER is:
FWER = 1 – (1 – α)^m
Where ‘m’ represents the total number of independent comparisons.
Data indicates that the risk profile shifts dramatically as the experiment scales. With five comparisons, the FWER is 22.6%; with 10 comparisons, it reaches 40.1%; and with 20 independent comparisons, the probability of a false positive reaches 64.2%. By the time an experimenter reaches 100 comparisons, the appearance of at least one false positive becomes a near-certainty at 99.4%.
The Bonferroni Solution: Mechanism and Application
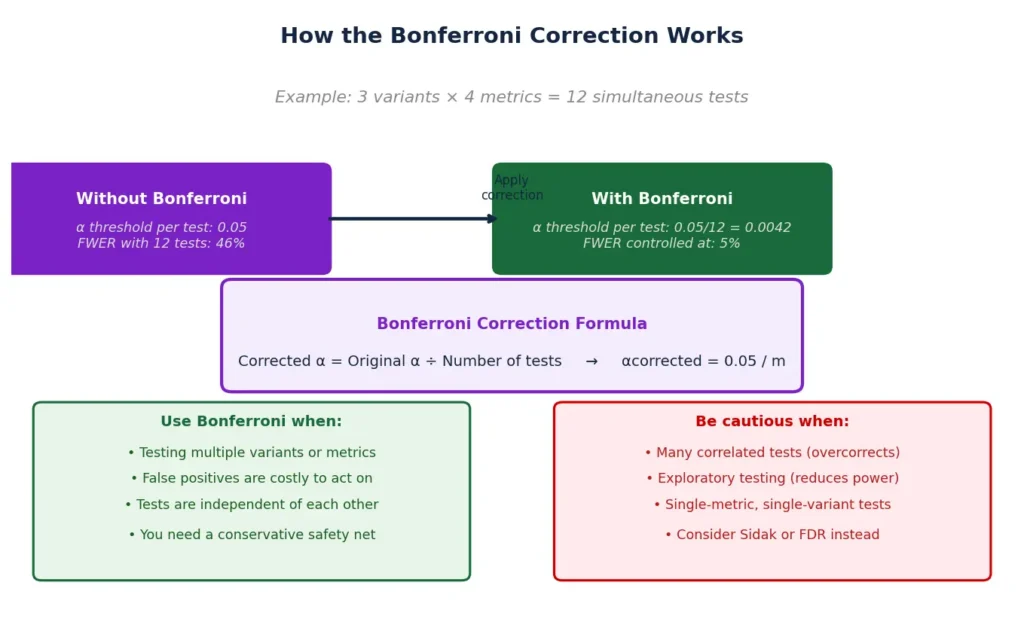
The Bonferroni correction, named after the Italian mathematician Carlo Emilio Bonferroni, provides a straightforward method to counteract this inflation of risk. The logic is simple: if you are testing multiple hypotheses, you must make each individual test harder to pass so that the overall risk of a false positive across the entire experiment remains at the desired alpha (usually 0.05).

The formula for the Bonferroni-corrected alpha is:
α_new = α_original / m
For an experiment comparing three variants against a control across two primary metrics (a total of six comparisons), the math would be:
0.05 / 6 = 0.0083
Under this new threshold, a result is only considered statistically significant if its p-value is less than 0.0083. This drastically reduces the "noise" that can lead to false declarations of success. Alternatively, researchers can adjust the p-values themselves by multiplying the raw p-value by the number of comparisons. If the adjusted p-value remains below 0.05, the result is considered significant.
Chronology of Statistical Rigor in Online Experimentation
The adoption of the Bonferroni correction in digital testing has followed a distinct timeline. In the early 2000s, online A/B testing was largely rudimentary, often focusing on single-variable changes with a single KPI (Key Performance Indicator). As testing platforms became more sophisticated in the 2010s, "multivariate" and "A/B/n" testing became the industry standard.
By 2015, the "Replication Crisis" in social sciences and medicine began to influence the tech industry, highlighting how "p-hacking"—the practice of searching through data for any significant result—led to unreliable product decisions. Consequently, leading experimentation platforms began integrating automated multiple comparison corrections into their reporting dashboards. Today, the use of these corrections is viewed as a hallmark of a "mature" experimentation program, distinguishing professional data science teams from those using more "exploratory" or ad-hoc methods.
Strategic Implications and the Cost of Conservatism
While the Bonferroni correction is highly effective at preventing false positives, it is not without its drawbacks. Its primary criticism is that it is "overly conservative." By making the significance threshold much harder to reach, it increases the risk of Type II errors—false negatives. This means a team might reject a variant that actually provides a real, beneficial effect simply because the evidence wasn’t strong enough to clear the artificially high Bonferroni bar.
This trade-off has significant business implications. In a "confirmatory" mindset—where a company is about to invest millions in a site-wide rollout or a new feature—the Bonferroni correction is essential to avoid costly mistakes. However, in an "exploratory" phase—where the goal is simply to find promising directions for future research—the correction might be too restrictive, stifling innovation by discarding "borderline" winners that could have been refined.
Furthermore, the Bonferroni correction impacts sample size requirements. To achieve statistical power (the ability to detect a true effect) at a threshold of 0.0083 compared to 0.05, an experiment requires a significantly larger volume of traffic. This can extend the duration of a test from weeks to months, creating an "opportunity cost" where the testing pipeline is stalled by a single, high-rigor experiment.
Comparative Analysis: Alternatives to Bonferroni
Recognizing the limitations of the standard Bonferroni method, statisticians have developed several alternatives that balance rigor with sensitivity.
1. The Holm-Bonferroni Method
This is a "step-down" procedure. It ranks p-values from smallest to largest and applies the strictest correction only to the most significant result. If that result passes, the threshold is slightly relaxed for the second result, and so on. This method still controls the FWER but is less likely to produce false negatives than the standard Bonferroni.
2. The Benjamini-Hochberg Procedure
Unlike Bonferroni, which seeks to prevent any false positives, Benjamini-Hochberg controls the False Discovery Rate (FDR). It allows for a small, expected proportion of false positives in exchange for much greater statistical power. This is often preferred in large-scale exploratory testing where the goal is to identify as many potential "leads" as possible.
3. Dunnett’s Test
This is a specialized correction used specifically for A/B/n tests where multiple treatments are compared to a single control. Because it accounts for the fact that all treatments share the same control data, it is more "powerful" (sensitive) than Bonferroni while still strictly controlling the risk of false positives.

Industry Perspectives and Best Practices
Data science leaders at major experimentation platforms emphasize that statistical corrections should not be used in isolation. "The key is intentionality," notes the documentation for several leading A/B testing suites. "You must decide which metrics are ‘primary’ and which are ‘guardrails’ before the test begins."
A common mistake among seasoned testers is applying the Bonferroni correction to every tracked metric, including secondary "health" metrics like page load speed or unsubscribe rates. Industry best practice suggests only applying the correction to the "primary" metrics—the ones that will actually drive the decision to "ship" or "stop." Secondary metrics should be treated as descriptive data rather than part of the formal hypothesis family.
Another critical error is applying corrections to post-hoc segmentation. If a test fails overall, but a team "slices" the data by device, browser, and geography until they find a winning segment, they have introduced a massive multiple comparison problem that a standard Bonferroni correction on the initial variants cannot fix. Such "data dredging" requires its own set of rigorous adjustments or, preferably, a follow-up replication test.
Conclusion: The Future of Data-Driven Rigor
The Bonferroni correction remains a cornerstone of statistical integrity in an era where data-driven decision-making is paramount. As organizations move away from "gut feel" and toward automated experimentation, the risk of being misled by random noise grows. While the method’s conservative nature can be a hurdle for low-traffic websites, its role in preventing expensive, erroneous deployments cannot be overstated.

The evolution of the field suggests a move toward more nuanced models, such as Bayesian experimentation or the False Discovery Rate approach, which offer more flexibility than the rigid Bonferroni formula. However, for any organization seeking to build a culture of reliable, replicable results, understanding and respecting the multiple comparison problem is the first step toward true optimization. Rigor, while sometimes slowing the pace of deployment, ultimately ensures that when a company does move forward, it does so on a foundation of fact rather than a statistical illusion.