The field of digital marketing currently stands at a crossroads where the promise of scientific precision often clashes with the reality of outdated statistical practices. While A/B testing is fundamentally a randomized controlled trial—a methodology shared with physics, genetics, and clinical medicine—the common application of these tests in the corporate world is lagging nearly half a century behind modern biostatistics. As businesses increasingly rely on data to drive revenue, the structural flaws in traditional testing methods have come under intense scrutiny. Analysts argue that the standard "frequentist" approach, which has dominated the industry for decades, is no longer sufficient for the fast-paced, high-stakes environment of modern e-commerce and software development.
The Scientific Disconnect in Digital Experimentation
At its core, an A/B test is designed to establish a causal relationship between a change in a digital asset—such as a website headline or a checkout flow—and a specific user behavior. By randomly assigning users to different variants, marketers aim to eliminate confounding variables. However, the rigor of this process is frequently undermined by a misunderstanding of the mathematical foundations of statistical significance.
Historically, the tools used by digital marketers were adapted from agricultural and physical sciences, where experiments are conducted in highly controlled environments with a fixed beginning and end. In contrast, digital experiments are dynamic. Data arrives in real-time, and stakeholders are often under immense pressure to react to results as they happen. This friction between static mathematical models and dynamic business needs has led to a crisis of reliability in conversion rate optimization (CRO).
The Three Pillars of Statistical Failure
Research into contemporary A/B testing practices identifies three primary areas where traditional methods fail to meet the demands of the modern enterprise.
1. The Perils of Data Peeking and Significance Misuse
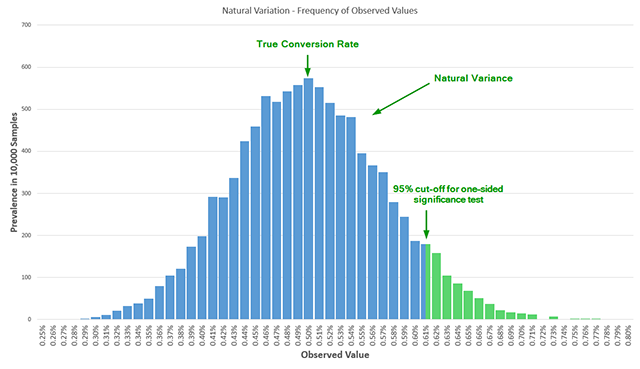
The most pervasive issue in digital testing is the misuse of statistical significance tests, such as the Student’s T-test. A fundamental requirement of these classical tests is that the sample size must be fixed in advance. To maintain the integrity of a p-value—the probability that an observed difference occurred by chance—an analyst must commit to a specific number of observations and perform only one evaluation at the conclusion of the test.
In practice, this rule is almost universally ignored. Marketing teams frequently monitor live dashboards, looking for "confidence" levels to hit 95% before stopping a test. This behavior, known as "data-driven optional stopping" or "peeking," drastically inflates the false positive rate. Statistical experts have noted since as early as 1969 that peeking at data multiple times without adjusting the significance threshold creates an illusory sense of certainty. For example, checking a test’s progress just five times increases the actual error rate by more than three times the nominal value. If a marketer believes they are operating with a 5% risk of a false positive, frequent peeking can quietly push that risk above 15% or 20%, leading companies to implement changes that provide no real benefit or, worse, cause harm.
2. The Neglected Role of Statistical Power
While significance focuses on avoiding false positives (Type I errors), statistical power is concerned with avoiding false negatives (Type II errors). Power, often described as "test sensitivity," is the probability that an experiment will detect a true effect of a certain magnitude.
An analysis of influential A/B testing literature published between 2008 and 2014 revealed a startling trend: only one out of seven major books on the subject provided a proper context for statistical power. The majority of free online calculators and many commercial testing platforms do not allow users to set power levels, often defaulting to a 50% power threshold. This is essentially the equivalent of a coin toss. Running an under-powered test means that even if a new variant is significantly better than the original, the experiment is unlikely to prove it. This results in wasted resources, as teams spend weeks developing features only to discard them because the test lacked the sensitivity to confirm their value.
3. Operational Inefficiency in Classical Models
The third major issue is the inherent rigidity of classical tests. In fields like clinical medicine, it is often considered unethical to continue a trial if a treatment is clearly harming patients or if its benefits are so overwhelming that withholding it from the control group is unjustifiable. Digital marketing faces a parallel economic reality. If a new checkout process is causing a 20% drop in revenue, a business cannot afford to wait three weeks for a "fixed sample" test to conclude. Conversely, if a variant shows an immediate, massive lift, every day spent continuing the test is a day of lost potential revenue. Classical statistical models do not provide a rigorous way to stop these tests early without compromising the data’s validity.
A Chronology of Statistical Evolution
To understand the necessity of the AGILE approach, one must look at the timeline of statistical development:
- 1908: William Sealy Gosset publishes the T-test under the pseudonym "Student," providing the foundation for small-sample significance testing.
- 1930s-1950s: The Frequentist school of statistics, led by Ronald Fisher, Jerzy Neyman, and Egon Pearson, standardizes the "fixed-sample" approach.
- 1969: Statistical literature begins warning of the "multiplicity problem" and the dangers of repeated significance testing on accumulating data.
- 1970s-1990s: Biostatistics evolves rapidly. Sequential analysis and "group sequential trials" become the gold standard for clinical trials, allowing for interim data monitoring.
- 2010s: The digital "Gold Rush" in CRO leads to a proliferation of easy-to-use but statistically flawed A/B testing tools.
- 2017: The AGILE statistical method is formally proposed as a way to integrate biostatistical rigor into the digital marketing workflow.
The AGILE Framework: A Modern Solution
The AGILE statistical approach was developed to reconcile the need for scientific accuracy with the practicalities of business operations. Inspired by the group sequential designs used in medical research, AGILE introduces several key innovations to the A/B testing lifecycle.
Interim Analysis and Error-Spending Functions
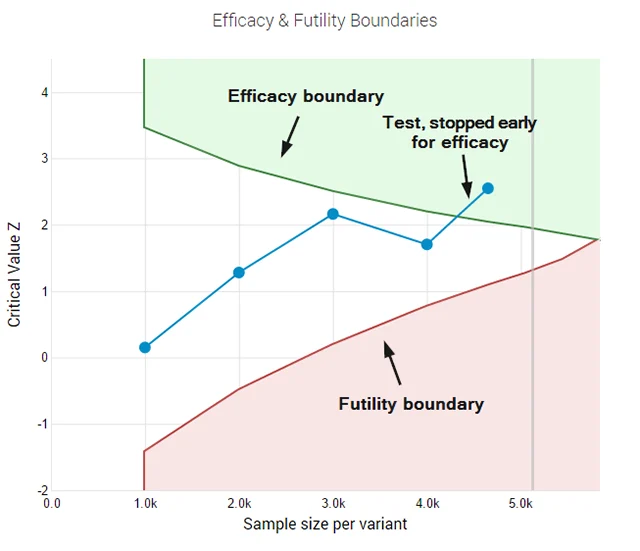
The cornerstone of the AGILE method is the use of "alpha-spending functions." Rather than requiring a single check at the end of a test, AGILE allows for multiple interim analyses. It mathematically "spends" a portion of the allowed error rate at each check. If the data shows an extreme result early on—either very positive or very negative—the test can be stopped with full statistical confidence. This provides the flexibility marketers crave without the "Garbage In, Garbage Out" consequences of unauthorized peeking.
Futility Stopping Rules
One of the most significant advantages of the AGILE method is the "futility" rule. In traditional testing, if a variant is performing exactly like the control, the test must run to its full duration to prove "no difference." AGILE allows for "failing fast." If the data indicates that a variant has a negligible probability of ever reaching the required significance threshold, the test can be terminated early for futility. This allows teams to pivot their resources toward more promising hypotheses much sooner.
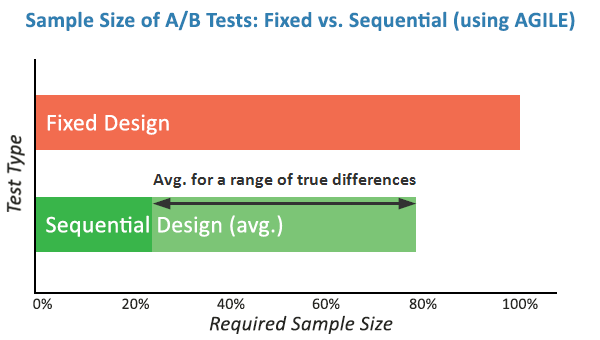
Comparative Data and Efficiency Gains
Simulations and real-world applications of the AGILE method demonstrate substantial improvements in testing velocity. On average, the AGILE approach can reduce the required sample size by 20% to 80%, depending on the actual performance of the variant.
| Scenario | Classical Fixed-Sample | AGILE Approach | Efficiency Gain |
|---|---|---|---|
| Strong Winner | 100,000 users | 20,000 – 40,000 users | 60% – 80% |
| Moderate Winner | 100,000 users | 60,000 – 80,000 users | 20% – 40% |
| Clear Loser | 100,000 users | 15,000 – 30,000 users | 70% – 85% |
| Futility (No Effect) | 100,000 users | 50,000 – 70,000 users | 30% – 50% |
These gains are not merely theoretical; they represent a fundamental shift in how organizations allocate their experimentation budgets. By reaching conclusions faster, a company can run more tests per year, effectively increasing their "velocity of learning."
Industry Implications and the Road Ahead
The transition to more robust statistical methods like AGILE signals a maturation of the digital marketing industry. For years, "data-driven" was a buzzword that often masked sloppy analytical habits. As privacy regulations like GDPR and CCPA limit the amount of data available for tracking, the efficiency and accuracy of the remaining data become paramount.
Industry experts suggest that the adoption of AGILE-like frameworks will lead to a "professionalization" of the CRO role. Data scientists and analysts are increasingly expected to understand the nuances of sequential testing and power analysis. Furthermore, software providers in the A/B testing space are beginning to update their back-end algorithms to move away from simple T-tests toward more sophisticated sequential or Bayesian models.
The broader impact of this shift is an increase in the ROI of experimentation. When false positives are reduced, companies stop wasting money on "ghost wins"—features that appear to work in a test but fail to move the needle in the real world. When testing efficiency increases, the cost per experiment drops, allowing for a more aggressive exploration of innovative ideas.
Ultimately, the AGILE statistical approach represents the alignment of digital practice with scientific reality. It acknowledges that in the world of online commerce, time is a finite resource, and certainty is a mathematical discipline. By adopting the rigors of biostatistics, the digital marketing community can finally claim the scientific mantle it has long sought, turning A/B testing from a game of chance into a precise engine for growth.