In the competitive landscape of digital optimization, A/B testing tools serve as the primary mechanism for determining which website or application variations perform most effectively. However, a growing consensus among data scientists and conversion rate optimization (CRO) specialists suggests that while tools can identify a "winner," they often fail to communicate whether a result is statistically robust enough to justify long-term strategic pivots. The integrity of an experiment rests not merely on the data collected, but on the rigor of the analysis applied to that data.
This comprehensive guide examines the methodologies required to accurately interpret A/B test results using a combination of free analytical tools and advanced statistical frameworks. By adhering to a structured analytical process, organizations can mitigate the risks of "false positives" and ensure that their optimization efforts translate into genuine commercial growth.
The Statistical Foundation of Modern Experimentation
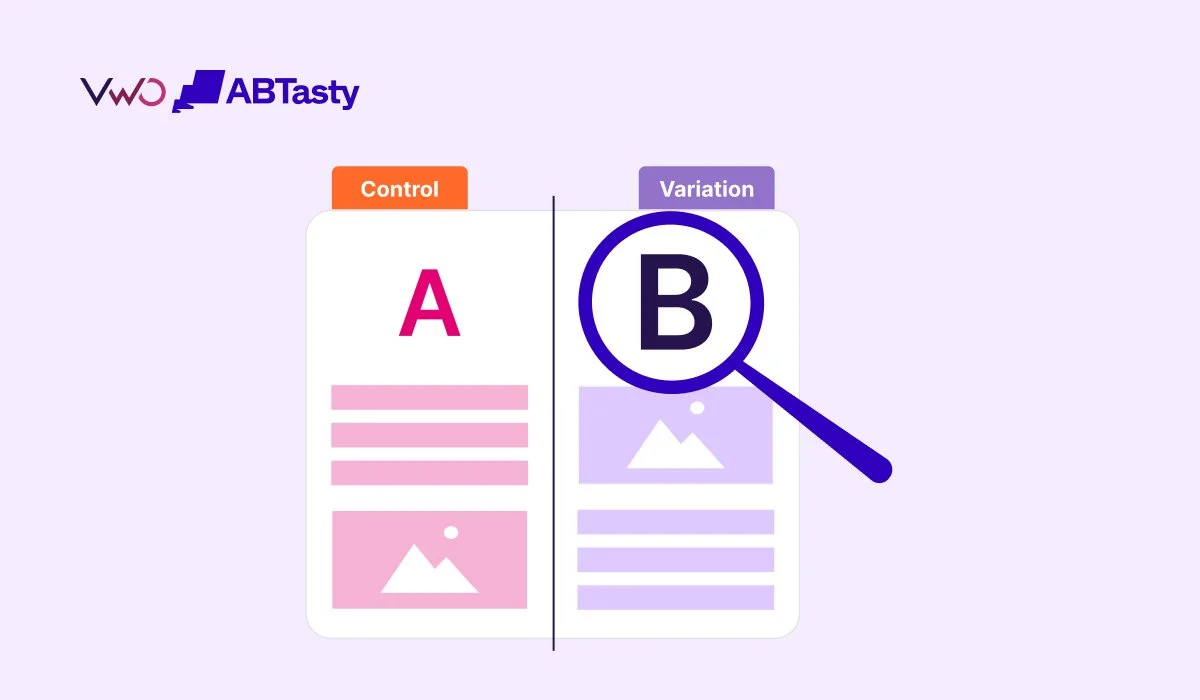
A/B testing, at its core, is an application of statistical hypothesis testing. Users are partitioned into two groups: a control group (Version A) and a variant group (Version B). The objective is to determine if a specific change—be it a call-to-action color, a pricing structure, or a user interface layout—results in a statistically significant improvement in a predefined metric.
Historically, the digital marketing industry relied heavily on Frequentist statistics. This model requires a fixed sample size determined before the test begins. Under this framework, significance is only checked once the target number of visitors is reached. However, modern digital environments are fluid, leading many teams to adopt Bayesian statistics. Bayesian models, utilized by platforms such as Wingify’s VWO, offer a "probability of being best," which many practitioners find more actionable than the traditional p-value.
The Chronology of a Rigorous A/B Test
To maintain data integrity, a standardized timeline must be followed:
- Pre-Test Planning: Defining the Minimum Detectable Effect (MDE) and calculating the required sample size.
- Deployment: Launching the experiment with a clean 50/50 or predetermined traffic split.
- Monitoring: Checking for technical anomalies, such as Sample Ratio Mismatch (SRM), without "peeking" for significance.
- Post-Test Analysis: Evaluating the primary metric, segmenting data, and documenting findings.
A Seven-Step Framework for Accurate Analysis
For teams utilizing free tools like Google Analytics 4 (GA4), Evan Miller’s calculators, or basic spreadsheets, the following seven-step methodology is essential for ensuring accuracy.
Step 1: Metric Selection and Lockdown
One of the most frequent errors in experimentation is "post-hoc metric switching." This occurs when a team fails to see a lift in their primary metric (e.g., purchases) and instead searches for any secondary metric (e.g., button clicks) that shows a positive result. To prevent this, the primary, secondary, and guardrail metrics must be locked before the test goes live. Guardrail metrics are particularly vital; they ensure that an improvement in one area does not cause a detrimental collapse in another, such as increasing sign-ups at the cost of long-term retention.
Step 2: Verification of Sample Size and Duration
Before reviewing conversion data, analysts must verify that the experiment has reached its "power." Using tools like the Evan Miller Sample Size Calculator, teams can determine if their visitor count is sufficient to detect the MDE. Furthermore, tests should ideally run for at least one full business cycle—typically seven to 14 days. This accounts for temporal fluctuations, such as differing user behaviors on weekends versus weekdays.
Step 3: Data Extraction and Structuring
Data must be pulled from a reliable tracking source, such as GA4, and structured cleanly. This involves isolating unique visitors (sessions) and goal completions (conversions) for each variant. Analysts recommend organizing this into a simple matrix: Variant Name, Unique Visitors, Conversions, and Conversion Rate. This raw data serves as the input for any subsequent significance testing.
Step 4: Quality Control and SRM Detection
Sample Ratio Mismatch (SRM) is a critical data quality issue where the actual traffic split differs significantly from the intended split. If a test is set for 50/50 but results in a 55/45 split, it often indicates a technical bug in the testing script or a bias in how users are being assigned to variations. Results from a test with SRM are fundamentally unreliable and should be discarded.
Step 5: Statistical Confidence Assessment
Once the data is verified, it should be processed through a significance calculator. For high-stakes decisions, a 95% confidence level is the industry standard. This means there is only a 5% chance that the observed lift is due to random noise. For lower-risk experiments, such as minor aesthetic changes, a 90% confidence level may be acceptable.
Step 6: Data Segmentation
Aggregate data can often be deceptive. A variant that appears to be a "winner" overall may actually be underperforming on mobile devices or among returning visitors. By segmenting results by device type, acquisition channel, and user geography, teams can uncover deeper insights and potentially personalize the experience for different cohorts.
Step 7: Documentation and Institutional Knowledge
Every test, whether a win, loss, or "null" result (inconclusive), provides valuable data. Documenting the hypothesis, the variant descriptions, and the final statistical output prevents future teams from repeating the same failed experiments. It builds a repository of "what works" for a specific audience.
The Technical Toolset: Free vs. Enterprise Solutions
While enterprise platforms offer end-to-end automation, a "manual" stack of free tools can be equally effective if managed with discipline.
- Evan Miller’s Calculator: The gold standard for pre-test power analysis and post-test frequentist significance checking.
- Google Analytics 4 (GA4): While not a testing tool per se, GA4 is the premier free resource for data collection and deep segmentation. By using custom dimensions to flag which variant a user saw, analysts can build "Exploration" reports to compare performance.
- AB Testguide & Wingify Calculators: These browser-based tools allow for quick Bayesian or Frequentist analysis of raw conversion numbers.
- Google Sheets/Excel: Essential for trend visualization. Line charts can reveal if a variant’s performance was stable throughout the test or if it benefited from a one-day anomaly.
Addressing the "Peeking" Problem
A common pitfall in A/B testing is the "peeking problem." In classical Frequentist statistics, if an analyst checks the results every day and stops the test the moment it hits 95% significance, the actual "Type I" error rate (false positive rate) increases dramatically. What appears to be 95% confident may, in reality, be closer to 70% or 80%.
To combat this, modern experimentation theory suggests the use of Bayesian sequential testing. This approach, utilized in premium engines like Wingify’s SmartStats, allows for continuous monitoring without inflating error rates. It uses the "Region of Practical Equivalence" (ROPE) to determine if a difference is not just statistically significant, but commercially meaningful.
Industry Perspectives and Expert Analysis
Jared Brown, a prominent figure in the experimentation space, cautions against the rush to declare winners. "A common mistake I’ve observed is not giving tests enough time to run or basing decisions on insufficient data," Brown stated. "This can lead to premature conclusions that aren’t statistically significant, potentially steering strategies in the wrong direction. The goal is gathering insights for long-term innovation, not just short-term metric bumps."
Market analysts suggest that as the cost of customer acquisition (CAC) continues to rise, the importance of precise A/B testing increases. A 2% lift in conversion rate can represent millions of dollars in incremental revenue for enterprise-scale e-commerce sites. Conversely, implementing a "false winner" can lead to a "flattening" of the baseline, where the predicted gains never materialize in the actual profit and loss statements.
Implications for Digital Strategy
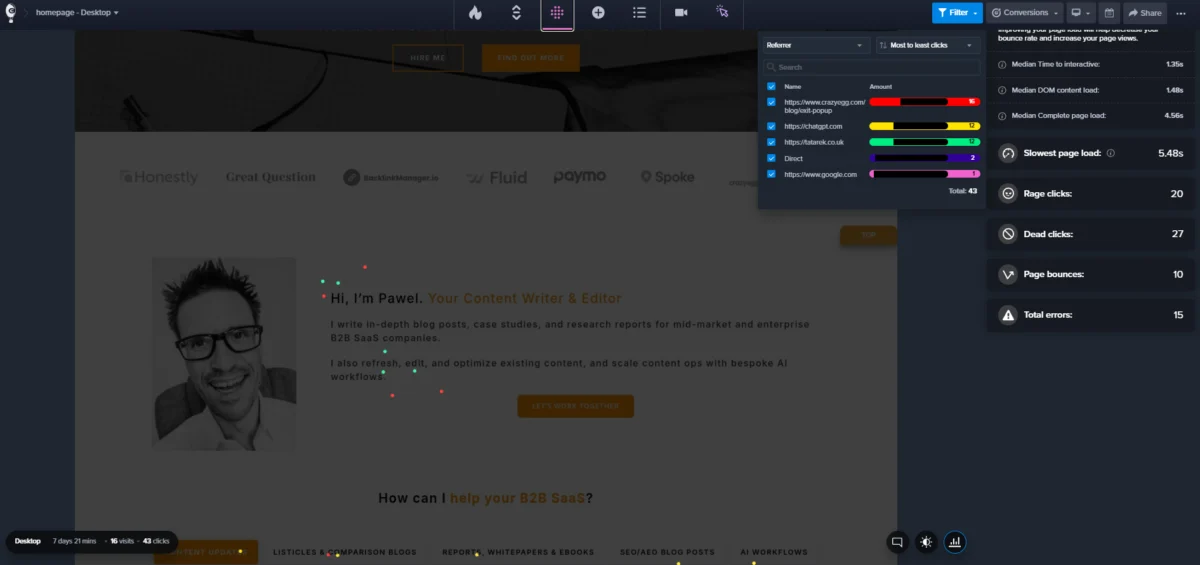
The transition from "gut-feeling" design to data-driven experimentation represents a significant shift in corporate culture. However, the reliance on free tools requires a higher degree of internal expertise. Organizations must decide whether to invest in the manual labor required to "stitch together" GA4, spreadsheets, and calculators, or to invest in integrated platforms that automate the full loop of setup, behavioral analysis (heatmaps/recordings), and statistical monitoring.
In conclusion, A/B testing is a powerful tool for digital growth, but its value is entirely dependent on the integrity of the analysis. By locking metrics, verifying sample sizes, detecting SRM, and avoiding the peeking problem, even teams with limited budgets can conduct world-class experiments. The way forward for most organizations involves starting with free tools to validate early hypotheses and eventually migrating to integrated Bayesian systems as the volume and complexity of their testing programs scale.