In the current digital landscape, where user experience (UX) and conversion rate optimization (CRO) dictate the success of multi-billion dollar enterprises and small startups alike, A/B testing has emerged as a fundamental pillar of data-driven decision-making. However, a significant gap remains between merely running an experiment and deriving actionable, statistically sound insights from it. While a variety of free A/B testing tools can indicate which variation performed better on a surface level, they often lack the sophisticated analytical frameworks required to determine if a result is robust enough to justify long-term strategic shifts. The integrity of an experiment depends not on the raw numbers themselves, but on the rigor with which those numbers are analyzed.
The Foundation of Modern Experimentation Analysis
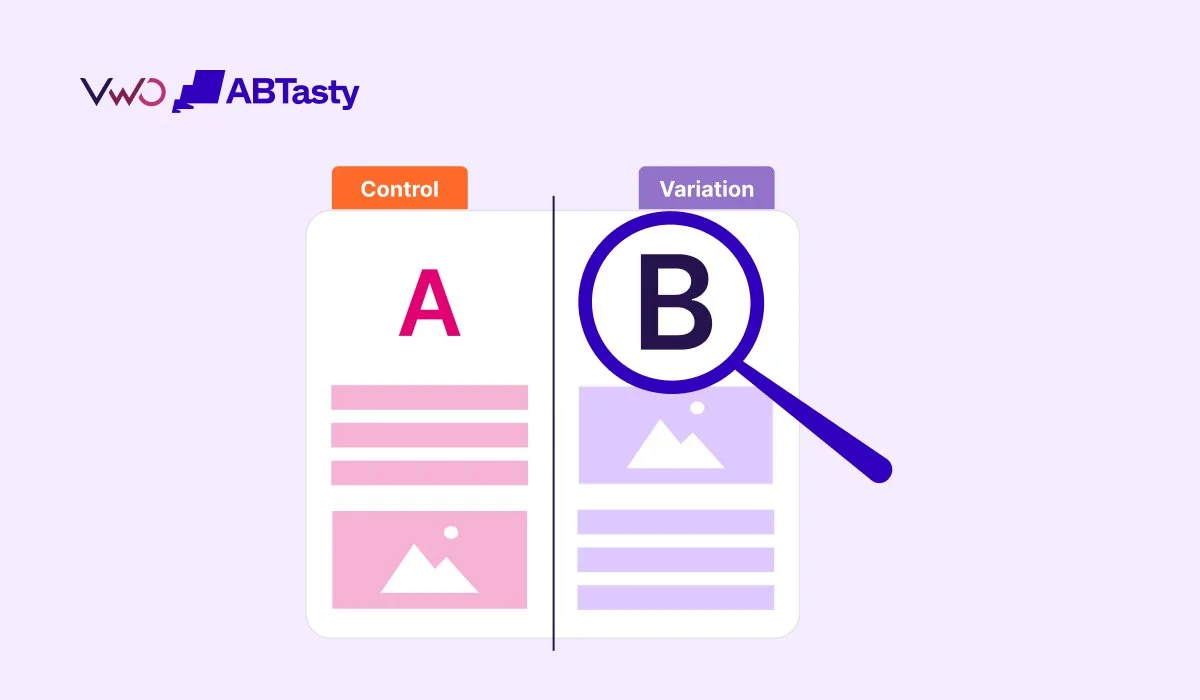
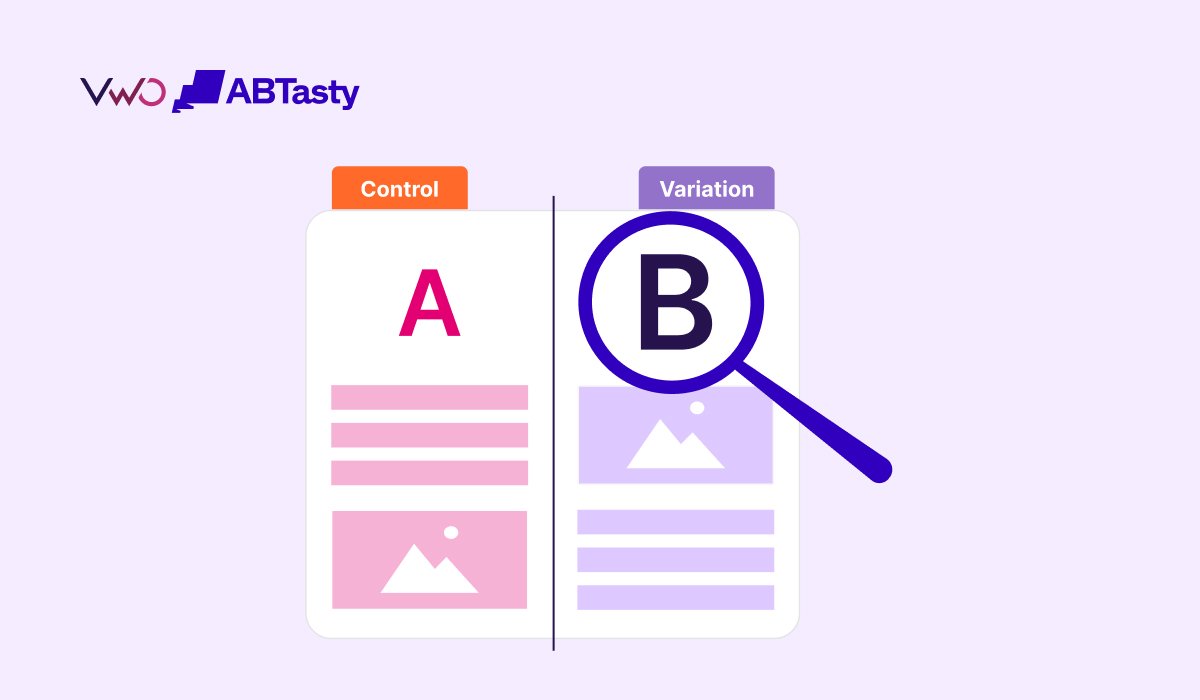
A/B testing, at its core, is a method of comparing two versions of a digital asset—be it a webpage, a marketing email, or a mobile app feature—to determine which one achieves a specific goal more effectively. Users are split into a Control group, which sees the original version, and a Variant group, which interacts with the modified version. The primary challenge for modern marketing and product teams is the "noise" within the data. Statistical significance, sample size, and the duration of the test are the primary guards against making decisions based on random fluctuations rather than actual user preference.
Industry experts, including Jared Brown, emphasize that the most common failure in experimentation is the "premature conclusion." Decisions based on insufficient data or tests that are terminated too early can lead to "false wins," where a variant appears to perform better in the short term but fails to sustain those gains once implemented site-wide. The goal of rigorous analysis is to ensure that the "lift" observed during the test is a true representation of future performance.
The Chronology of a Valid A/B Test Workflow
To achieve accuracy without the use of high-cost enterprise software, teams must adhere to a strict chronological workflow. This process ensures that the data collected is both clean and representative.
Phase 1: Pre-Test Configuration and Metric Locking
Before a single visitor is directed to a variant, the primary metric for success must be finalized. In the experimentation world, "post-hoc metric switching"—the practice of changing the success criteria after seeing the results—is considered a major breach of scientific integrity. This phase involves defining three types of metrics:
- Primary Metrics: The main goal, such as conversion rate or revenue.
- Secondary Metrics: Supporting data, such as click-through rates or time on page.
- Guardrail Metrics: Indicators used to ensure that the variant isn’t causing unintended harm, such as an increased bounce rate or a spike in customer support queries.
Phase 2: Sample Size and Power Calculation
Using tools like Evan Miller’s sample size calculator, analysts must determine the "Minimum Detectable Effect" (MDE). This calculation tells the team exactly how many visitors are needed to prove that a specific percentage of change is not due to chance. A test run with a sample size that is too small lacks "statistical power," meaning it may fail to detect a real improvement or, conversely, suggest a win where none exists.

Phase 3: The Execution Window
A standard A/B test should typically run for at least one to two full business cycles (usually 7 to 14 days). This duration accounts for the natural variance in user behavior between weekdays and weekends. For instance, an e-commerce site may see high browsing on Sundays but high conversion on Tuesdays; ending a test on a Monday would capture a skewed view of the user base.
Technical Data Quality and the Sample Ratio Mismatch (SRM)
One of the most critical, yet often overlooked, steps in A/B test analysis is the verification of data quality. Before interpreting the "winner," analysts must check for Sample Ratio Mismatch (SRM). If a test is configured to split traffic 50/50 between the Control and the Variant, the final visitor counts should reflect that split within a narrow margin of error.
If the Control receives 10,000 visitors and the Variant receives 9,200, there is a high probability of a technical error in the traffic allocation. This discrepancy can be caused by various issues, such as the Variant page loading slower than the Control, leading to "flicker" or users bouncing before the tracking script fires. Results from an experiment with a significant SRM are mathematically tainted and should be discarded, as the groups are no longer comparable.
Statistical Models: Frequentist vs. Bayesian Approaches
The methodology of the analysis itself is a subject of significant debate within the data science community. Most free calculators use the Frequentist approach, which relies on p-values to determine if a result is statistically significant. The primary limitation of this model is the "peeking problem." In a Frequentist model, the significance is only valid if checked once at the end of a fixed sample size. If a team "peeks" at the results daily and stops the test as soon as it hits 95% significance, the actual confidence level may be as low as 70%.
In contrast, the Bayesian sequential testing model, utilized by more advanced platforms like VWO and AB Tasty, offers a more modern alternative. Bayesian statistics provide the "probability of being better," updating the result continuously as more data flows in. This model is more intuitive for business leaders, as it answers the question: "What is the likelihood that the Variant will outperform the Control?" rather than the more abstract Frequentist question: "How unlikely is it that this result occurred by chance?"
Detailed Analysis of Key Performance Metrics
A comprehensive analysis requires looking beyond the headline conversion rate. Different experiments necessitate different success indicators:
- Revenue Per Visitor (RPV): Particularly vital for e-commerce, RPV ensures that a variant increasing the number of transactions isn’t simultaneously lowering the average order value (AOV).
- Funnel Drop-off Rate: By analyzing multi-step flows (e.g., a checkout process), teams can identify exactly where friction exists. If a variant improves the "Add to Cart" rate but increases the "Shipping Info" drop-off, the overall impact might be neutral or negative.
- Engagement Time: In GA4 (Google Analytics 4), "Engagement Time" has replaced traditional "Time on Page." This metric filters out idle tabs, providing a more accurate measure of how long a user is actively interacting with the content.
- Add-to-Cart Rate: This serves as a "leading indicator" for purchase intent. In tests where the final conversion (purchase) takes too long to reach statistical significance, the add-to-cart rate can provide an earlier signal of success.
The Role of Segmentation in Deep-Dive Analysis
Aggregate results can often be deceptive. A variant that appears to be a "loser" overall might actually be a massive "winner" for a specific subset of the audience. Sophisticated analysis involves segmenting the data by:
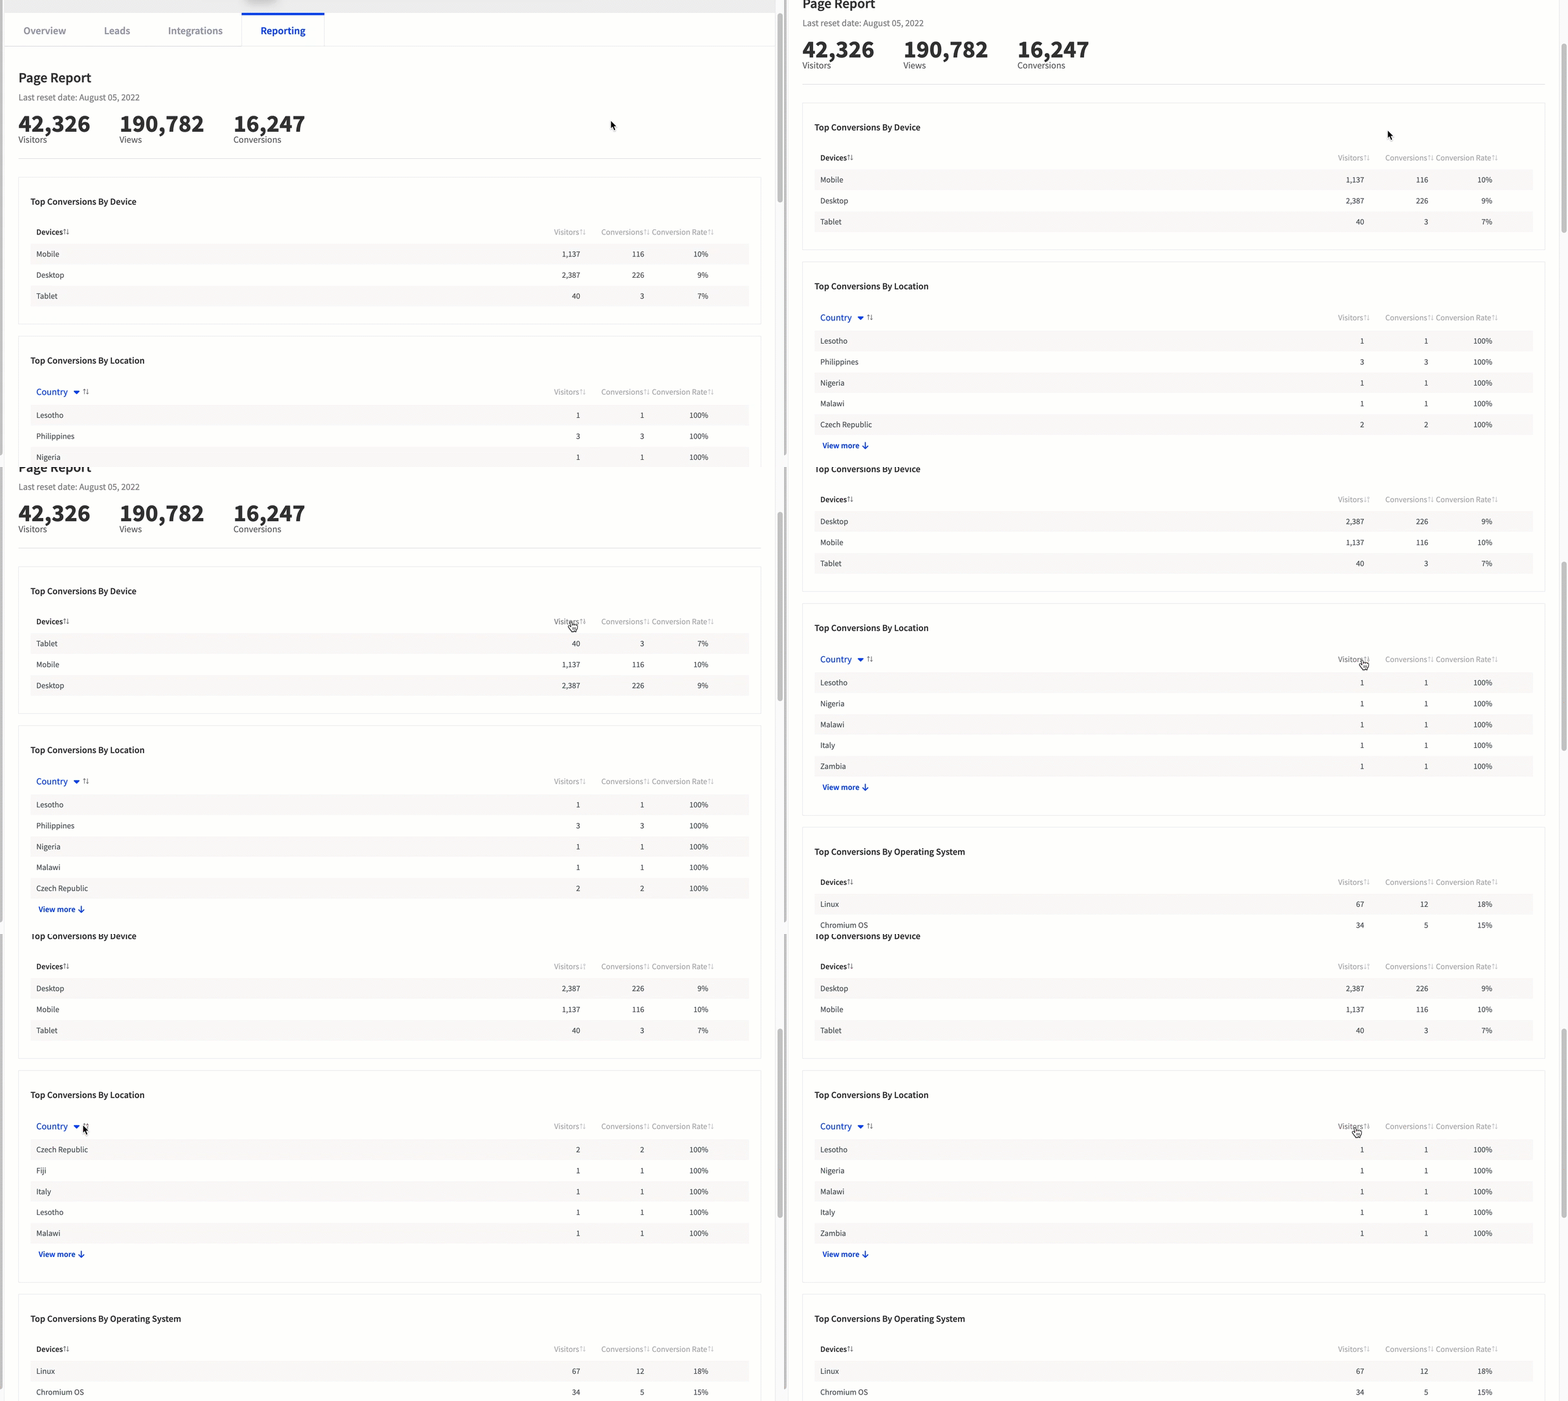
- Device Type: Mobile vs. Desktop. A new UI might be highly effective on a large screen but unusable on a smartphone.
- Traffic Source: Users arriving from an organic search may behave differently than those arriving from a paid social media ad.
- User Type: New visitors may be more receptive to a "first-time discount" pop-up, while returning customers may find it intrusive.
By identifying these segments, businesses can implement "personalization" strategies, showing different versions of a site to different user groups based on their proven preferences.
Documentation and Institutional Knowledge
The final step of the analysis process is documentation. Every experiment—whether it results in a win, a loss, or an inconclusive result—contributes to the company’s institutional knowledge. A well-maintained "Experiment Library" should record the original hypothesis, the variant descriptions, the confidence levels, and the specific segments that were analyzed.
Documenting "null results" (where no significant difference was found) is arguably as important as documenting wins. It prevents future teams from wasting resources on the same failed hypotheses and helps refine the understanding of what truly drives user behavior for that specific brand.
Broader Implications and Future Outlook
As the industry moves away from deprecated tools like Google Optimize, the reliance on manual analysis using GA4 and external calculators has increased. This transition highlights the necessity for higher data literacy among marketing professionals. While free tools are sufficient for validating early-stage ideas, the scalability of an experimentation program eventually requires integrated platforms. These platforms reduce manual overhead by combining behavioral insights (like heatmaps and session recordings) with statistical engines.
Ultimately, the accuracy of A/B test results is the bedrock of a successful digital strategy. In an era where customer acquisition costs are rising, the ability to accurately interpret user data is not just a technical skill—it is a competitive necessity. Organizations that master the nuances of sample size, SRM, and Bayesian analysis will consistently outperform those that rely on "gut feeling" or surface-level metrics. The future of the web is being built one experiment at a time, and the integrity of those experiments determines who leads the market.