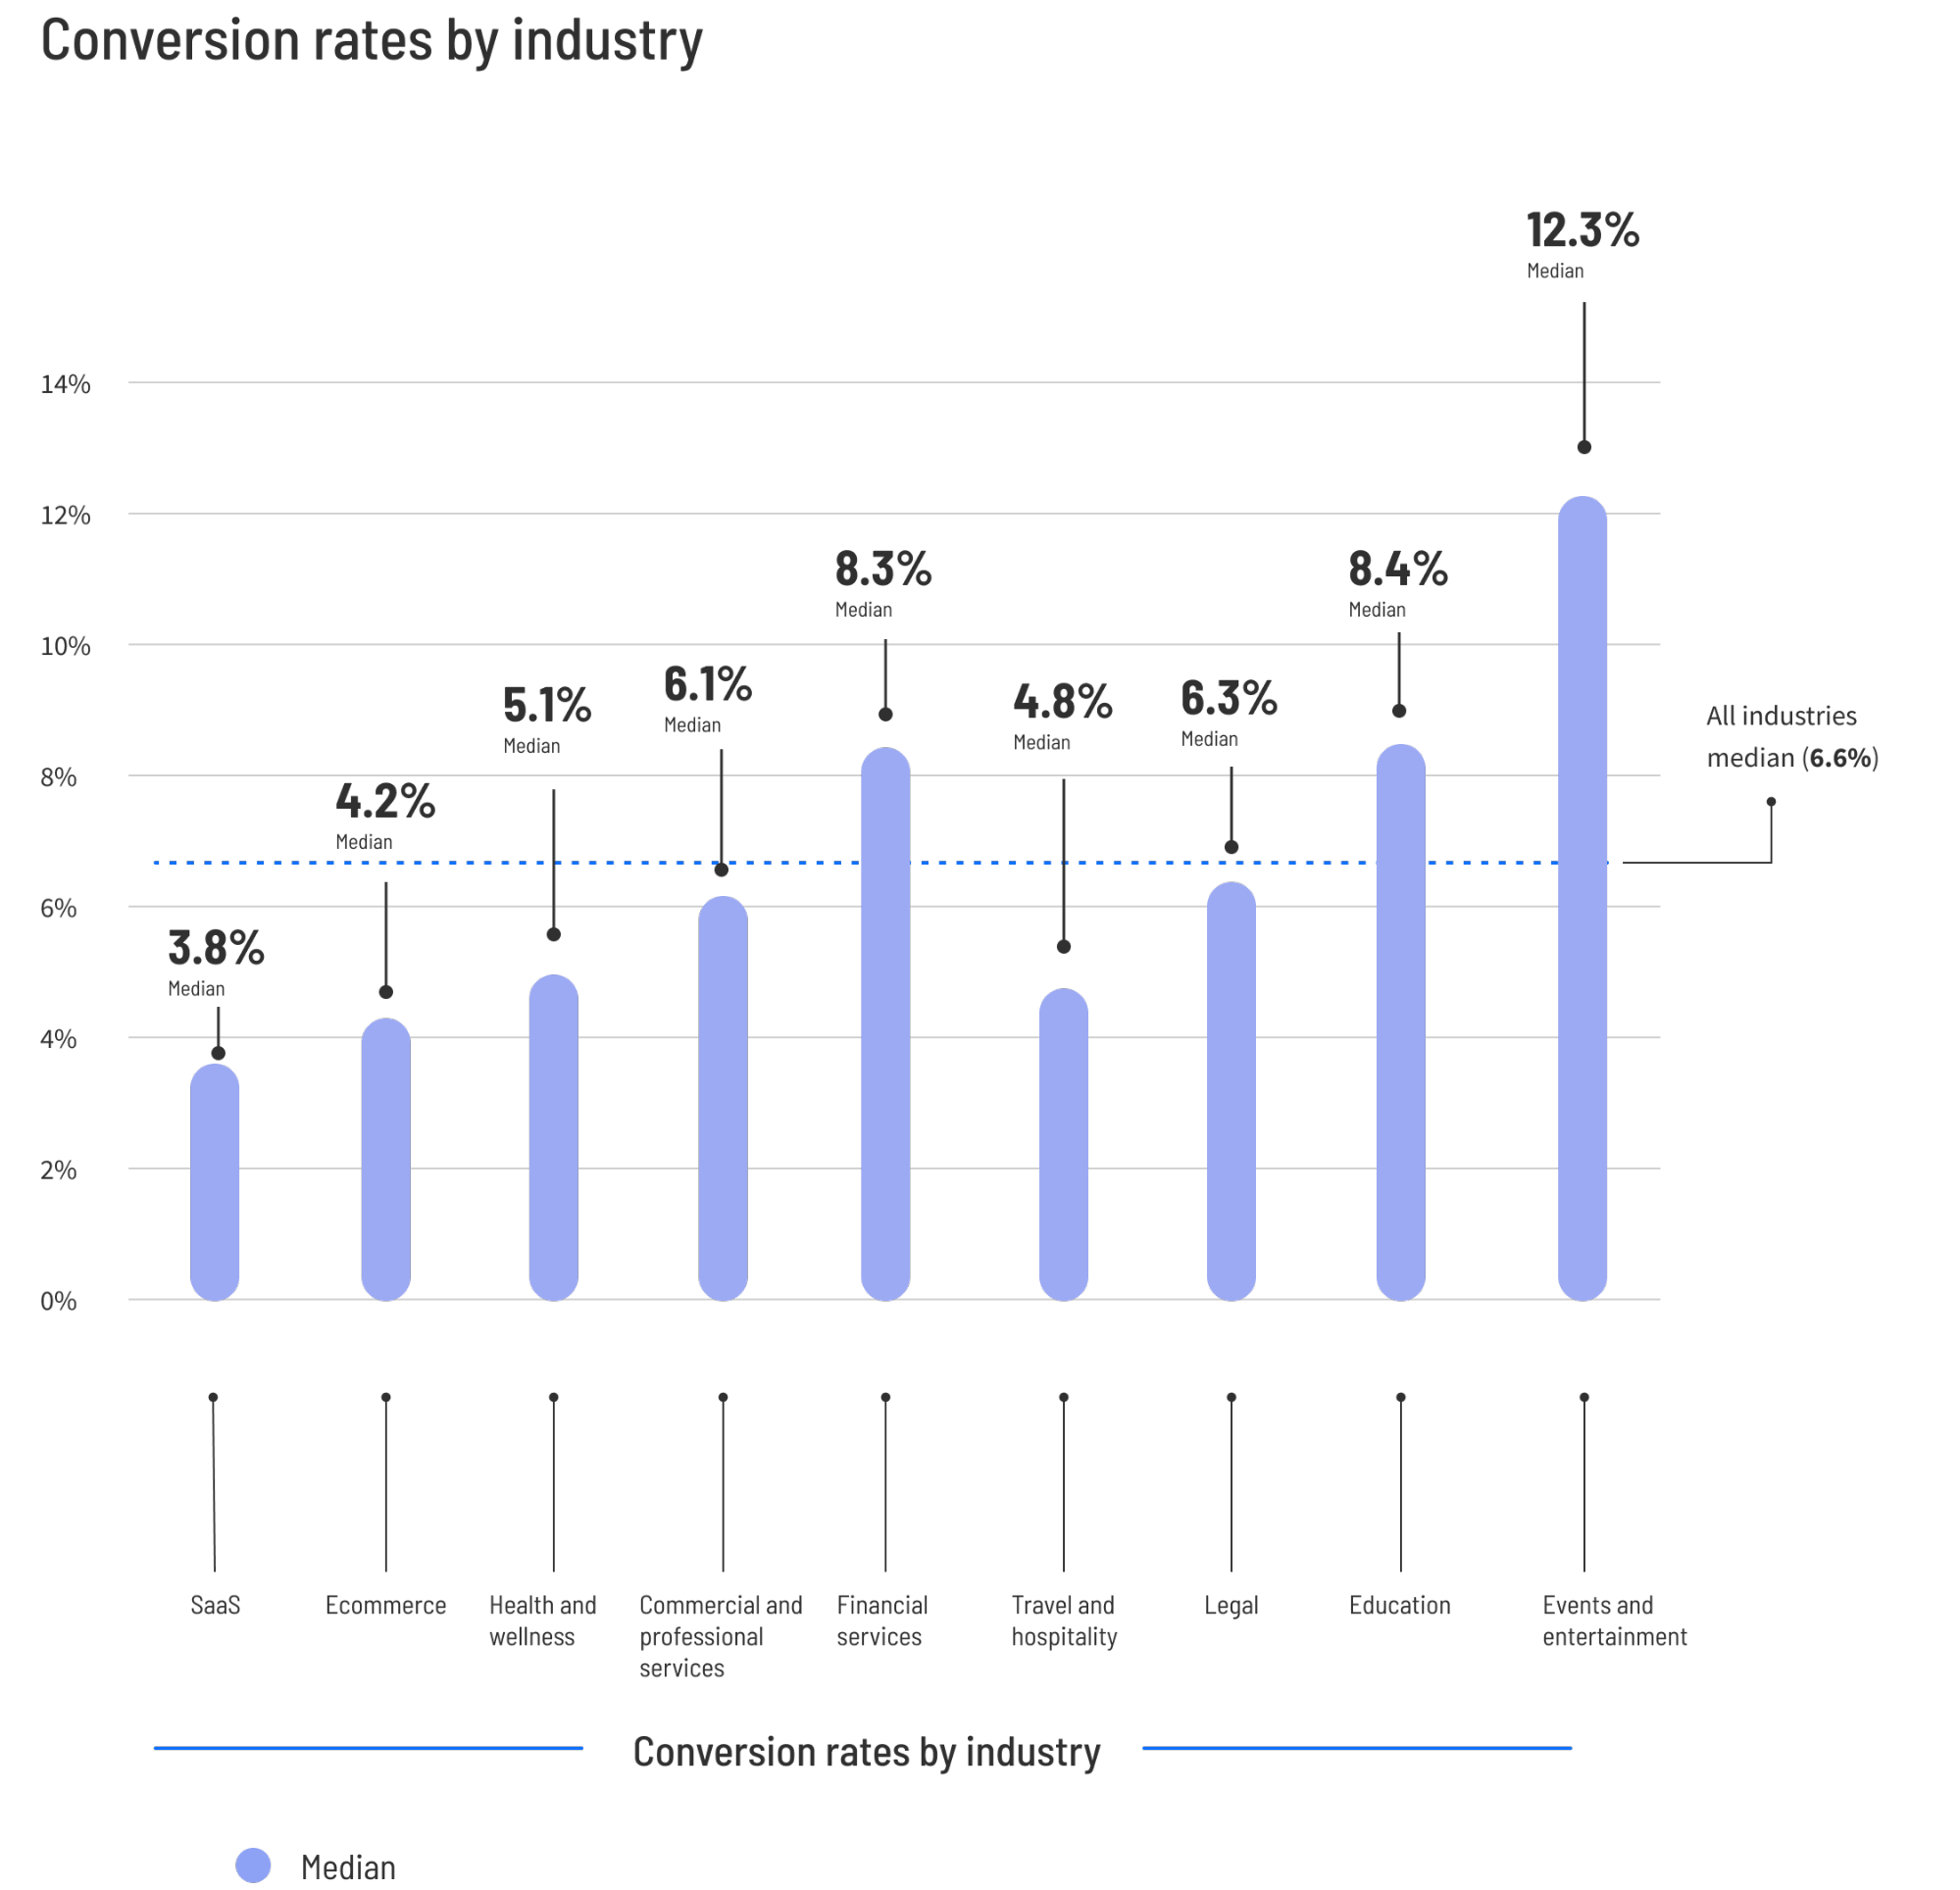
The digital marketing landscape in 2024 continues to be defined by a tightening of advertising budgets and an increased scrutiny of return on investment (ROI). According to the latest data released in the 2024 Conversion Benchmark Report, the median conversion rate for landing pages across all major industries currently stands at 6.6%. This figure, derived from an extensive analysis of over 57 million conversions across 41,000 landing pages and 464 million unique pageviews, serves as the primary baseline for marketers seeking to evaluate the efficacy of their lead generation and sales funnels. However, experts note that "average" performance is rarely a sufficient target in a competitive digital economy where top-tier performers—those in the 75th percentile—consistently achieve conversion rates ranging from 11.4% to as high as 40.8%.

The Statistical Foundation: Median vs. Average Performance
To understand the 2024 benchmarks, it is essential to distinguish between the "average" and the "median" conversion rates. In large datasets, averages can be significantly skewed by "unicorn" pages—outliers that achieve 90% conversion rates through hyper-specific, low-volume campaigns—or by failing pages that record near-zero performance. The median represents the true middle of the market, offering a more realistic comparison for the typical business.
The shift toward median-based reporting reflects a broader movement in data science to provide actionable insights rather than inflated metrics. As digital noise increases, the ability of a brand to convert 6.6% of its traffic into leads or customers signifies a healthy, stable operation. Moving beyond this baseline into the "good" territory of 11.4% or higher requires a sophisticated understanding of industry-specific nuances, user intent, and psychological triggers.

Industry-Specific Benchmarks: A Comparative Overview
Conversion rates are heavily dictated by the nature of the product or service being offered. High-consideration purchases, such as enterprise software or luxury home renovations, naturally exhibit lower conversion rates than low-friction actions, such as entering a sweepstakes or signing up for a free newsletter.
Ecommerce and Retail
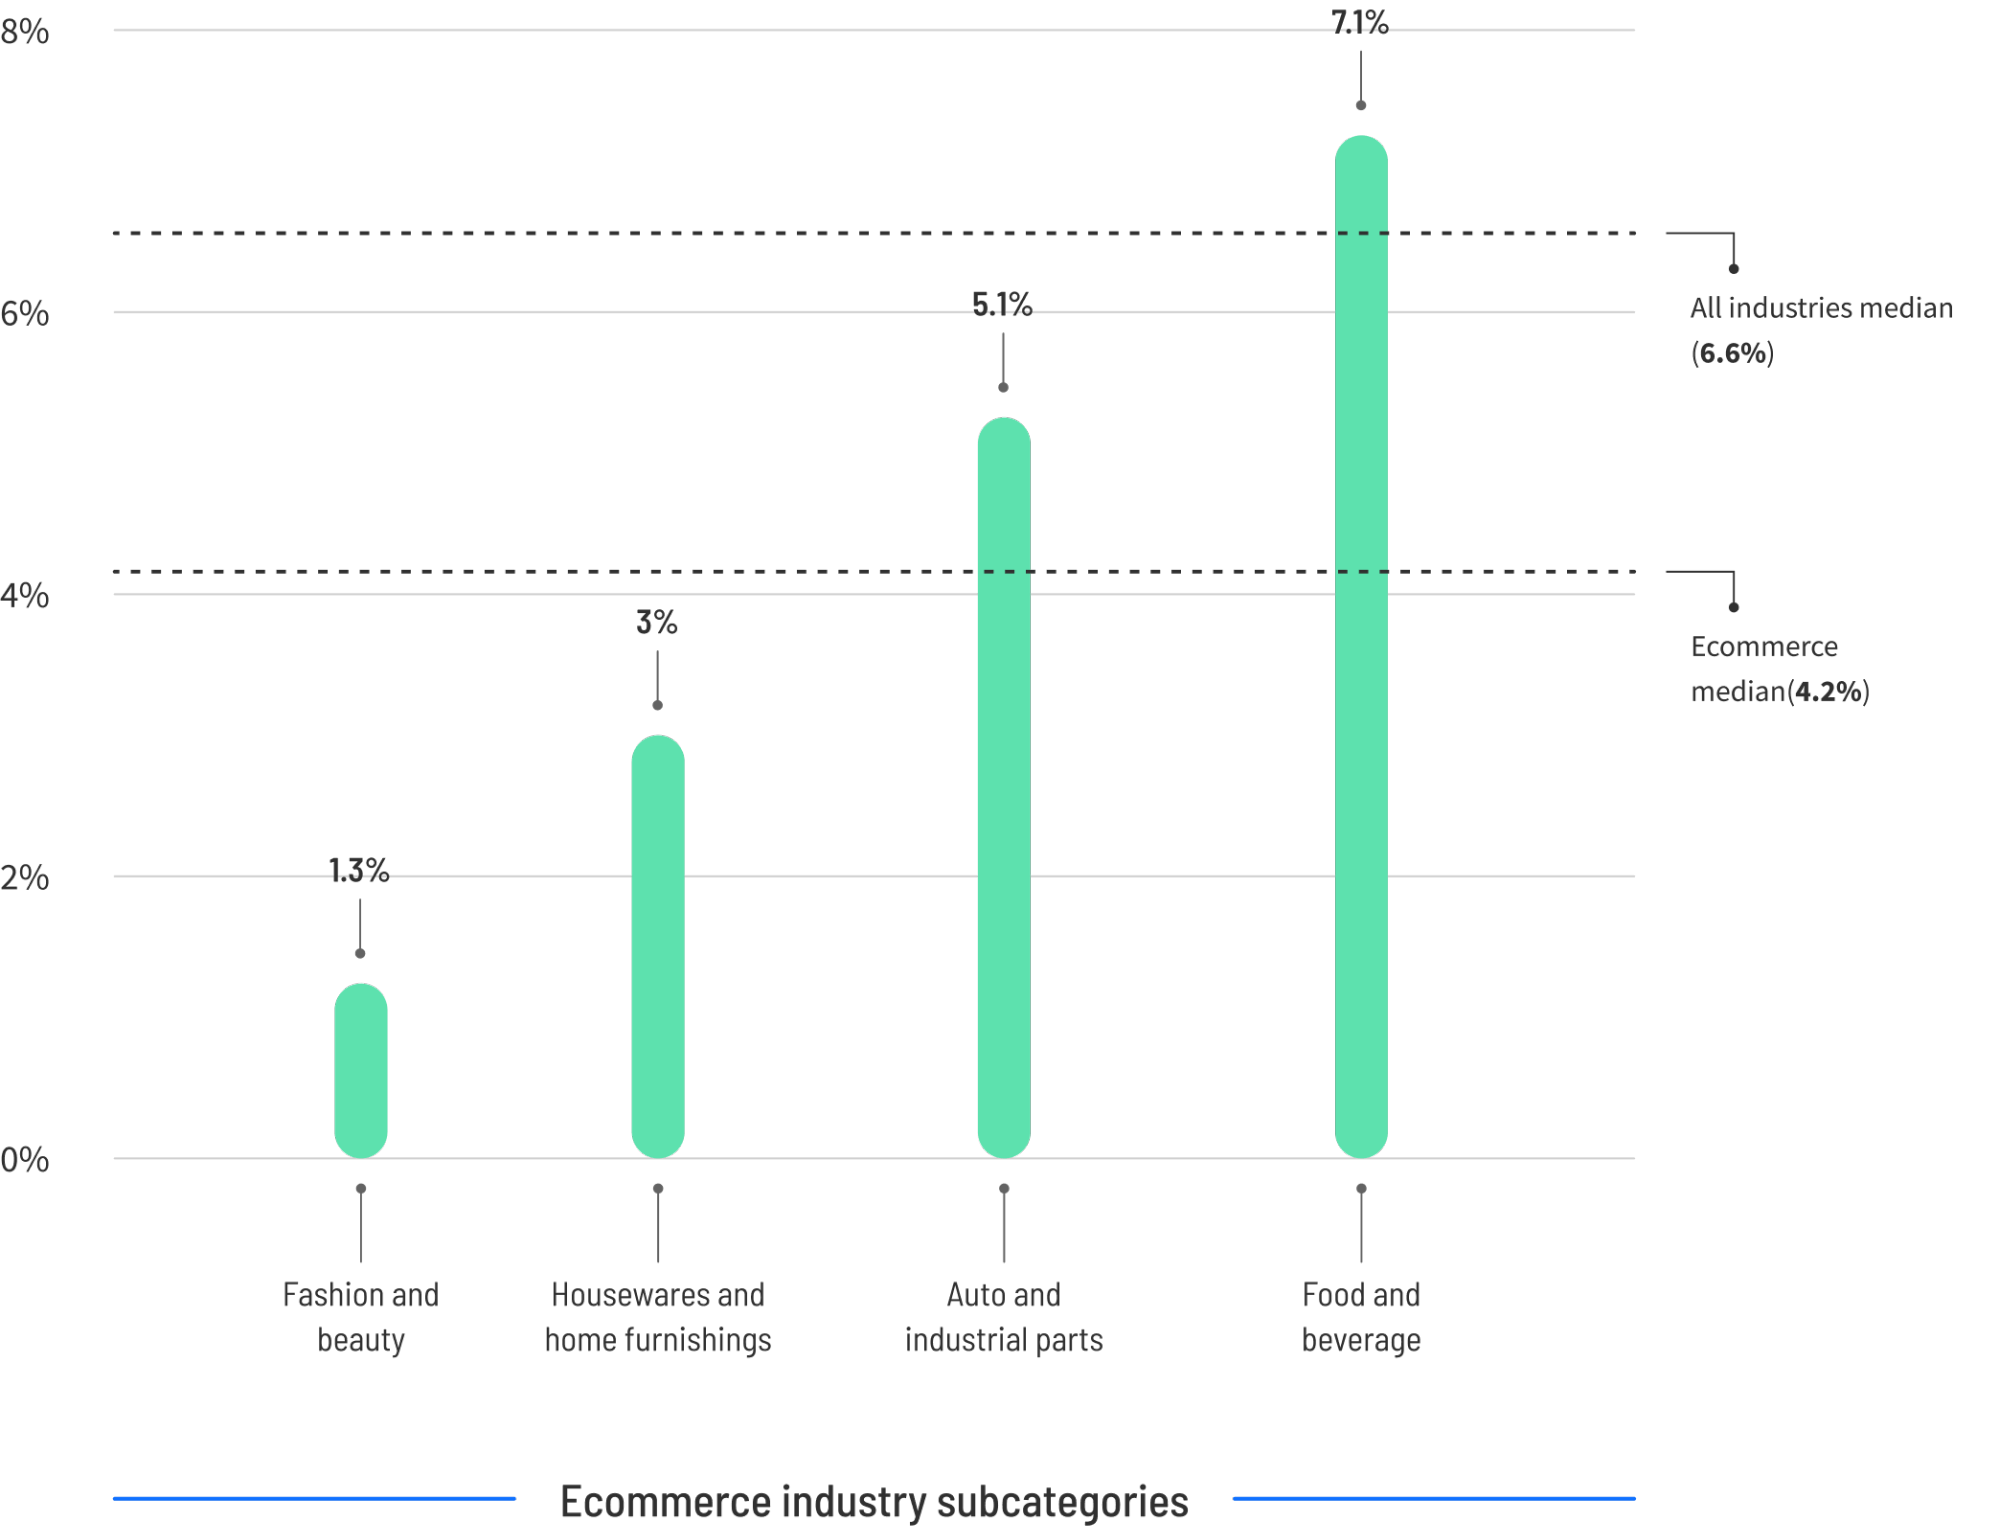
The median conversion rate for ecommerce landing pages is 4.2%. While this may appear lower than the cross-industry average, it reflects a broad spectrum of consumer behavior, from casual browsing to high-intent shopping. Top performers in the ecommerce sector, however, are reaching 11.4%. Analysts suggest that the disparity between median and top-tier performance in ecommerce is often driven by the "friction" of the checkout process and the clarity of the value proposition. In sub-sectors such as Food and Beverage, the median rises to 7.1%, whereas Fashion and Beauty see a tighter median of 1.3%, likely due to the highly visual and comparative nature of apparel shopping.
Software as a Service (SaaS)
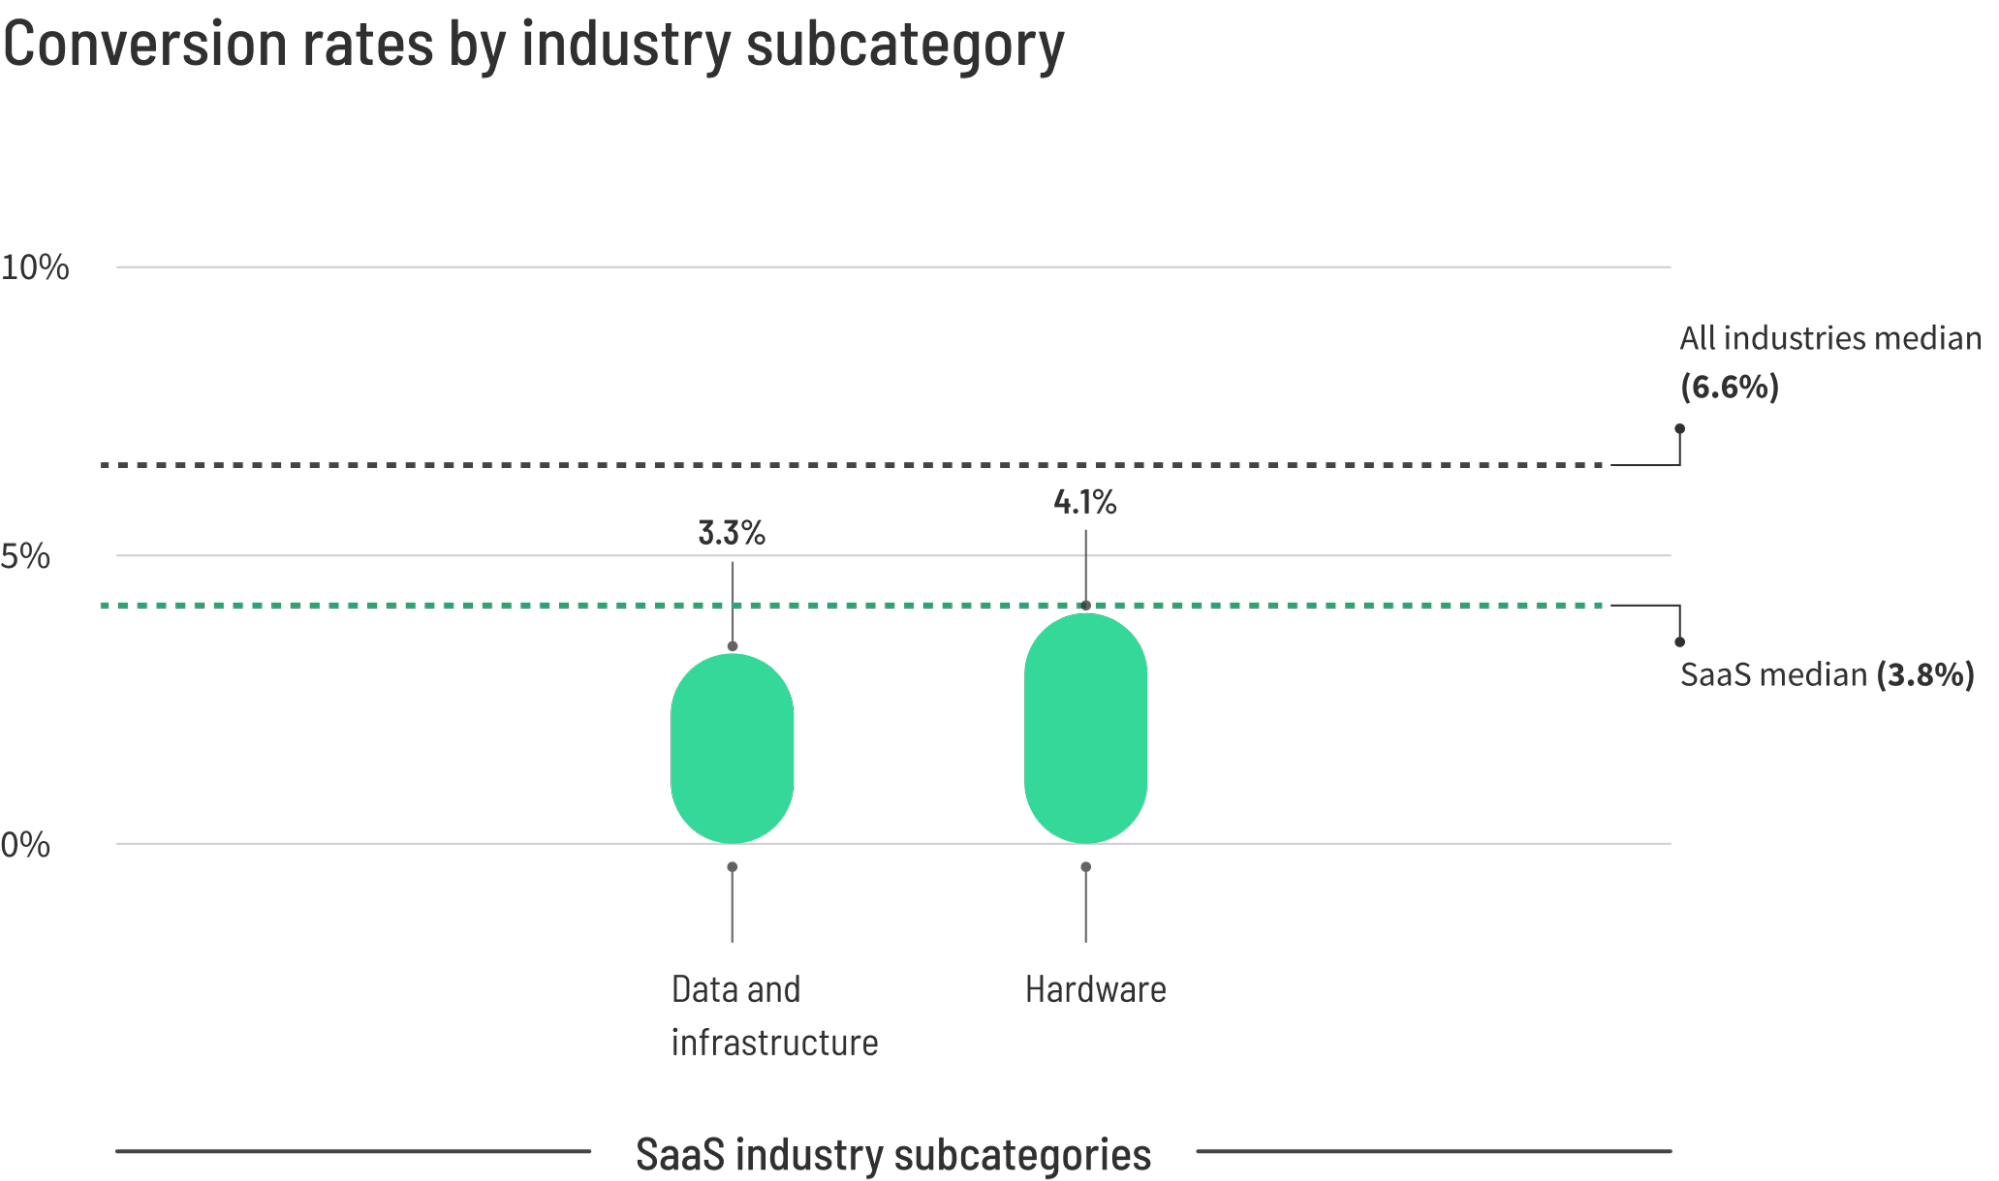
The SaaS sector faces unique challenges, recording a median conversion rate of 3.8%. This reflects the complexity of software products, which often require a longer education phase before a user is willing to commit to a trial or demo. High-performing SaaS pages (the top 25%) are hitting 11.6%. The data indicates that hardware-focused SaaS solutions (4.1% median) slightly outperform data and infrastructure solutions (3.3% median), suggesting that tangible utility remains easier to communicate than abstract technical benefits.
Professional and Financial Services
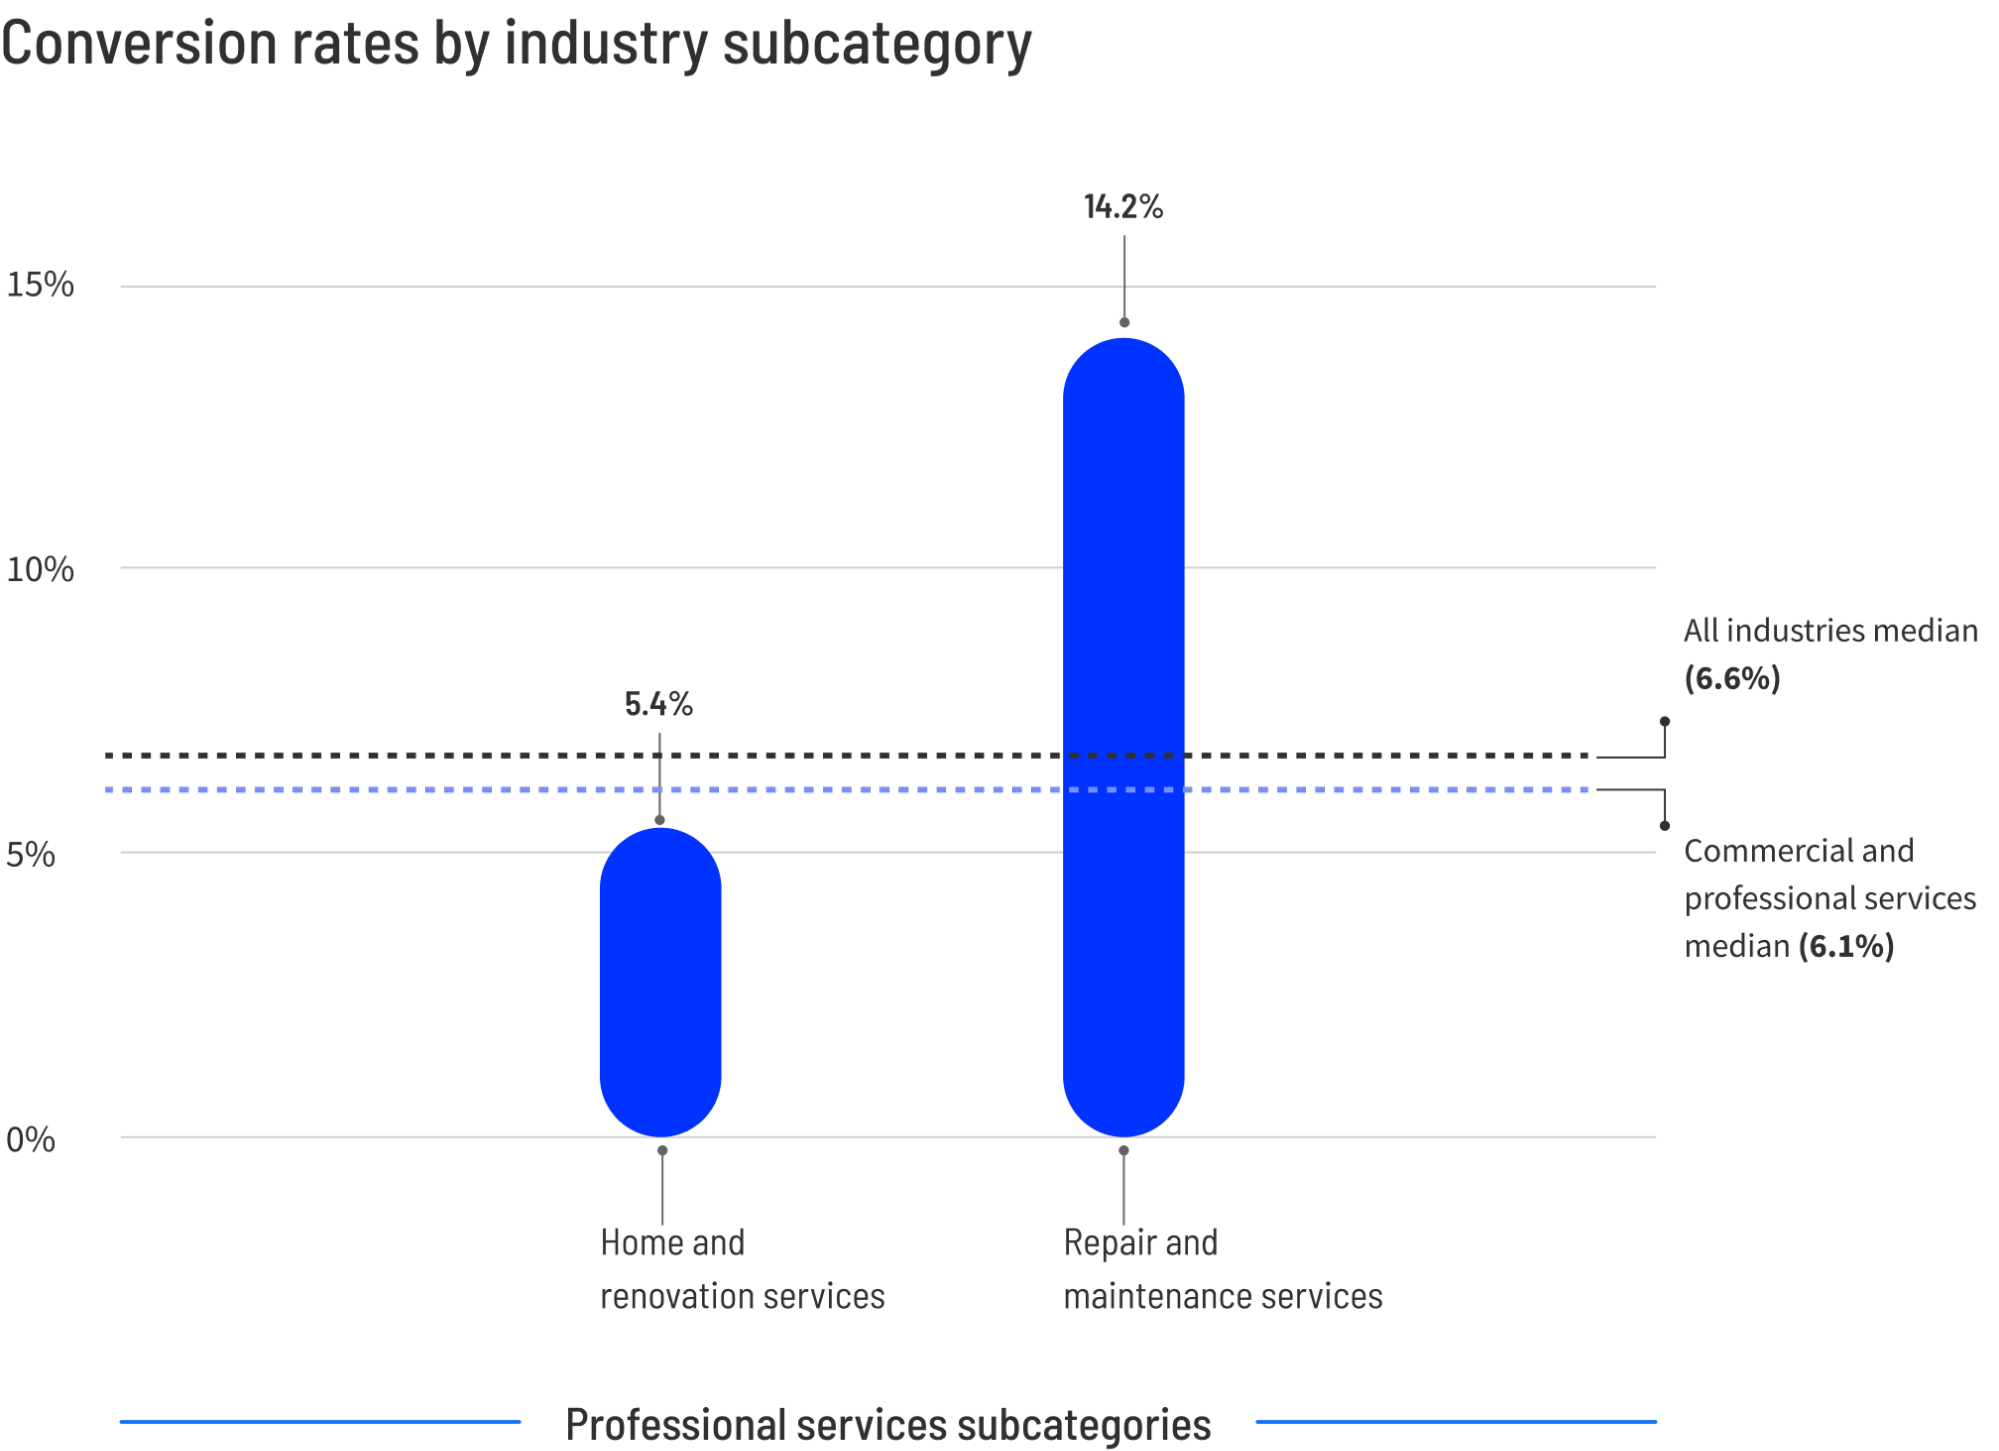
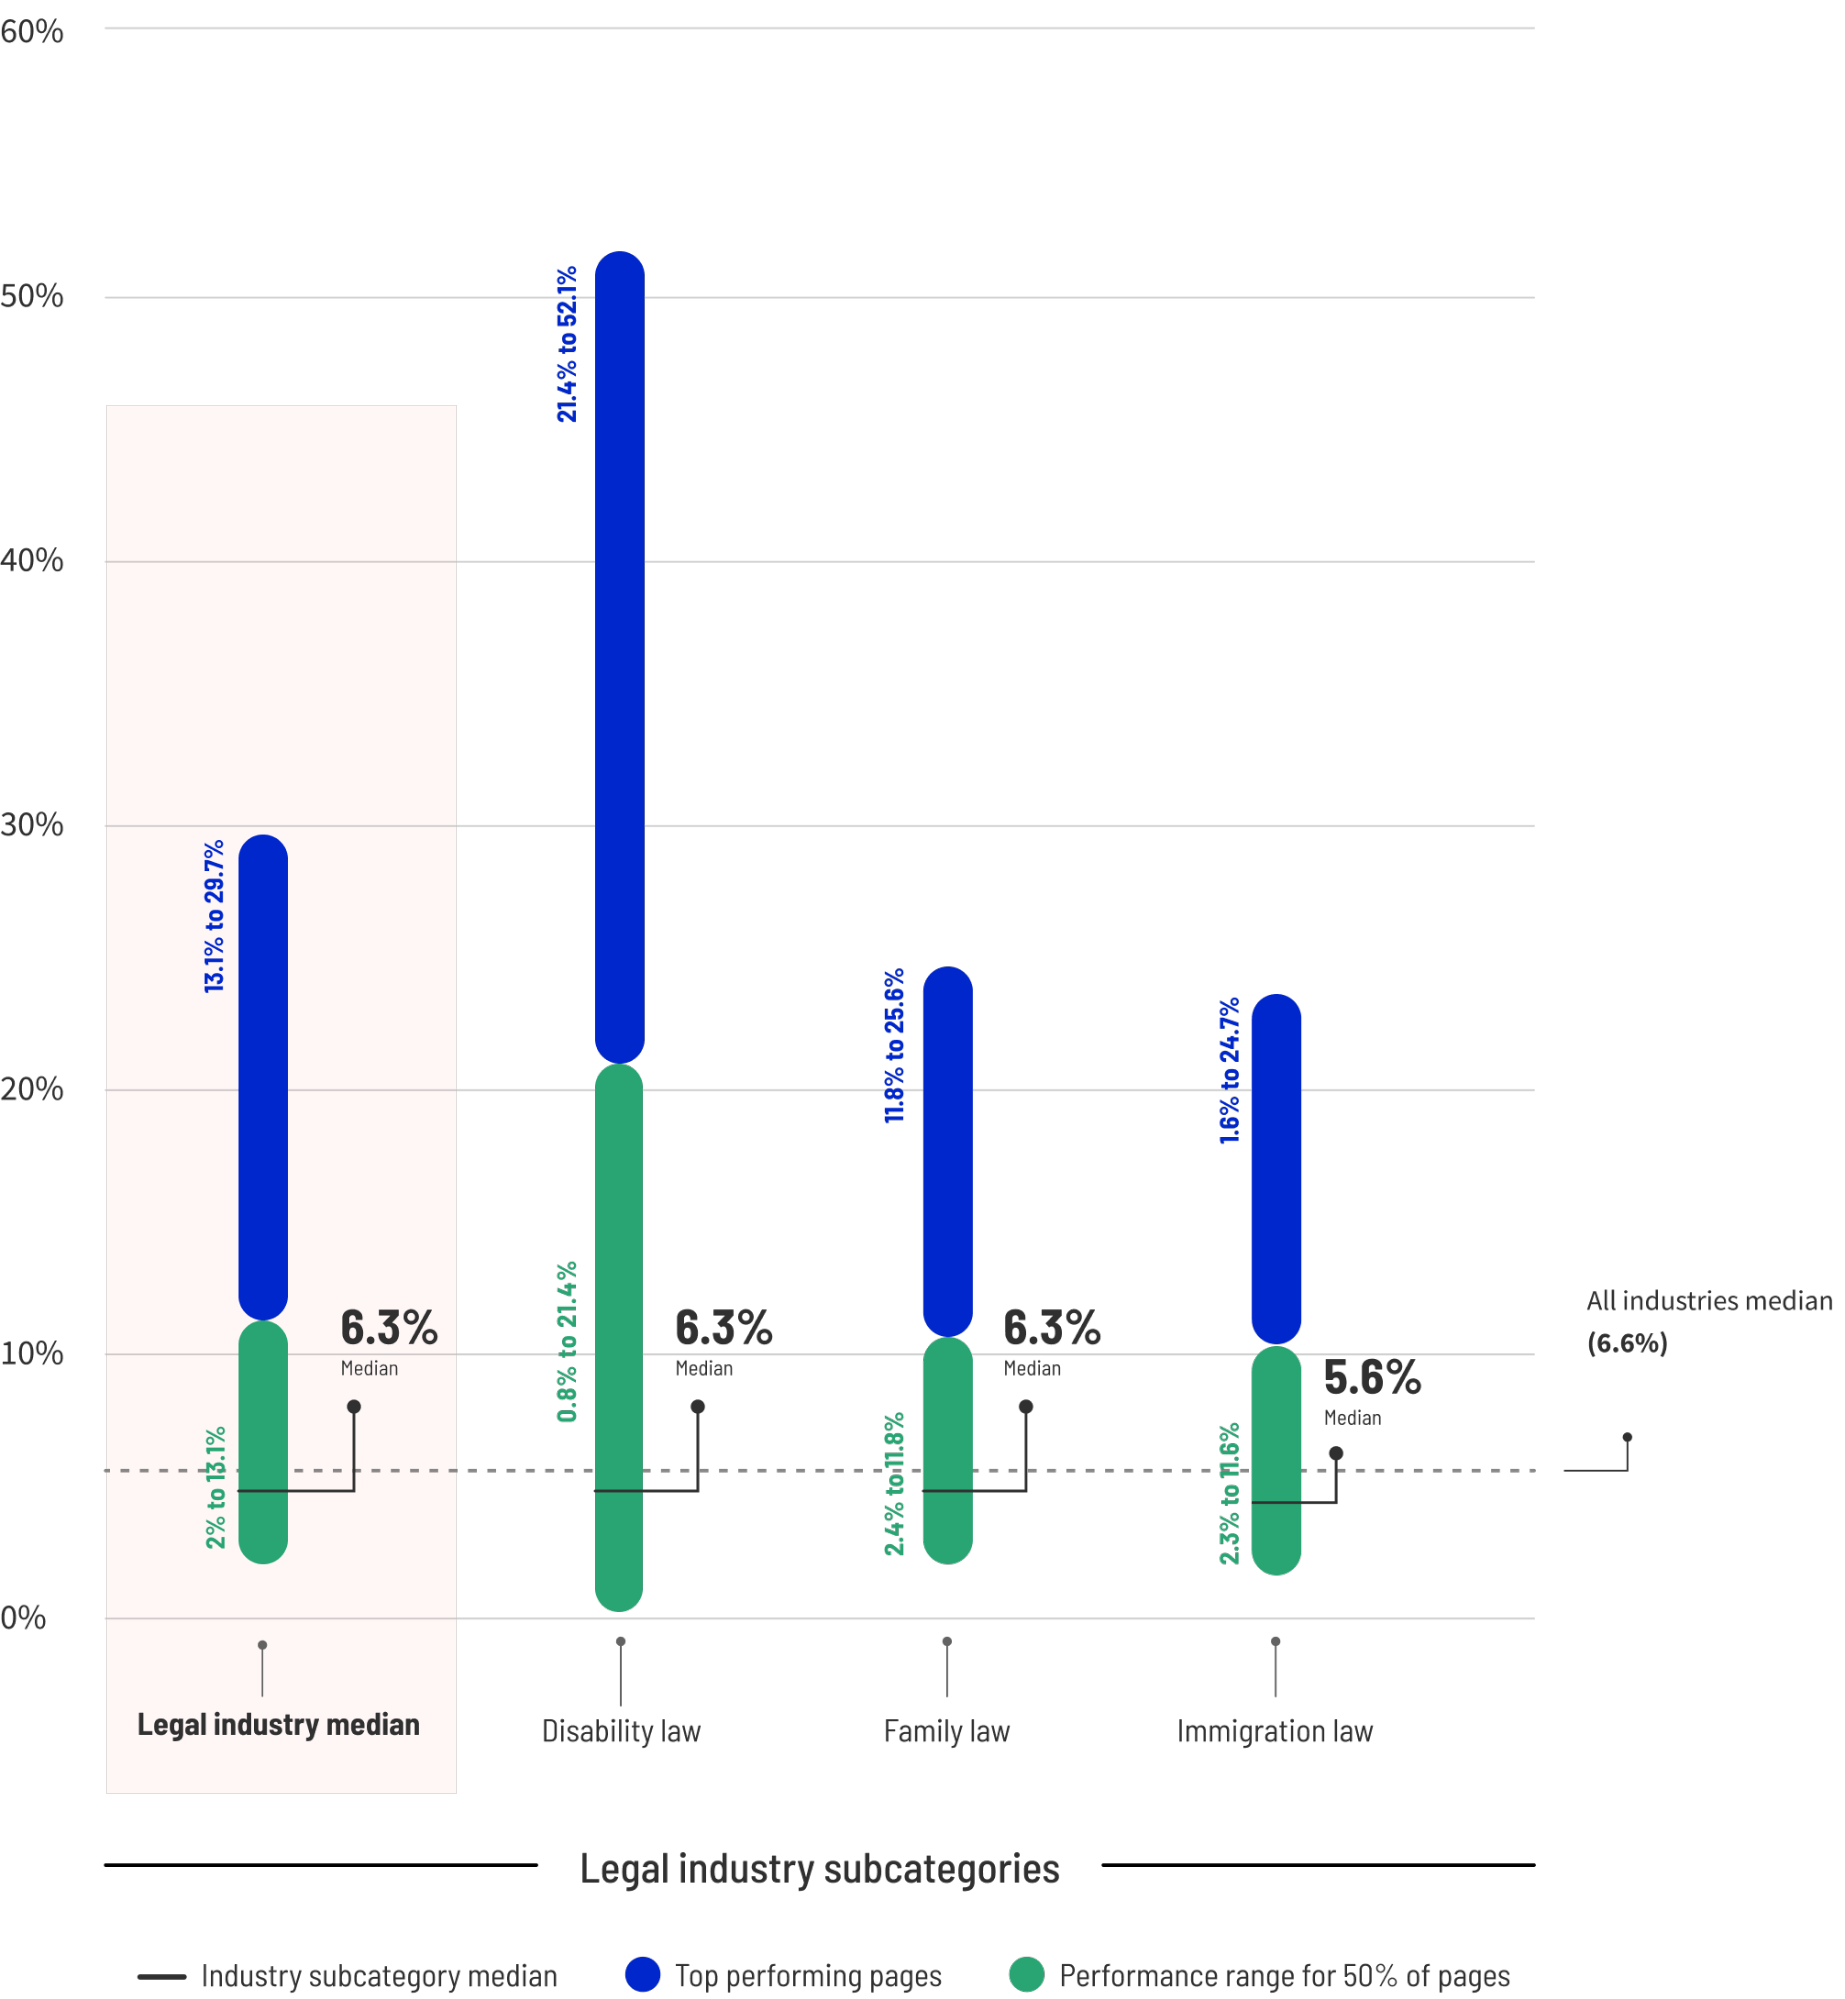
Professional services, including consulting and legal firms, show a median conversion rate of 6.1%, with top performers reaching 14.1%. Interestingly, within this category, repair and maintenance services convert at nearly triple the rate of home renovation services. This is attributed to "need-based" urgency; a consumer with a burst pipe is significantly more likely to convert immediately than a homeowner considering a kitchen remodel.
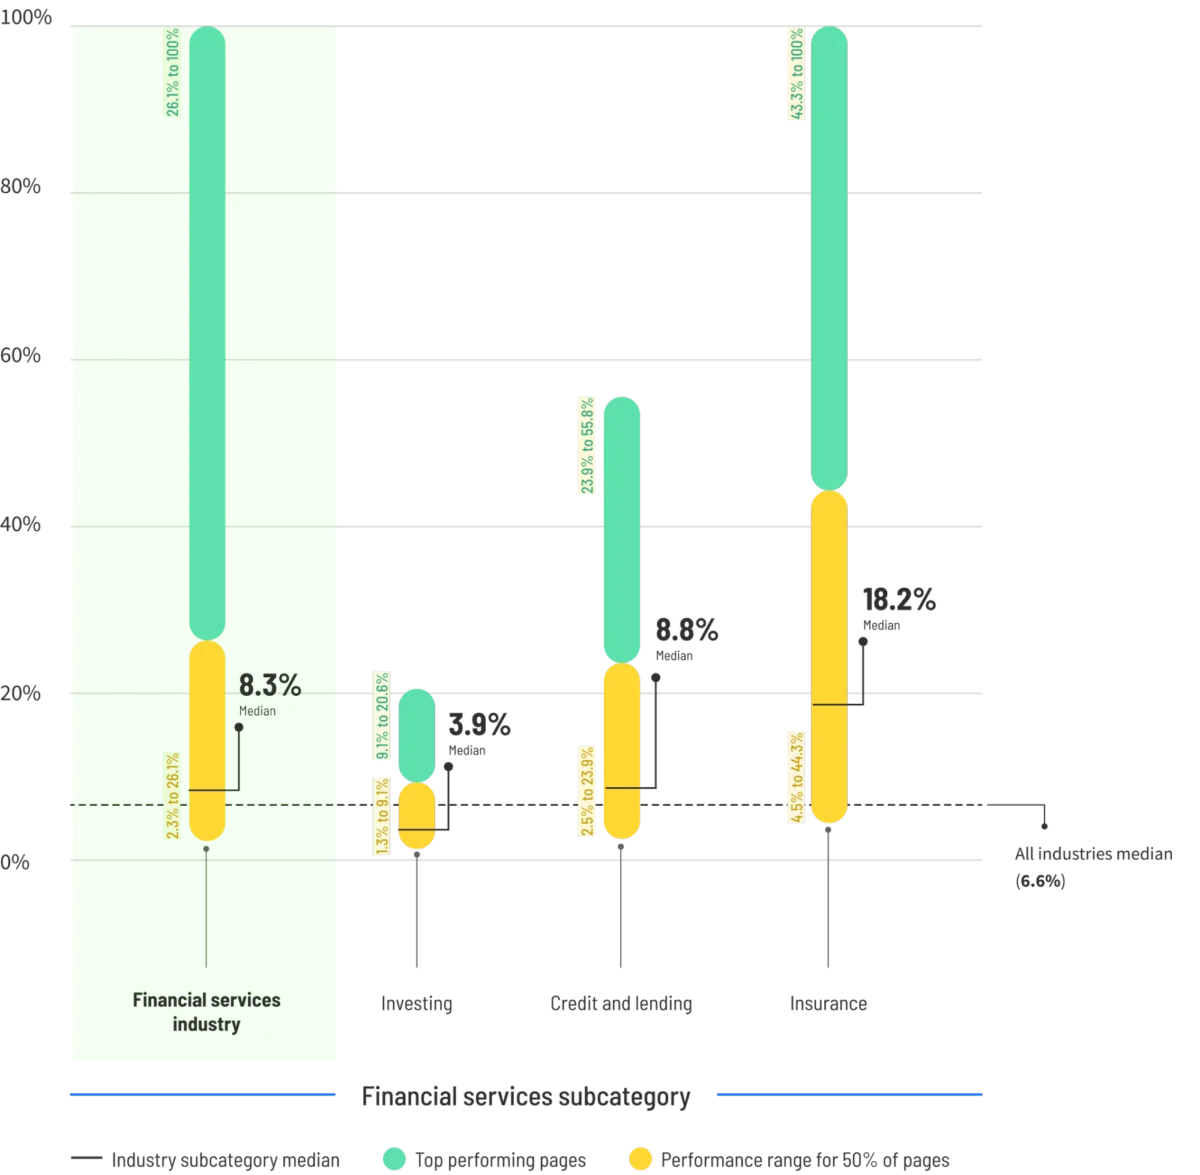
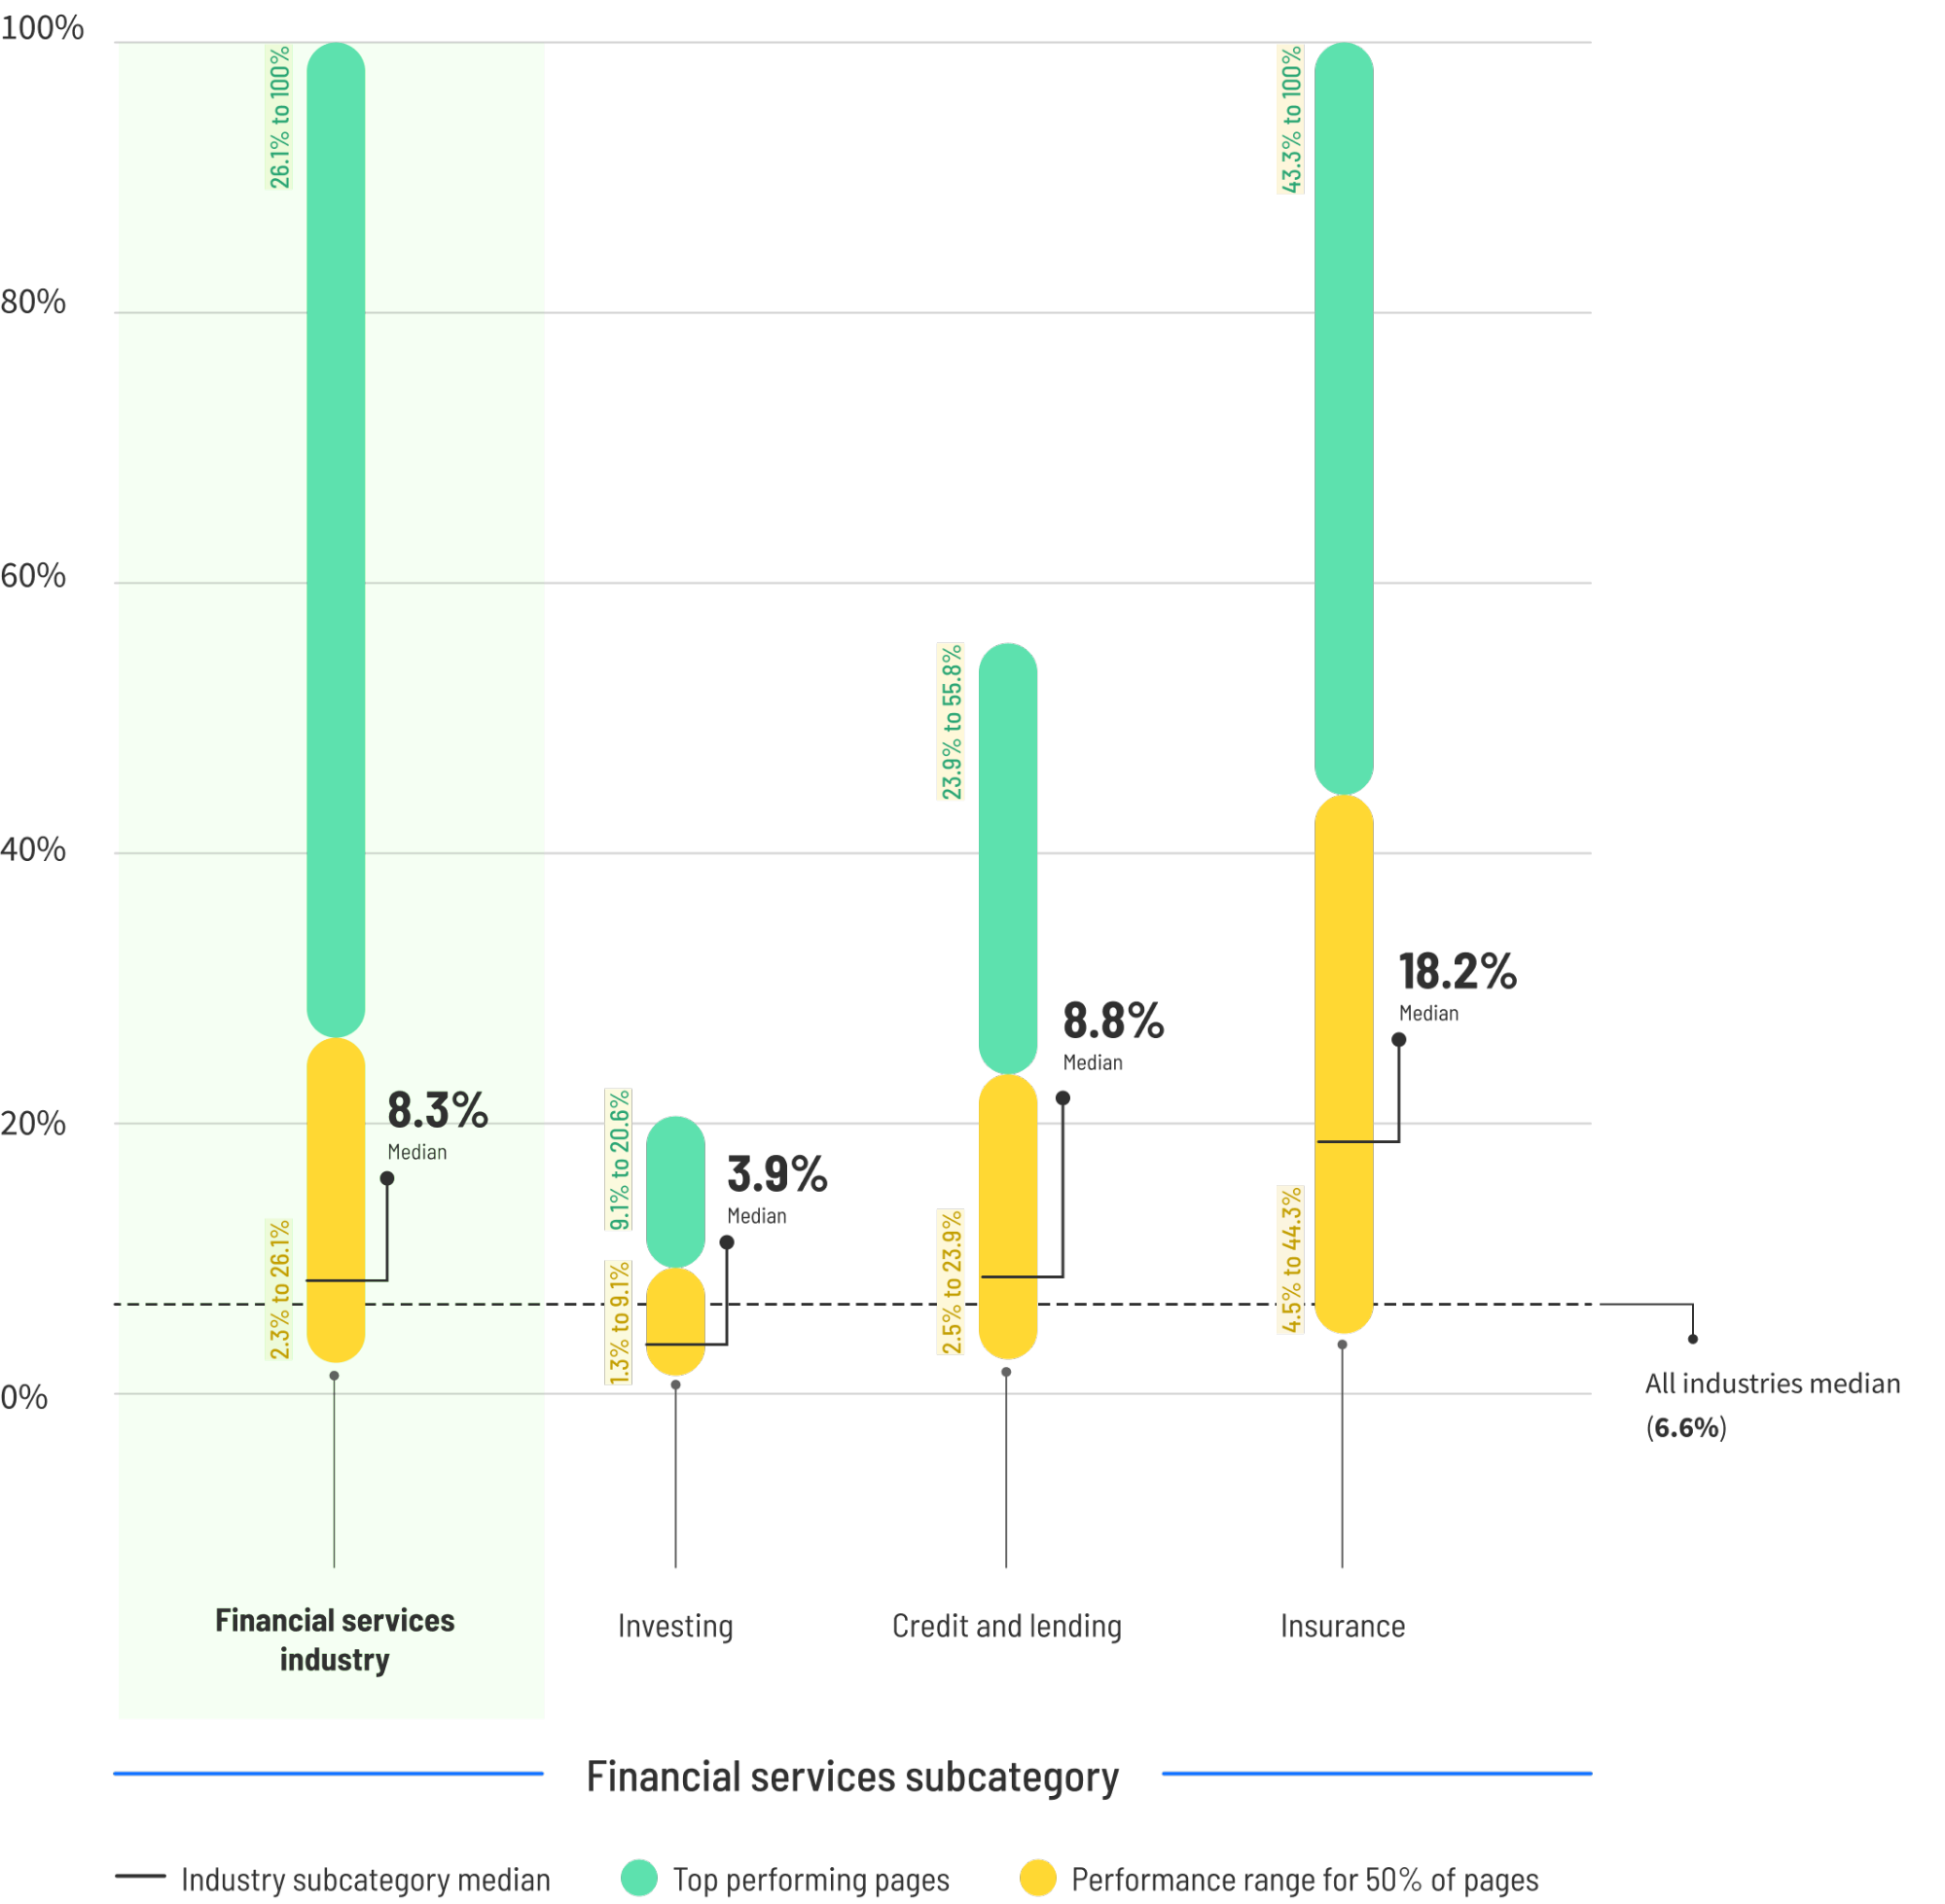
Financial services outperform many other sectors with a median of 8.3%. Within this industry, insurance landing pages are particularly dominant, yielding an 18.2% median. This is largely due to the high-intent nature of financial searches; users looking for insurance quotes are typically at the bottom of the sales funnel, ready to provide information in exchange for pricing.
Education and Entertainment
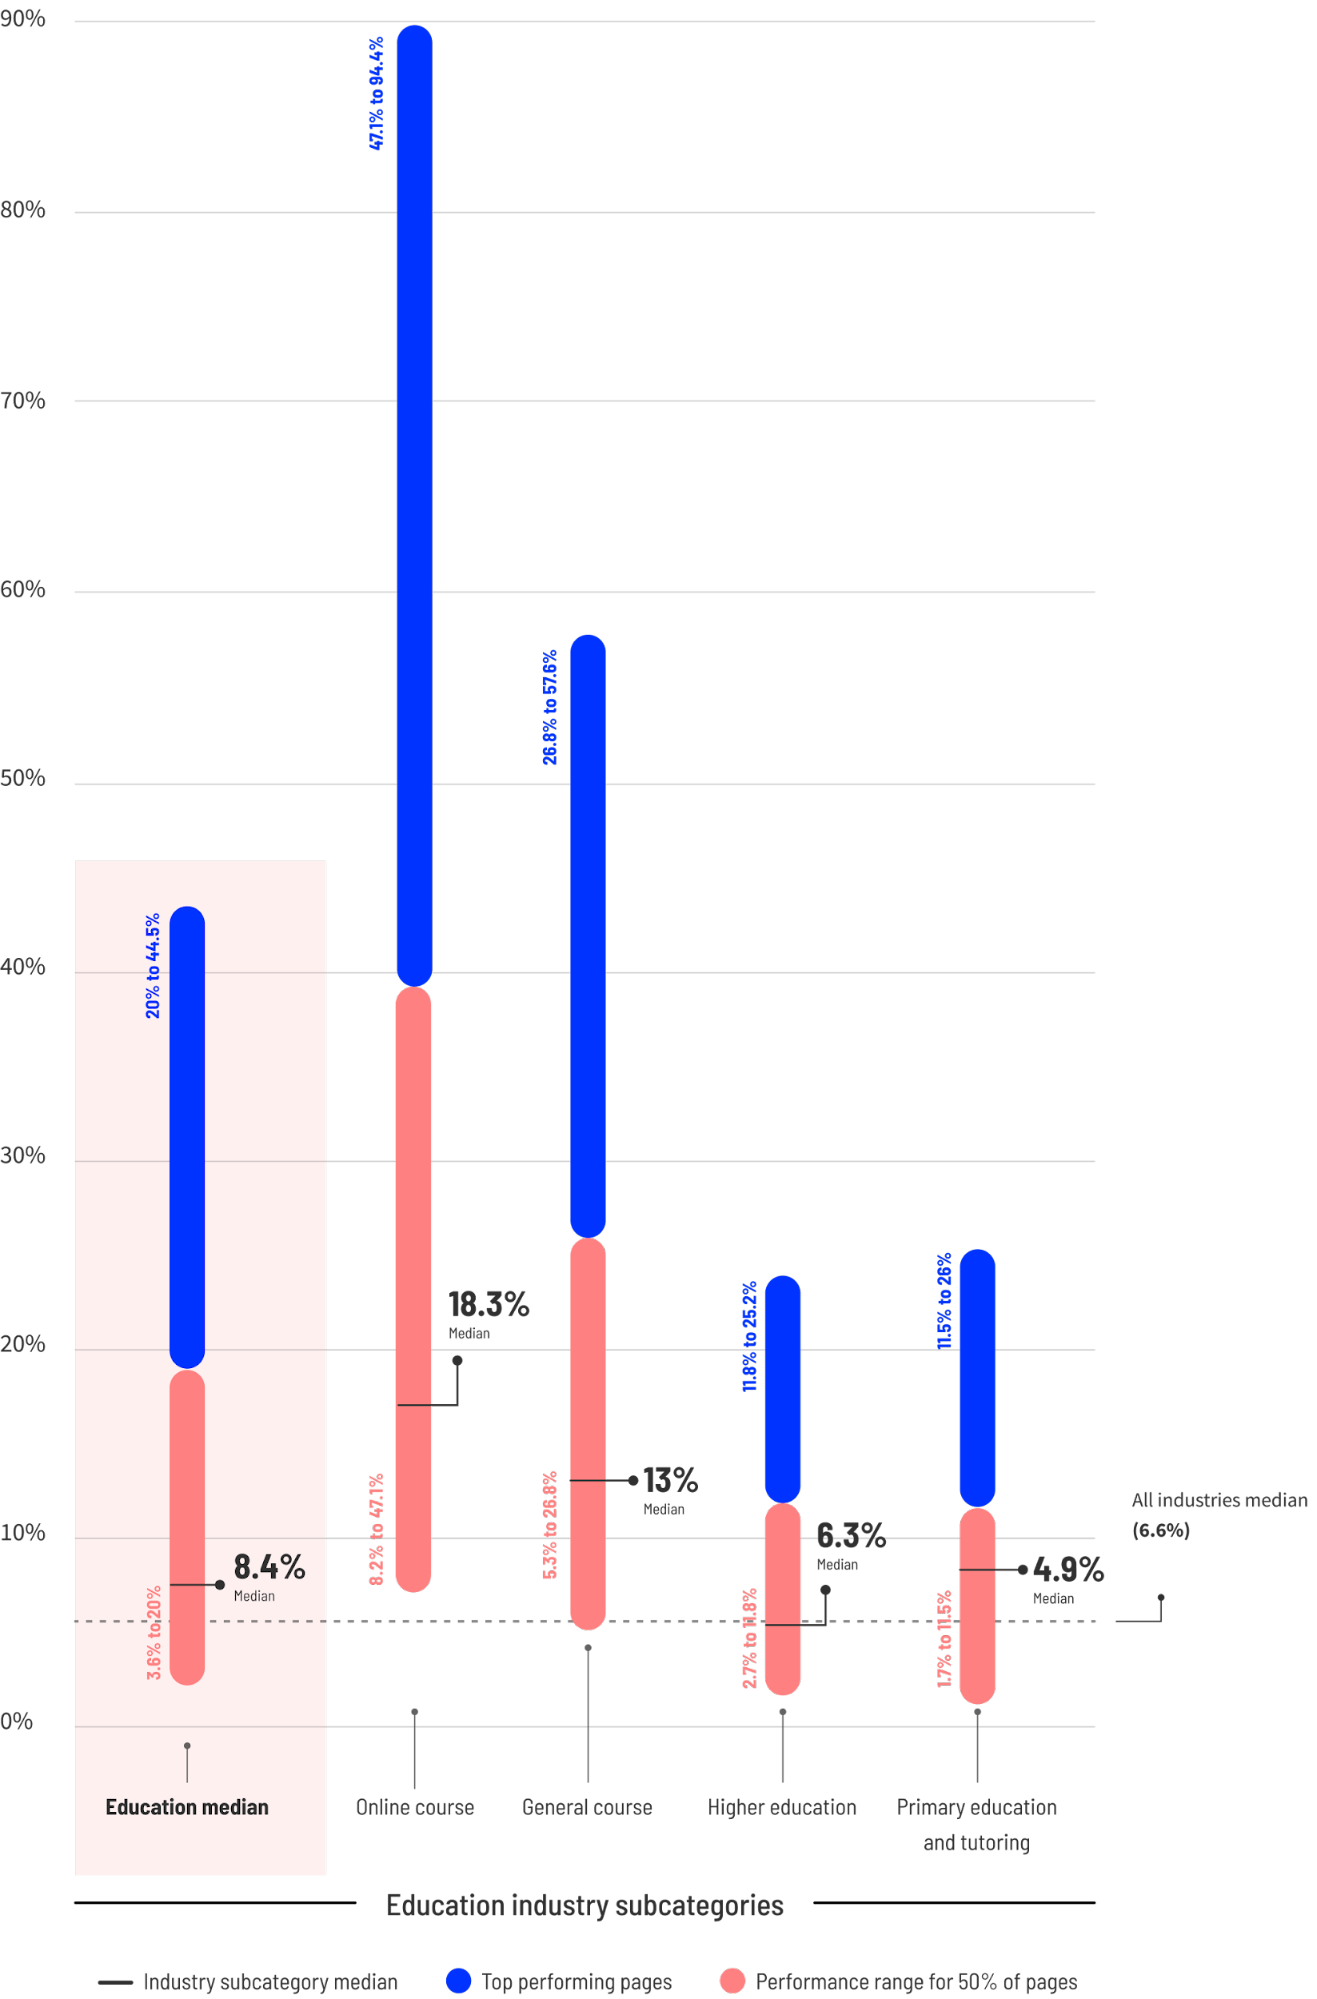
The education sector continues to show robust performance with a median conversion rate of 13.5%. Online courses are the primary driver here, with an 18.3% median rate. Experts hypothesize that the "immediate problem-solving" nature of online courses—such as learning a specific skill for career advancement—drives higher urgency than general degree programs.
Entertainment remains the highest-converting industry overall, with a median of 11.7% and a "good" threshold of 40.8%. This is heavily influenced by sweepstakes and contest pages, which often convert at a median of 47.5%. Because these pages typically require very little from the user (often just an email address), the barrier to conversion is exceptionally low.
The Chronology of Conversion Evolution (2020–2024)
The trajectory of conversion rates over the last four years reveals a stabilizing digital market.
- 2020–2021: The pandemic-induced shift to digital led to an explosion in traffic, but conversion rates were volatile as consumers experimented with new online behaviors.
- 2022: As the world reopened, digital fatigue set in, leading to a slight dip in landing page efficacy as competition for attention reached an all-time high.
- 2023: The integration of AI in copy and design began to influence benchmarks, allowing for more personalized landing page experiences.
- 2024: The current year represents a "flight to quality." Consumers are more discerning, and privacy-first data policies (such as the phasing out of third-party cookies) have forced marketers to rely more on first-party data collected through high-converting landing pages.
Traffic Channels and Device Dynamics
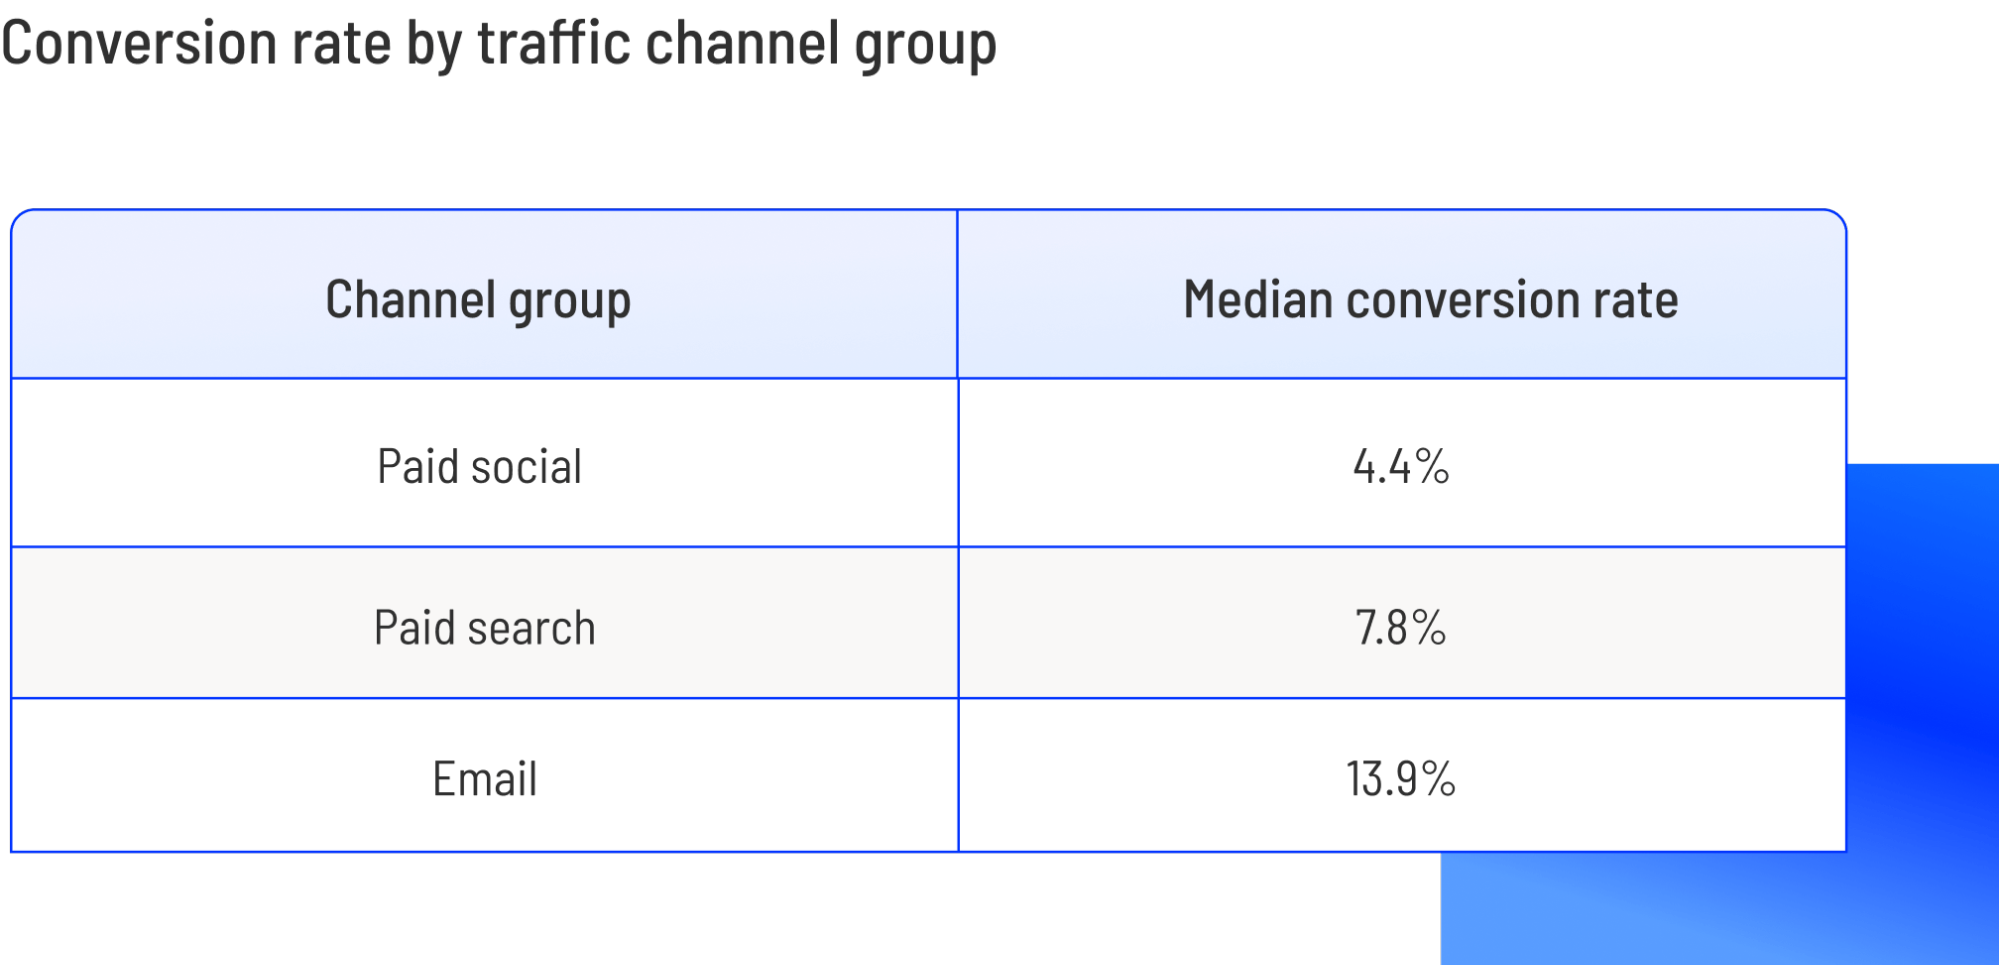
The 2024 data highlights a significant divide in how different traffic sources perform. Email marketing remains the "gold standard" for conversion, frequently outperforming paid social and search. In the professional services sector, for instance, email traffic converts at approximately 14%, while paid social hovers at 4.4%. This reinforces the importance of nurturing existing leads rather than relying solely on "cold" traffic acquisition.
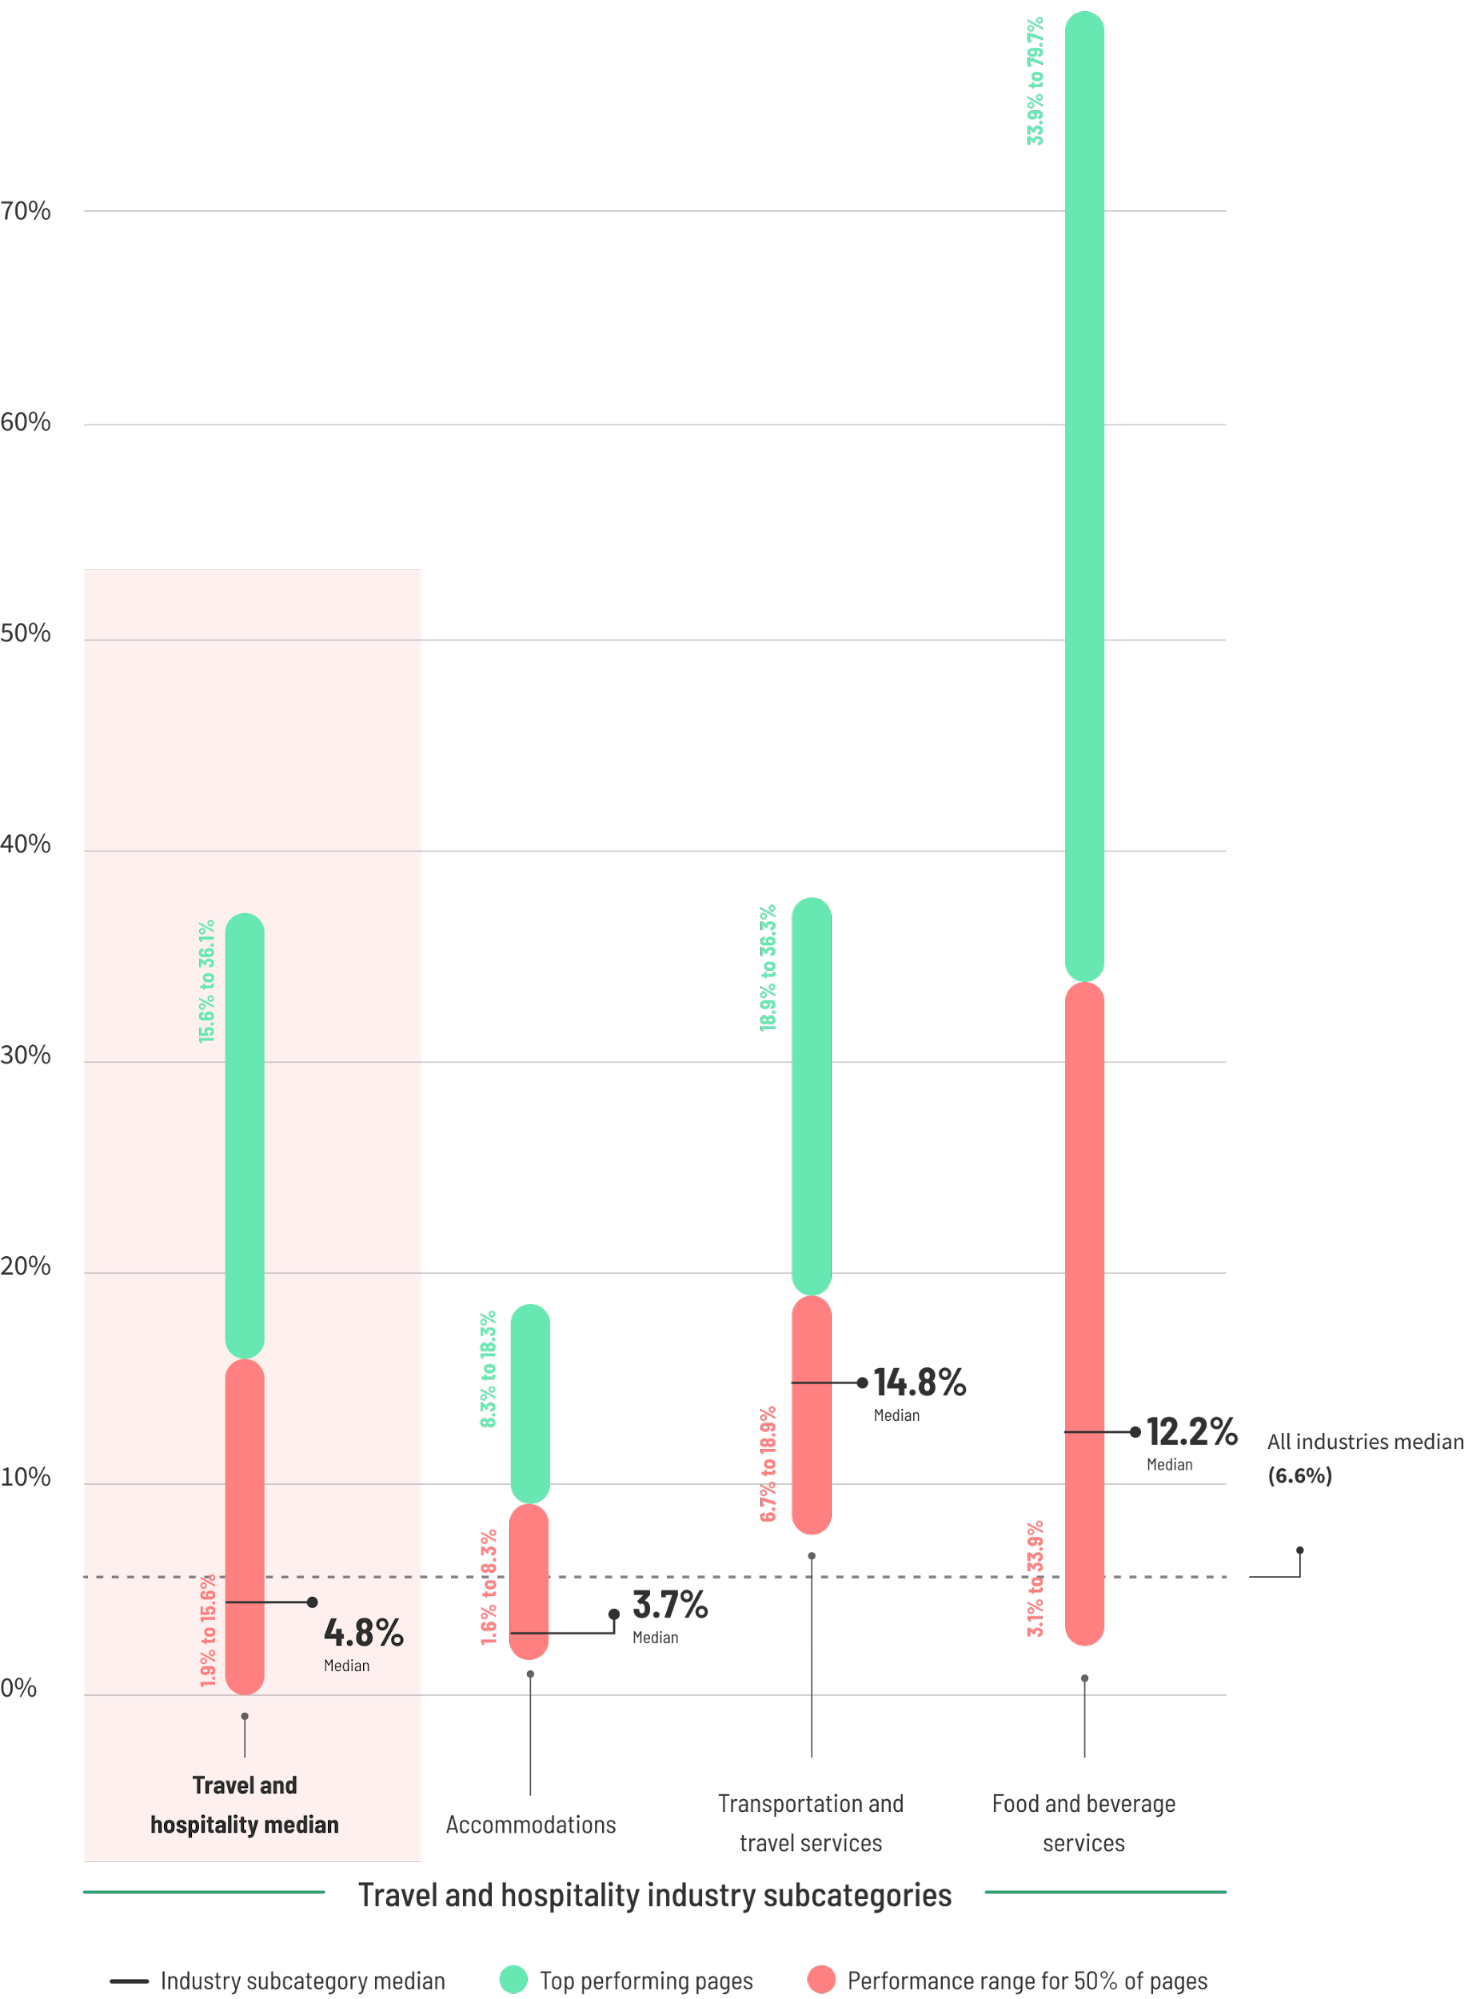
Device type also plays a critical role. While mobile accounts for a staggering 83% of all landing page visits, it does not always lead in conversion. In industries like Travel and Hospitality, desktop traffic converts 10.4% better than mobile, suggesting that while users research trips on their phones, they prefer the perceived security and larger screen of a desktop to finalize expensive bookings. Conversely, in the Legal and Financial sectors, mobile conversion rates often exceed desktop, driven by "emergency" searches conducted on the go.
Fact-Based Analysis of Optimization Strategies
The report identifies several key levers that distinguish high-performing pages from the median.
The Impact of Reading Ease
One of the most significant findings in the 2024 analysis is the correlation between copy simplicity and conversion. Pages written at a 5th-to-7th-grade reading level convert at a median of 11.1%. This is 56% higher than pages written at an 8th-to-9th-grade level and more than double the rate of pages using "professional" or jargon-heavy language. The implication is clear: in an age of diminishing attention spans, clarity and accessibility are more valuable than sophisticated vocabulary.
Social Proof and Trust Signals
Top-performing pages in 2024 are characterized by the strategic placement of social proof. Rather than relegating testimonials to the footer, successful marketers are integrating review counts, client logos, and real-time social proof near the primary Call to Action (CTA). This reduces "conversion anxiety" at the most critical moment of the user journey.
Friction Reduction
The data suggests that every additional form field or navigation link acts as a "leak" in the conversion funnel. Top-quartile performers consistently utilize "distraction-free" landing pages that strip away main site navigation, focusing the user entirely on a single objective.
Official Responses and Expert Insights
Josh Gallant, founder of Backstage SEO and a primary contributor to the Unbounce analysis, emphasizes that benchmarks should be viewed as a starting point rather than a ceiling. "The goal isn’t just to hit an arbitrary ‘good’ number," Gallant notes. "It’s to systematically improve what you have and maximize the return on every marketing dollar spent."
Marketing analysts suggest that the 2024 benchmarks reflect a more mature digital consumer who values transparency and speed. Companies that have invested in "Smart Traffic" AI—tools that automatically route visitors to the page variant most likely to convert them based on their historical behavior—are seeing significantly higher lifts than those relying on static A/B testing alone.
Broader Impact and Implications for the Future
The 2024 Conversion Benchmark Report signals a shift in digital strategy from "volume" to "precision." As the cost per click (CPC) on major platforms like Google and Meta continues to rise, the ability to convert a higher percentage of existing traffic is the only sustainable way to maintain profitability.
Furthermore, the high conversion rates seen in the "simple language" category suggest a broader cultural shift. Consumers are increasingly wary of "marketing speak" and are gravitating toward brands that communicate with authenticity and simplicity. For businesses, the implication is a necessary re-evaluation of brand voice—moving away from corporate formality toward a more human-centric, accessible tone.
As we move toward 2025, the gap between the median (6.6%) and the top performers (11.4%+) is expected to widen. Organizations that embrace data-driven optimization, mobile-first design, and radical simplicity in their messaging will be best positioned to capture market share in an increasingly crowded digital arena. The 2024 data serves as both a warning and an opportunity: while the "average" is a safe baseline, the real competitive advantage lies in the pursuit of the 75th percentile.