

In the contemporary digital landscape, where user experience (UX) and conversion rate optimization (CRO) dictate the success of online enterprises, A/B testing has transitioned from a niche technical requirement to a foundational business strategy. While various enterprise-level platforms offer automated insights, a significant portion of the industry relies on a "free stack" of tools to derive conclusions. However, the efficacy of these experiments rests not on the sophistication of the software, but on the methodological rigor of the analysis. A/B testing tools are inherently designed to report performance variations; they lack the cognitive capacity to determine if those results are statistically robust enough to justify long-term strategic shifts.
The Foundational Mechanics of A/B Testing Analysis
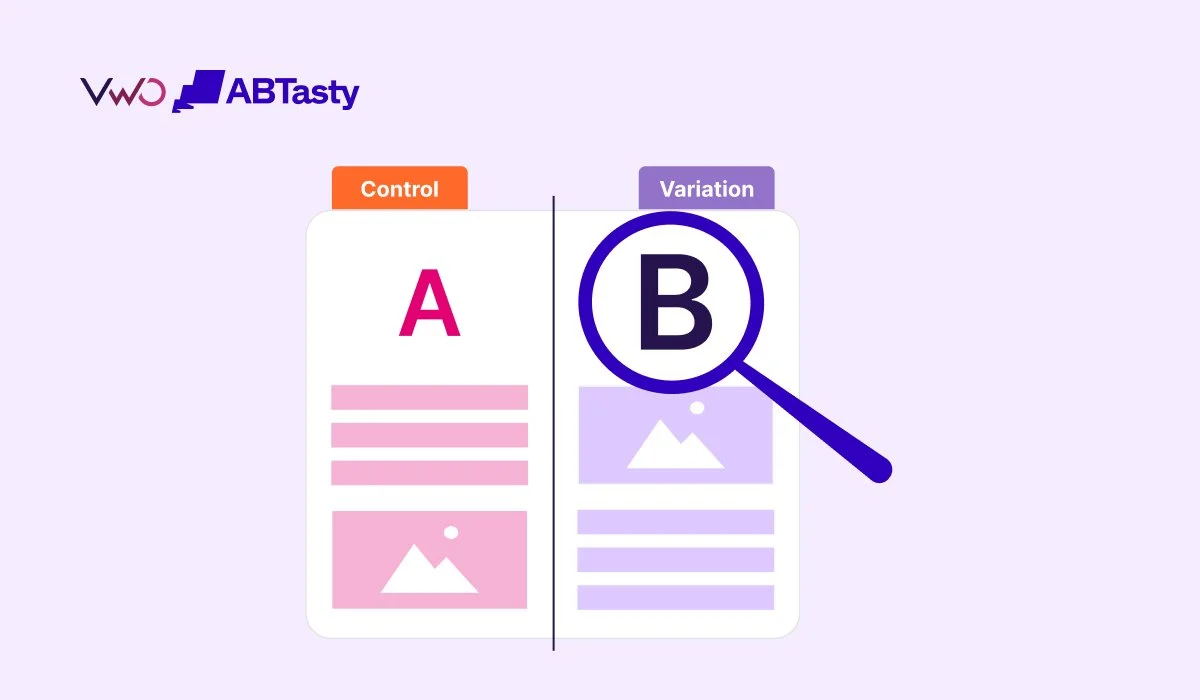
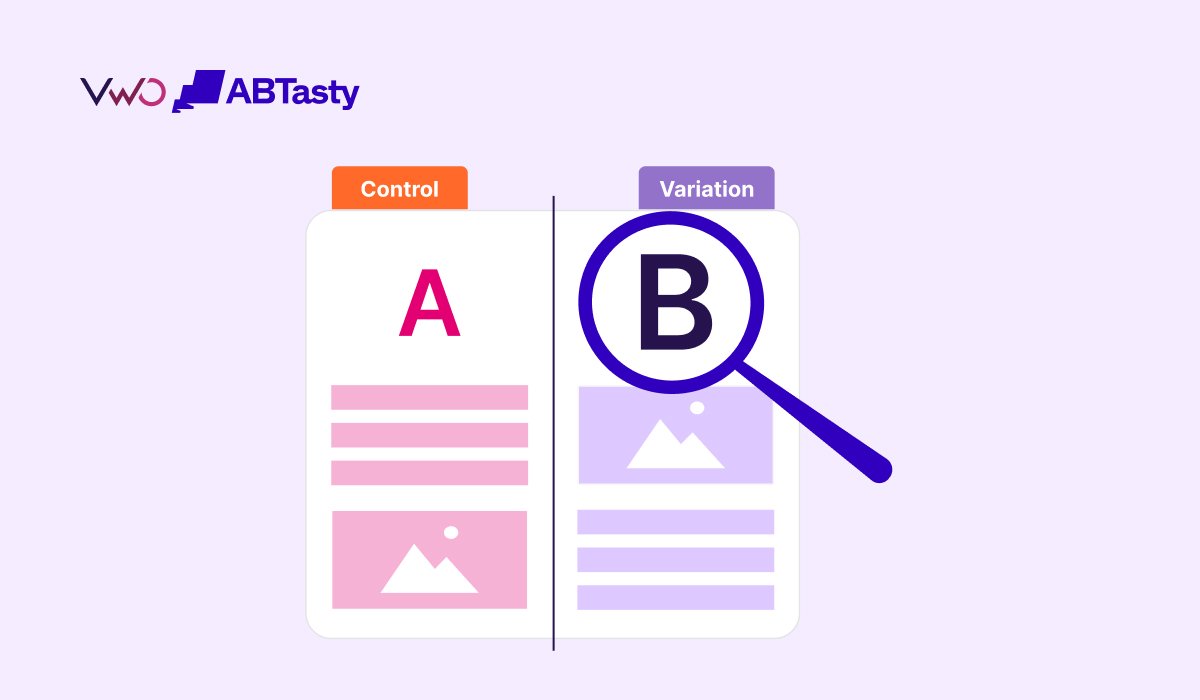
A/B testing, or split testing, functions by dividing a user base into two distinct segments: the Control group, which interacts with the original version of a digital asset, and the Variant group, which experiences a modified version. The objective is to identify which version yields a higher conversion rate or better engagement. Despite the simplicity of the concept, the analysis of the resulting data is where many organizations falter.
A common pitfall in digital experimentation is the reliance on "surface-level" wins. A variant may show a 15% lift in conversion rates after four days, prompting a team to implement the change immediately. However, without accounting for sample size, statistical significance, and business cycles, such "wins" often evaporate, with performance returning to the baseline shortly after deployment. This phenomenon underscores the necessity of a structured analysis framework that moves beyond raw percentages to evaluate the probability of sustained success.
A Seven-Step Framework for Rigorous Analysis
To ensure that data-driven decisions are grounded in reality, analysts must adhere to a disciplined workflow. This process begins long before the first user enters the experiment.
1. Pre-Analysis Metric Locking
The integrity of an A/B test is established at the launch phase. Analysts must define primary, secondary, and guardrail metrics prior to reviewing any data. The primary metric serves as the "north star" for the experiment—usually a macro-conversion like a purchase or sign-up. Secondary metrics provide context, while guardrail metrics ensure that optimizing one area does not inadvertently damage another (e.g., increasing sign-ups at the cost of significantly higher churn). Altering these metrics post-hoc—a practice often referred to as "p-hacking"—invalidates the statistical power of the test and leads to false positives.
2. Verification of Sample Size and Duration
Before interpreting conversion data, it is imperative to confirm that the experiment reached the "Minimum Detectable Effect" (MDE). Using tools like the Evan Miller sample size calculator, analysts can determine the volume of traffic required per variant to achieve statistical validity. Furthermore, tests must run for at least one full business cycle, typically seven to 14 days. This accounts for fluctuations in user behavior between weekdays and weekends, ensuring the data represents a holistic view of the audience.
3. Data Extraction and Structuring
Data must be pulled from a reliable source, such as Google Analytics 4 (GA4), and organized systematically. The core dataset should include unique visitors (sessions), total conversions, and the resulting conversion rate for each variant. This raw data serves as the input for significance calculators and allows for a manual audit of the tracking setup to ensure no events were missed or duplicated.
4. The Sample Ratio Mismatch (SRM) Audit
One of the most critical, yet frequently overlooked, steps is checking for Sample Ratio Mismatch. If an experiment is designed to split traffic 50/50, but the final data shows a 45/55 split, the results are likely compromised. SRM suggests a technical failure in how users were assigned to variations, rendering the findings unreliable. Advanced platforms often flag this automatically, but for those using free tools, a Chi-square test is a necessary manual step to verify the distribution.
5. Statistical Significance and Confidence Levels
Using a Bayesian or Frequentist calculator, analysts must determine the confidence level of the result. A 95% confidence threshold is the industry standard for high-stakes decisions, meaning there is only a 5% chance that the observed difference is due to random noise. For lower-risk changes, such as minor copy updates, a 90% threshold may be acceptable.
6. Granular Data Segmentation
Aggregate data often masks the true narrative of a test. A variant that appears to be a "winner" globally may actually be performing poorly on mobile devices or among returning visitors. By segmenting results by device type, acquisition channel, and user demographics, organizations can identify specific areas where a change is most effective, allowing for more nuanced implementation strategies.
7. Documentation and Institutional Knowledge
Every experiment, regardless of whether it results in a "win," "loss," or "inconclusive" outcome, must be documented. Recording the hypothesis, the variant description, the statistical findings, and the subsequent decision creates a repository of institutional knowledge. This prevents future teams from repeating failed experiments and helps refine the direction of subsequent hypotheses.
Navigating the Free Tool Ecosystem
While enterprise suites provide end-to-end integration, a combination of specialized free tools can achieve comparable accuracy if used correctly.
- Evan Miller’s Calculator: Essential for pre-test planning to calculate required sample sizes and post-test verification of statistical power.
- Google Analytics 4 (GA4): The primary engine for data collection and segmentation. While it does not natively calculate A/B test significance, its "Explorations" feature allows for deep dives into how different user segments responded to variants.
- AB Testguide and VWO Significance Calculators: These browser-based tools allow for the quick entry of visitor and conversion counts to determine percentage lift and confidence intervals.
- Google Sheets / Excel: These remain the standard for documenting results and visualizing trends over time. Line charts in these applications are particularly useful for identifying if a variant’s performance was stable or if it was skewed by a single-day spike in traffic.
The Evolution of Statistical Models: Bayesian vs. Frequentist
A major point of contention in the analytics community is the choice between Frequentist and Bayesian statistics. The Frequentist approach—the basis for most traditional calculators—requires a fixed sample size and a single check at the end of the experiment. However, this contradicts how most digital teams operate; they often "peek" at results daily. This "peeking problem" can lead to inflated error rates.
In response, many modern practitioners have moved toward Bayesian sequential testing. This model updates the probability of a variant’s success continuously as new data arrives. It answers the question most stakeholders actually care about: "What is the probability that Variant B is better than the Control?" This approach is more intuitive for business decision-making and is the engine behind advanced platforms like VWO’s SmartStats, which also incorporates a "Region of Practical Equivalence" (ROPE) to ensure that winning results are commercially significant, not just statistically valid.
Key Metrics for In-Depth Analysis
Success in A/B testing is predicated on choosing the right metrics. Depending on the hypothesis, different indicators take precedence:
- Conversion Rate (CR): The primary metric for transactional goals.
- Click-Through Rate (CTR): Best for measuring engagement with specific elements like Call-to-Action (CTA) buttons.
- Revenue Per Visitor (RPV): Critical for e-commerce, as it ensures that an increase in conversion rate doesn’t come at the expense of average order value.
- Funnel Drop-off Rate: Essential for identifying friction points in multi-step processes like checkout or onboarding.
- Bounce Rate: A vital guardrail metric to ensure that new designs are not alienating users upon arrival.
Broader Impact and Strategic Implications
The shift toward accurate A/B test analysis has profound implications for organizational efficiency. According to industry experts, including Jared Brown, a common mistake is basing decisions on insufficient data, which steers strategies in the wrong direction. Accurate analysis ensures that engineering resources are only spent on features that provide a proven benefit.
Furthermore, the democratization of these tools means that even small startups can compete with larger corporations by adopting a "test-and-learn" culture. However, as the volume of testing increases, the limitations of manual "free stack" workflows—such as fragmented data and the risk of manual calculation errors—become more apparent. This often serves as the catalyst for organizations to migrate to integrated platforms that combine behavioral insights, such as heatmaps and session recordings, with statistical analysis.
Ultimately, the goal of A/B testing extends beyond short-term metric boosts. It is a tool for risk mitigation and long-term innovation. By accurately analyzing how users interact with different variations, businesses can build a deeper understanding of their audience’s preferences, leading to more informed product development and a more resilient market position. Whether using a suite of free tools or a high-end platform, the principles of statistical integrity and methodological consistency remain the only path to truly data-driven growth.







