

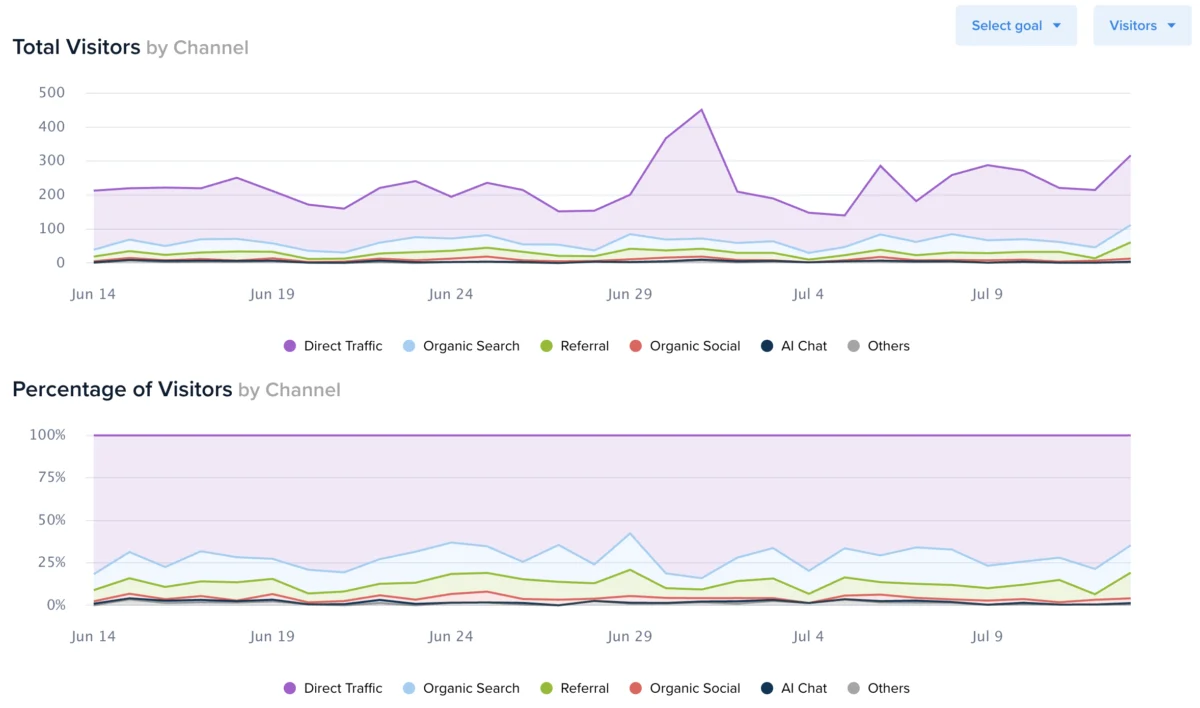
Crazy Egg, a pioneer in heat mapping and conversion rate optimization (CRO) technology, has officially announced a significant update to its Web Analytics suite, introducing dedicated time-series charts for every traffic segment within its reporting dashboard. This enhancement allows digital marketers, data analysts, and website owners to move beyond static, aggregate data and instead observe longitudinal performance trends on a day-by-day basis. By providing a visual representation of how specific audience segments behave over time, the platform aims to offer deeper insights into traffic volatility, channel efficacy, and the direct impact of marketing campaigns on conversion goals.
The update addresses a common challenge in digital analytics: the difficulty of identifying the precise moment a trend shifts within a specific subset of traffic. While aggregate data often masks underlying issues or successes, the new time-series functionality enables users to isolate variables such as referral sources, geographic locations, or device types. This allows for the visualization of traffic spikes for specific pages, the identification of declining acquisition channels, and a more nuanced understanding of which campaigns are driving meaningful user actions.
Technical Implementation and User Interface
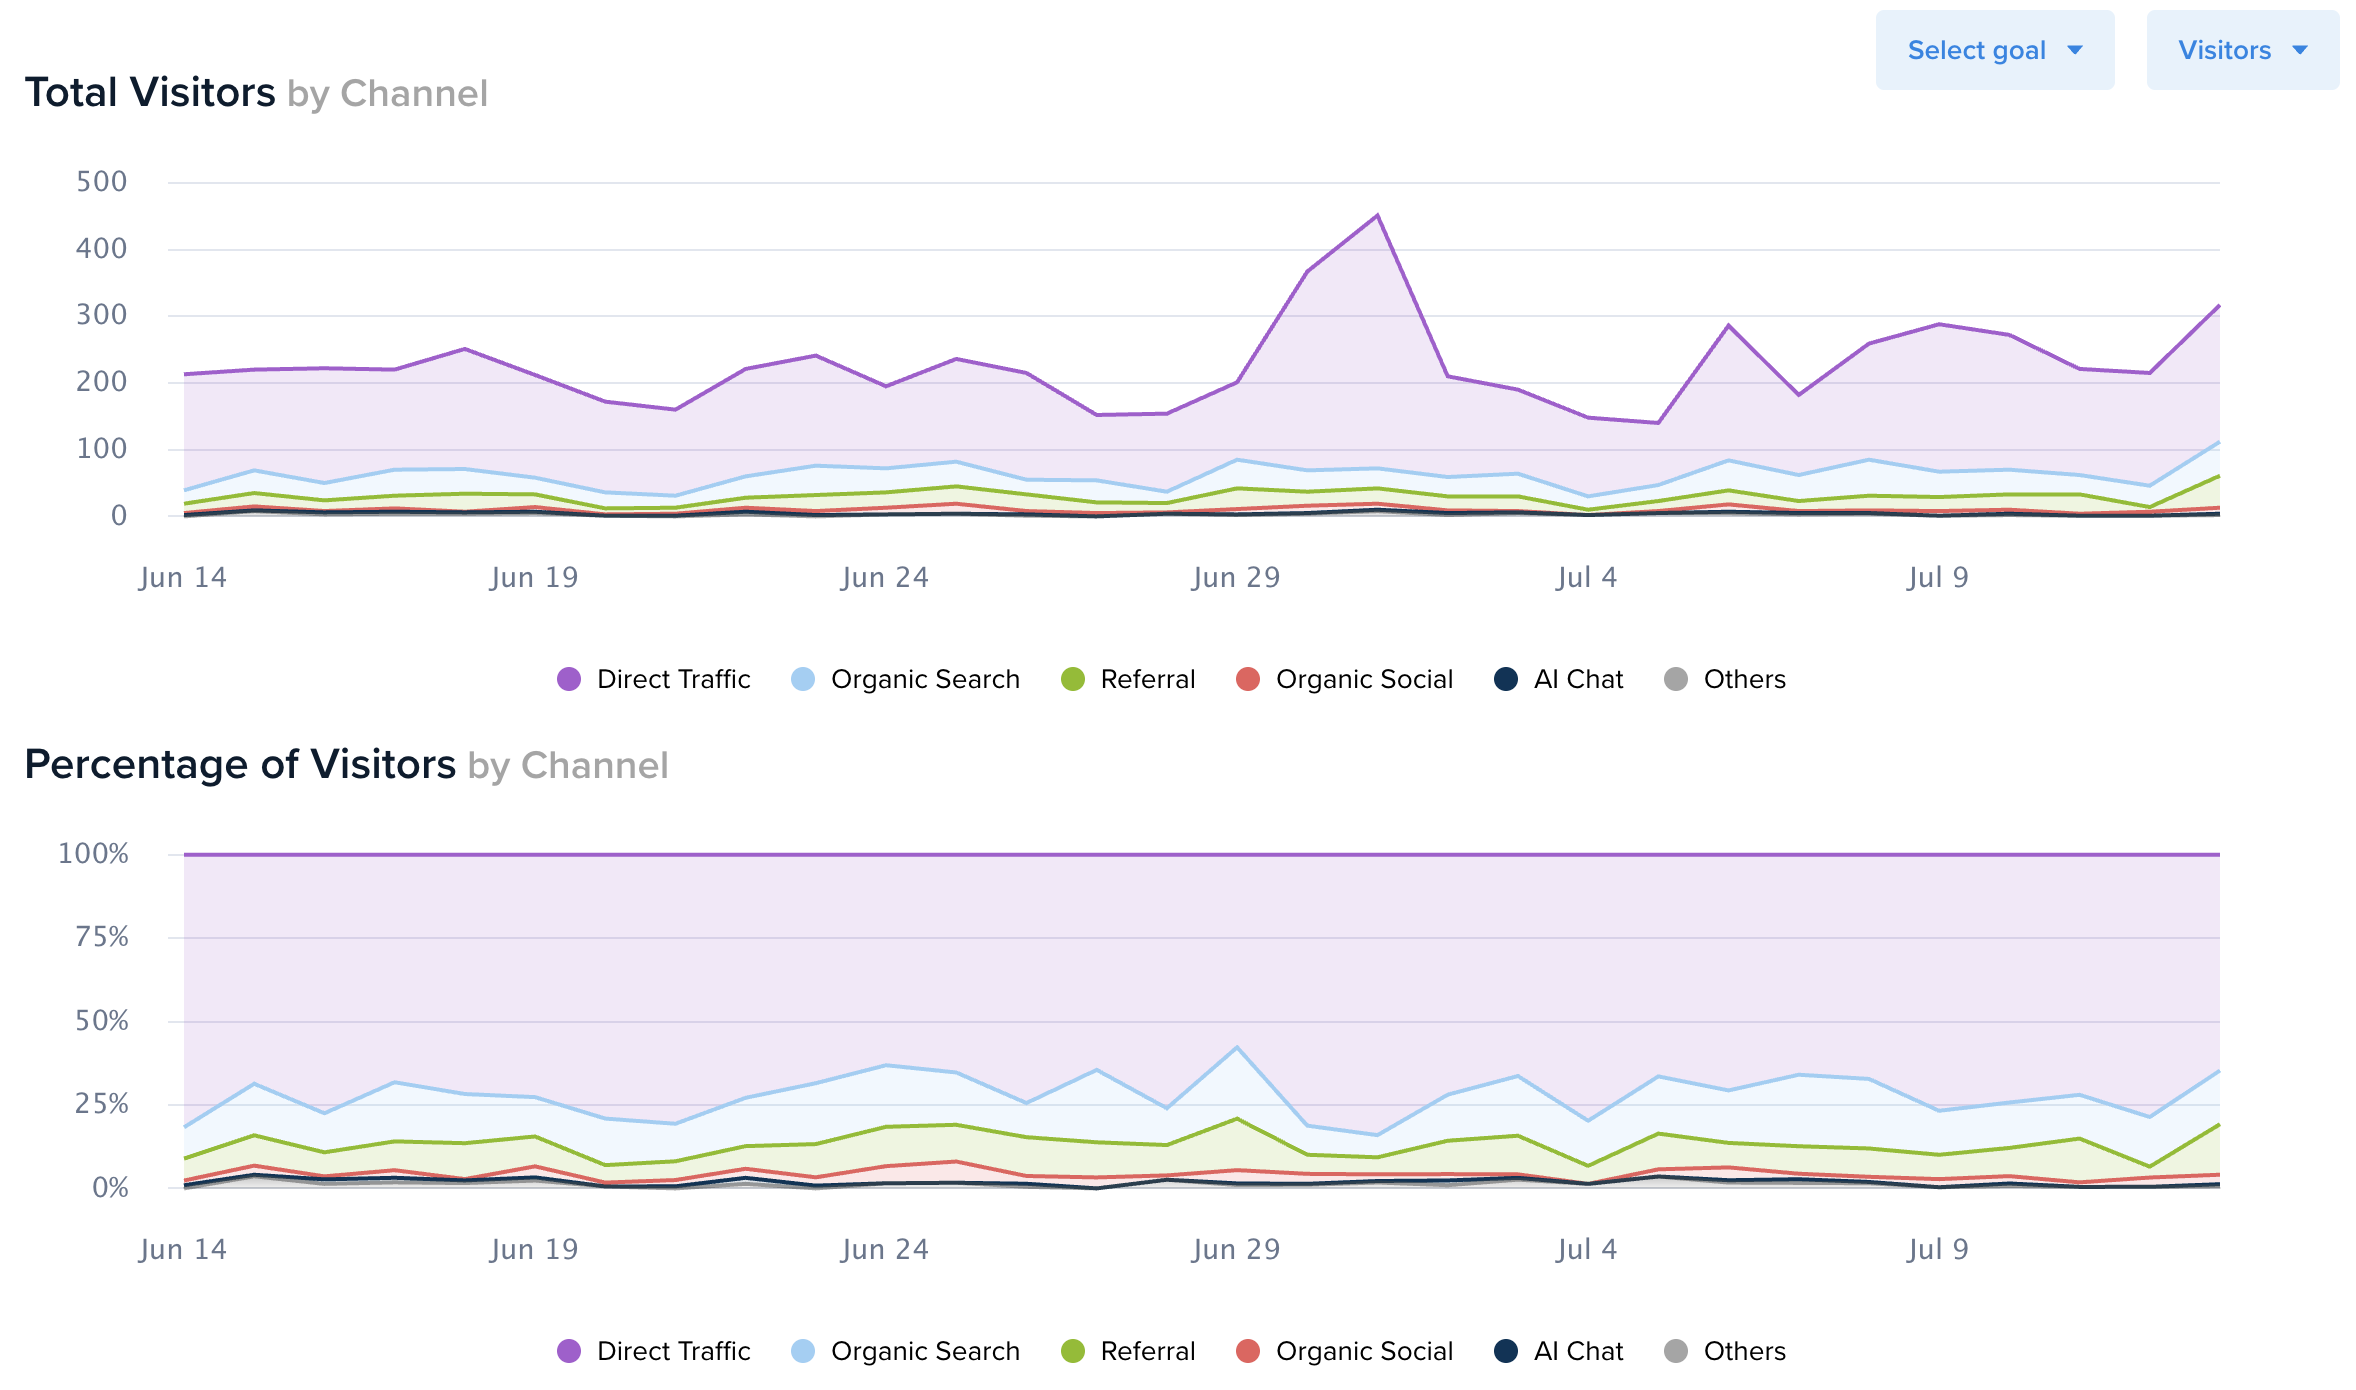
The integration of time-series charts into the Web Analytics dashboard has been designed for immediate accessibility. To utilize the new feature, users must select a date range of at least two days from the primary dashboard. Upon clicking the expansion button (represented by a “>” icon) for any specific audience segment, the interface now reveals two distinct charts positioned above the existing data tables. These charts provide a chronological view of user behavior, allowing for a comparative analysis of historical performance.
To further refine the visualization, Crazy Egg has included a dropdown menu in the top-right corner of the reporting interface. This allows users to toggle between three primary metrics: Total Visitors, Sessions, and Pageviews. This flexibility ensures that analysts can tailor their view to the specific Key Performance Indicators (KPIs) relevant to their current objectives, whether they are focused on reach (visitors) or engagement depth (pageviews).
Beyond simple traffic volume, the update introduces a sophisticated overlay for conversion tracking. By selecting a predefined Conversion Goal from the menu, users can see a dual-axis chart where conversion counts are plotted against traffic metrics. The charts overlay the number of daily conversions, utilizing a secondary Y-axis on the right side for scale. This functionality is critical for determining the "quality" of traffic segments over time, revealing whether a spike in traffic from a specific social media campaign, for example, actually resulted in a corresponding increase in sign-ups or purchases.
Contextualizing the Evolution of Behavioral Analytics
The move toward granular, time-based reporting reflects a broader shift in the digital marketing industry. For years, the industry relied heavily on "vanity metrics"—total pageviews or bounce rates—without the context of time or segmentation. However, as the digital landscape has become more fragmented and privacy regulations like GDPR and CCPA have limited the scope of third-party tracking, the value of first-party behavioral data has skyrocketed.
Crazy Egg’s decision to enhance its Web Analytics tool comes at a time when many businesses are seeking alternatives or supplements to Google Analytics 4 (GA4). Since the transition to GA4, many users have reported a steep learning curve and a lack of intuitive visualization for day-to-day segment tracking. By integrating these charts directly into a user-friendly dashboard, Crazy Egg is positioning itself as a more accessible solution for mid-market businesses and marketing teams that require actionable insights without the need for a dedicated data science department.
Historically, Crazy Egg was known primarily for its "Snapshot" reports, which included Heatmaps, Scrollmaps, and Confetti reports. The expansion into a full Web Analytics suite represents the company’s effort to provide an end-to-end optimization ecosystem. The addition of time-series data for segments is a logical progression in this strategy, bridging the gap between "what" users are doing (heatmaps) and "when" and "where" they are coming from (time-series analytics).
Strategic Implications for Digital Marketers
The introduction of segment-specific time-series charts offers several strategic advantages for various roles within a marketing organization. For Search Engine Optimization (SEO) specialists, the ability to track organic traffic segments day-by-day allows for a clearer understanding of how algorithm updates or content refreshes impact site performance over a specific duration. If a particular landing page sees a sudden drop in organic visitors, the time-series chart can pinpoint the exact day the decline began, allowing the team to correlate the event with external factors.
Paid Media managers also stand to benefit significantly. By segmenting traffic by "Campaign" or "Source/Medium," they can monitor the decay of ad performance over time. The conversion overlay is particularly useful here; it can demonstrate whether an ad group is becoming less efficient as the week progresses, potentially signaling "ad fatigue" among the target audience. This data enables more agile budget reallocations, ensuring that spend is directed toward the highest-performing segments in real-time.
For User Experience (UX) designers, these charts provide a window into how site changes affect different types of users. If a website undergoes a mobile-responsive redesign, the designer can isolate the "Mobile" segment and observe if the pageviews per session or conversion rates trend upward in the days following the launch. This provides empirical evidence of the success or failure of design iterations.
Data Portability and Reporting
Recognizing the need for external reporting and deeper data manipulation, Crazy Egg has ensured that all new metrics are fully exportable. Users can download the daily breakdown of traffic metrics by clicking the “Export” button located next to the date range selector. The data is provided in a spreadsheet format (.xlsx), which is compatible with major business intelligence tools and data visualization platforms like Microsoft Excel, Google Sheets, and Tableau.
This commitment to data portability is a key factor for agencies that manage multiple clients. The ability to quickly export segmented, time-series data into a client-ready report reduces the manual labor involved in data aggregation. It also allows for the creation of custom internal dashboards that can combine Crazy Egg data with other business metrics, such as CRM data or offline sales figures.
Industry Reaction and Market Context
While Crazy Egg has not released official statements from external partners regarding this specific update, industry analysts suggest that the move is a defensive and offensive play in the competitive CRO market. Competitors like Hotjar, VWO, and Contentsquare have also been investing heavily in "experience analytics." By adding time-series segments, Crazy Egg is ensuring it remains a comprehensive tool that satisfies the requirements of both high-level executive reporting and granular technical analysis.
Preliminary feedback from the digital marketing community indicates a positive reception to the simplification of complex data. Many "power users" of analytics have noted that while tools like BigQuery allow for this type of analysis, having it "out of the box" within the Crazy Egg interface saves hours of configuration and query writing. The consensus among early adopters is that this update makes the Web Analytics dashboard a daily-use tool rather than a weekly or monthly check-in point.
Timeline of Recent Crazy Egg Innovations
The release of Segmented Web Analytics over time is the latest in a series of updates aimed at modernizing the Crazy Egg platform. Over the past 24 months, the company has introduced:
- Enhanced Survey Tools: Allowing for qualitative feedback to complement quantitative heatmaps.
- Error Tracking: Identifying JavaScript errors that occur during user sessions to help developers fix bugs that hinder conversions.
- Advanced Filtering in Recordings: Enabling users to filter session replays by specific user actions, such as "rage clicks" or "dead clicks."
- Priority Support for All Plans: A shift in customer service strategy to ensure users can maximize the utility of the platform’s growing feature set.
This latest update is currently available to all Crazy Egg subscribers, regardless of their plan level. The company has confirmed that there is no additional cost associated with the new time-series charts, a move that reinforces its value proposition in an increasingly expensive SaaS environment.
Analysis of Broader Implications
The democratization of time-series data signals a trend where analytics platforms are moving away from being mere "data collectors" to becoming "insight generators." By automatically plotting trends and allowing for easy overlays of conversion data, Crazy Egg is reducing the cognitive load on the user. This allows marketing teams to focus on strategy and execution rather than data processing.
Furthermore, as the industry moves toward a "cookieless" future, the ability to analyze cohorts and segments based on session-level data—rather than individual user tracking—becomes more vital. Crazy Egg’s approach to segmentation is largely privacy-centric, focusing on how groups of users interact with the site, which aligns with modern standards of data ethics.
In conclusion, the addition of time-series charts to Crazy Egg’s Web Analytics represents a significant milestone for the platform. It provides users with the visual tools necessary to diagnose performance issues, validate marketing hypotheses, and optimize the user journey with a level of precision that was previously difficult to achieve within the dashboard. As digital competition intensifies, the ability to see not just who is on a site, but how their behavior trends over time, will likely become a standard requirement for any successful online business. All users are encouraged to visit their Web Analytics dashboard to explore these new features and begin leveraging more granular data for their optimization efforts.







