

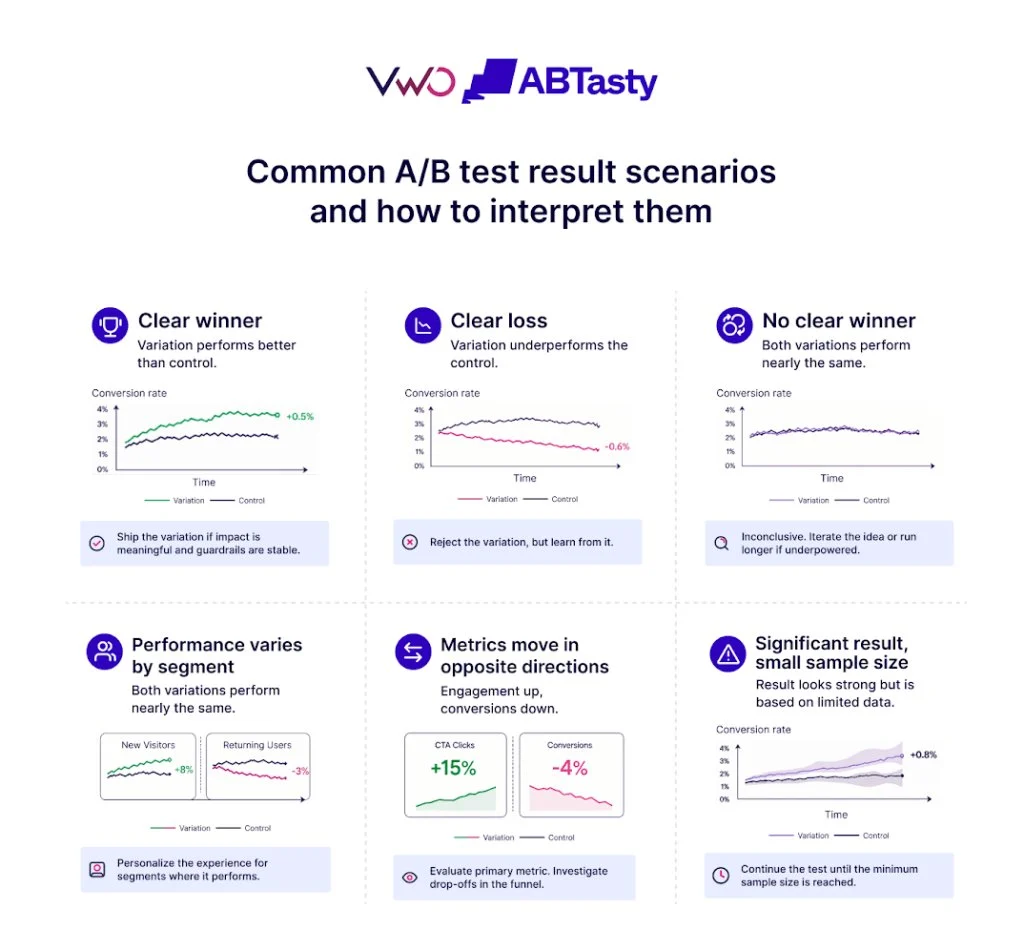
In the rapidly evolving landscape of digital optimization, the ability to accurately interpret A/B test results has become a foundational pillar for successful product management and marketing strategy. While modern experimentation software provides a streamlined interface for launching tests, the final "winner" or "loser" label generated by a dashboard often masks a complex layer of statistical nuance and behavioral psychology. Industry experts suggest that the difference between a successful growth strategy and a series of costly implementation errors lies not in the software itself, but in the rigorous analytical framework applied to its output. To derive true value from experimentation, organizations must move beyond surface-level metrics and adopt a multi-layered approach that includes statistical validation, business impact assessment, and deep behavioral analysis.
The Foundation of Modern Experimentation: Understanding the Statistical Engine
At the heart of every A/B testing platform lies a statistical model designed to determine whether the difference in performance between two variations is a result of a specific change or merely the product of random chance. Most contemporary tools utilize one of two primary frameworks: Frequentist or Bayesian statistics. Understanding the distinction between these two is critical for any analyst.
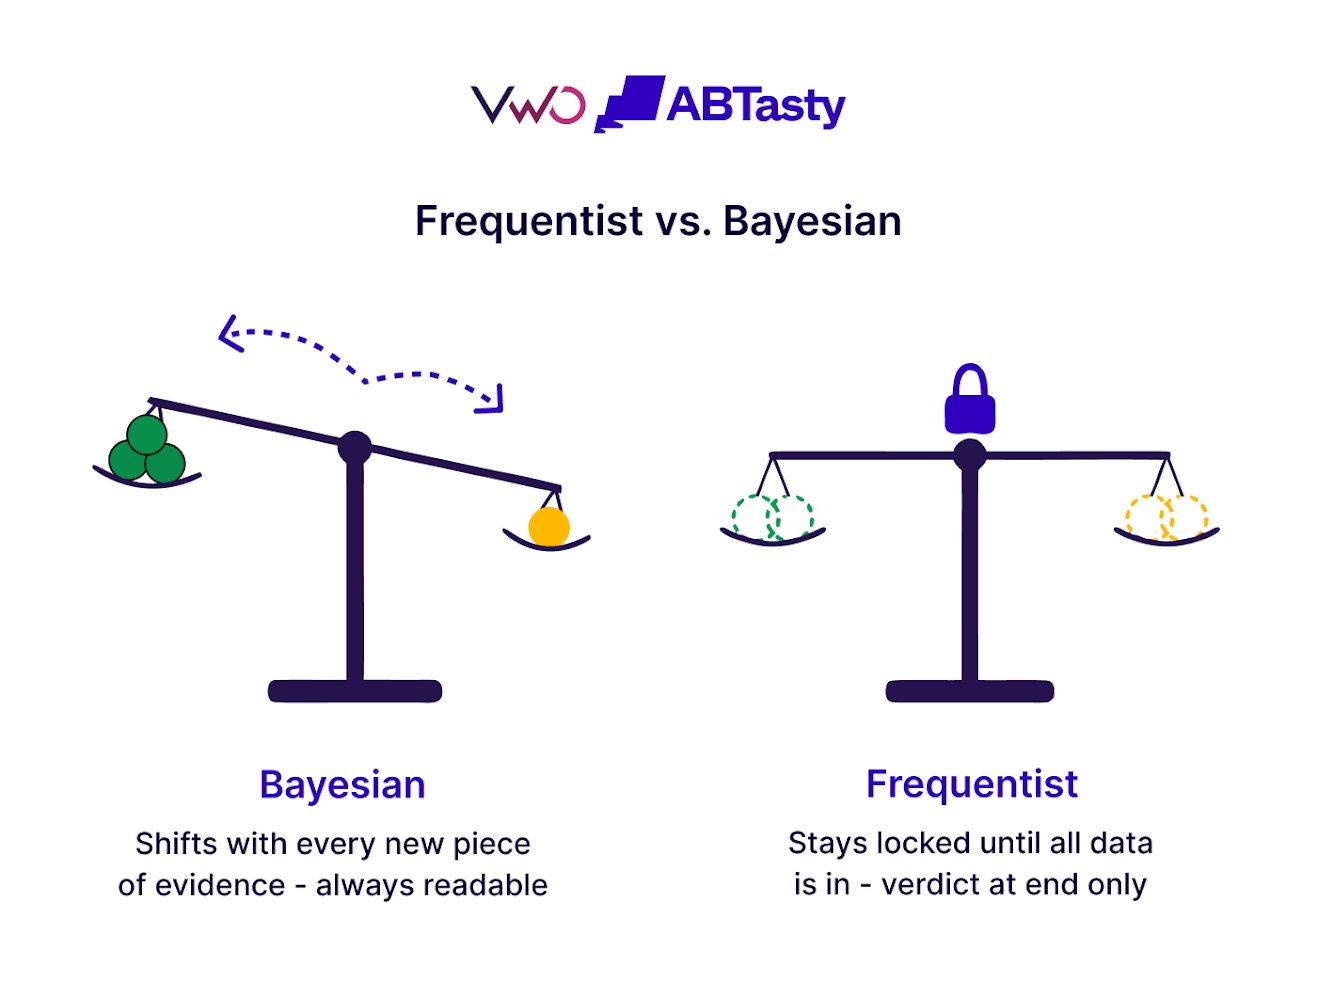
Frequentist testing, the traditional standard in scientific research, operates on the concept of a "null hypothesis," which assumes there is no difference between the control and the variation. The output, often expressed as a p-value, calculates the probability of observing the test results if the null hypothesis were true. A 95% confidence level—the industry benchmark—implies a 5% risk of a false positive, meaning the test might indicate a win when none exists.
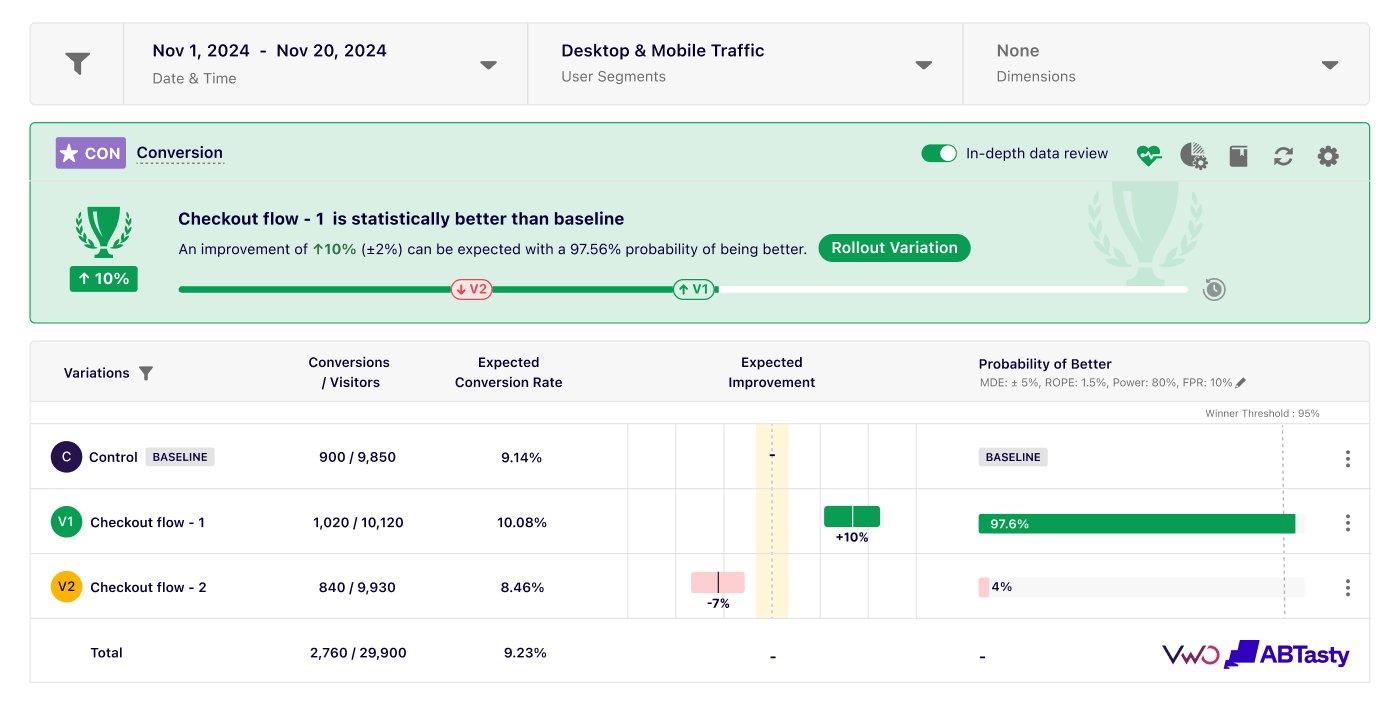
Conversely, the Bayesian approach, utilized by platforms like VWO’s SmartStats, offers a more intuitive perspective for business stakeholders. It calculates the "probability of being best," providing a continuous estimate of which variation is likely to outperform the other based on the data collected. This model allows for more flexible decision-making, as it provides a clearer picture of the magnitude of the potential gain and the associated risk, rather than a binary "significant or not" result.
A Chronology of a Successful Experimentation Cycle
The interpretation of results does not begin when a test ends; it is a process that spans the entire lifecycle of an experiment. To ensure data integrity, organizations should follow a structured timeline:
- Pre-Test Calibration: Before a single visitor is enrolled, analysts must define the primary metric, secondary guardrail metrics, and the minimum detectable effect (MDE). This prevents "data dredging" later in the process.
- The Monitoring Phase: During the first few days of a test, the primary focus is on technical health. Analysts monitor for "Sample Ratio Mismatch" (SRM), which occurs when the traffic split between variations is uneven, signaling a potential bug in the test implementation.
- The Business Cycle Threshold: A common error in the industry is "peeking"—stopping a test as soon as it reaches statistical significance. Experts recommend running tests for at least one to two full business cycles (typically 14 to 28 days) to account for day-of-the-week fluctuations and different user cohorts.
- The Post-Test Deep Dive: Once the required sample size and duration are met, the focus shifts to segmentation. This involves breaking down the aggregate data by device type, traffic source, and user history to identify if the "winner" performed consistently across all demographics.
The Seven-Step Framework for Rigorous Interpretation
To standardize the transition from data to action, leading growth teams employ a seven-step validation process. This framework ensures that "ship" decisions are backed by both statistical stability and business logic.
Step 1: Duration and Sample Size Validation
The first check is purely quantitative. A result that appears significant on a small sample is often a "false positive" driven by an early spike in conversions. Analysts must confirm that the pre-calculated sample size has been reached and that the test has endured the natural ebbs and flows of a full business week.
Step 2: Statistical Significance vs. Stability
Significance tells you a result is likely real; stability tells you it will last. By observing the "confidence interval" over time, analysts can see if the lift is narrowing toward a specific point or fluctuating wildly. A stable, narrow interval provides the highest degree of certainty for implementation.
Step 3: Economic Impact Assessment
A 2% lift in click-through rate may be statistically significant, but if it does not translate to a meaningful increase in revenue or a decrease in acquisition costs, it may not be worth the engineering resources required to deploy it. Organizations must translate percentage lifts into dollar amounts or lead volume based on current traffic levels.
Step 4: Accounting for External Variables
External factors—such as a concurrent holiday sale, a site-wide technical glitch, or a competitor’s marketing campaign—can skew results. If a test was active during a "Black Friday" event, the results may not be replicable during a standard Tuesday in March.
Step 5: Granular Segmentation
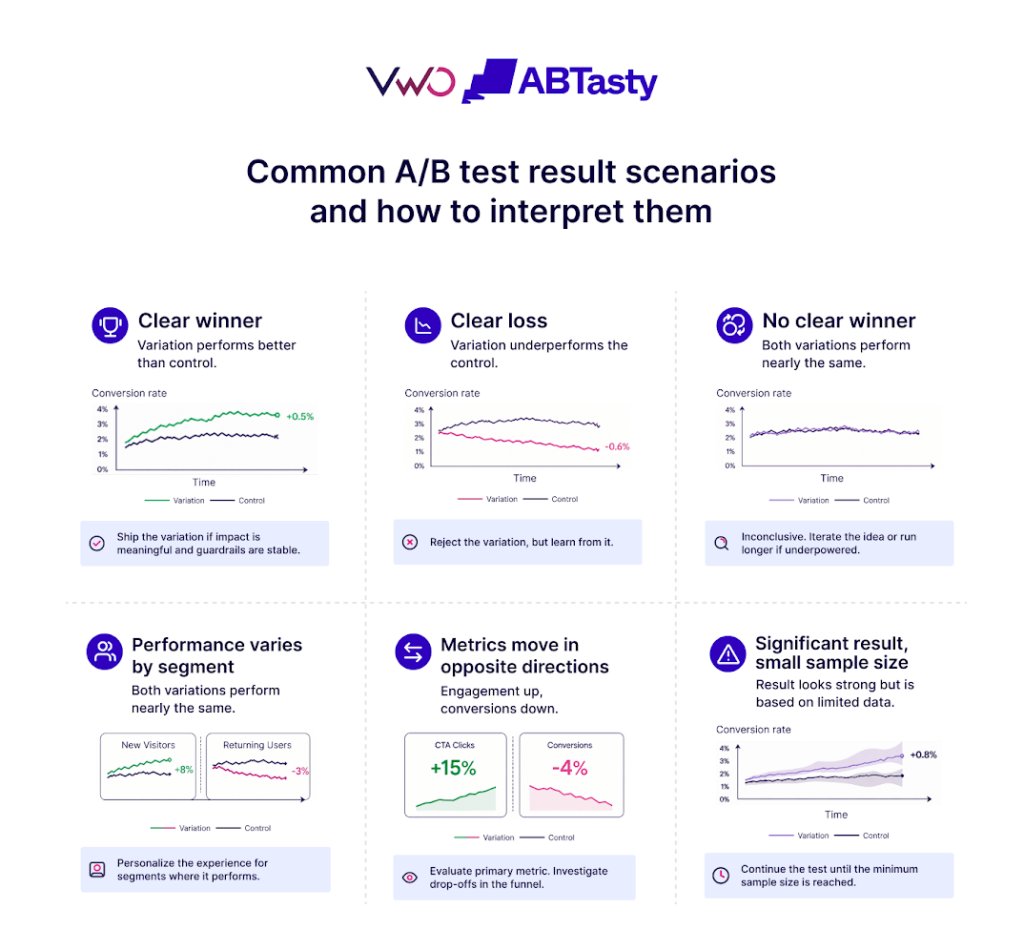
Aggregate results can be misleading. A redesign might be a massive winner on desktop but a failure on mobile. By segmenting the results, teams can discover that a "flat" result actually contains a high-performing variation for a specific high-value audience, such as returning subscribers or organic search visitors.
Step 6: Behavioral Validation
Numbers describe what happened, but behavioral data explains why. By integrating heatmaps, session recordings, and scroll maps into the analysis, teams can see if users are interacting with a new CTA as intended or if they are clicking it out of confusion. This qualitative layer is the bridge between data and insight.
Step 7: Documentation and Iteration
Every test, regardless of the outcome, must be documented. A "lost" test is often more valuable than a win because it refutes a hypothesis about user behavior. Documentation creates a "knowledge base" that prevents the organization from testing the same failed ideas repeatedly.
Comparative Analysis of Leading Experimentation Platforms
The choice of software significantly impacts how results are presented and interpreted. While the core goals are similar, the underlying technology differs across the market leaders:

- VWO (Visual Website Optimizer): VWO’s SmartStats engine uses Bayesian logic to provide real-time recommendations. Its integrated tech stack allows users to jump directly from a statistical report to session recordings of the users in that specific variation, facilitating rapid behavioral validation.
- Optimizely: Known for its "Stats Engine," Optimizely uses sequential testing to solve the "peeking problem." This allows stakeholders to check results at any time without increasing the risk of false positives, making it a favorite for agile product teams.
- GrowthBook: This open-source platform offers the unique ability to switch between Frequentist and Bayesian engines. It is designed to sit on top of an existing data warehouse, making it a powerful tool for companies that want to maintain full control over their raw data.
- Statsig: Focusing heavily on product features and "gatekeeping," Statsig provides a "Scorecard" view that automatically flags how a new feature impacts a wide array of secondary metrics, ensuring that a win in one area doesn’t cause a regression elsewhere.
Expert Perspectives on the Value of Failure
The psychological aspect of testing is often overlooked. Vinayak Purshan, Associate Marketing Director at Cashfree Payments, emphasizes that a culture of experimentation requires the acceptance of loss. "We should have this in our mind, that not every test will win," Purshan noted in a recent industry discussion. "The moment you think all tests will pass, you lose the ability to run critical experiments because of the fear of failure."
Similarly, optimization expert Haley Carpenter advocates for the "iteration mindset." She suggests that even when a winner is found, the work is not done. The goal is to understand the "why" and then run follow-up variations to see if the lift can be further amplified. This approach transforms A/B testing from a series of one-off bets into a continuous cycle of learning.
Broader Implications for Corporate Strategy
The move toward sophisticated A/B test interpretation represents a broader shift in corporate decision-making. In the past, product changes were often driven by the "HiPPO" (Highest Paid Person’s Opinion). Today, the democratization of data allows for a more meritocratic approach to growth.
However, the risk of "misinformation through data" is real. When organizations prioritize speed over statistical rigor, they often end up "chasing ghosts"—implementing changes based on false positives that eventually lead to a "death by a thousand cuts" where the site becomes cluttered with features that don’t actually drive value.
By adhering to a strict interpretation protocol, companies can ensure that their experimentation program is a profit center rather than a source of confusion. The ultimate goal of software-driven testing is not just to find a winner, but to build a deeper, data-backed understanding of the customer journey. As the digital marketplace becomes increasingly competitive, the organizations that master the art and science of result interpretation will be the ones that achieve sustainable, long-term growth.







