

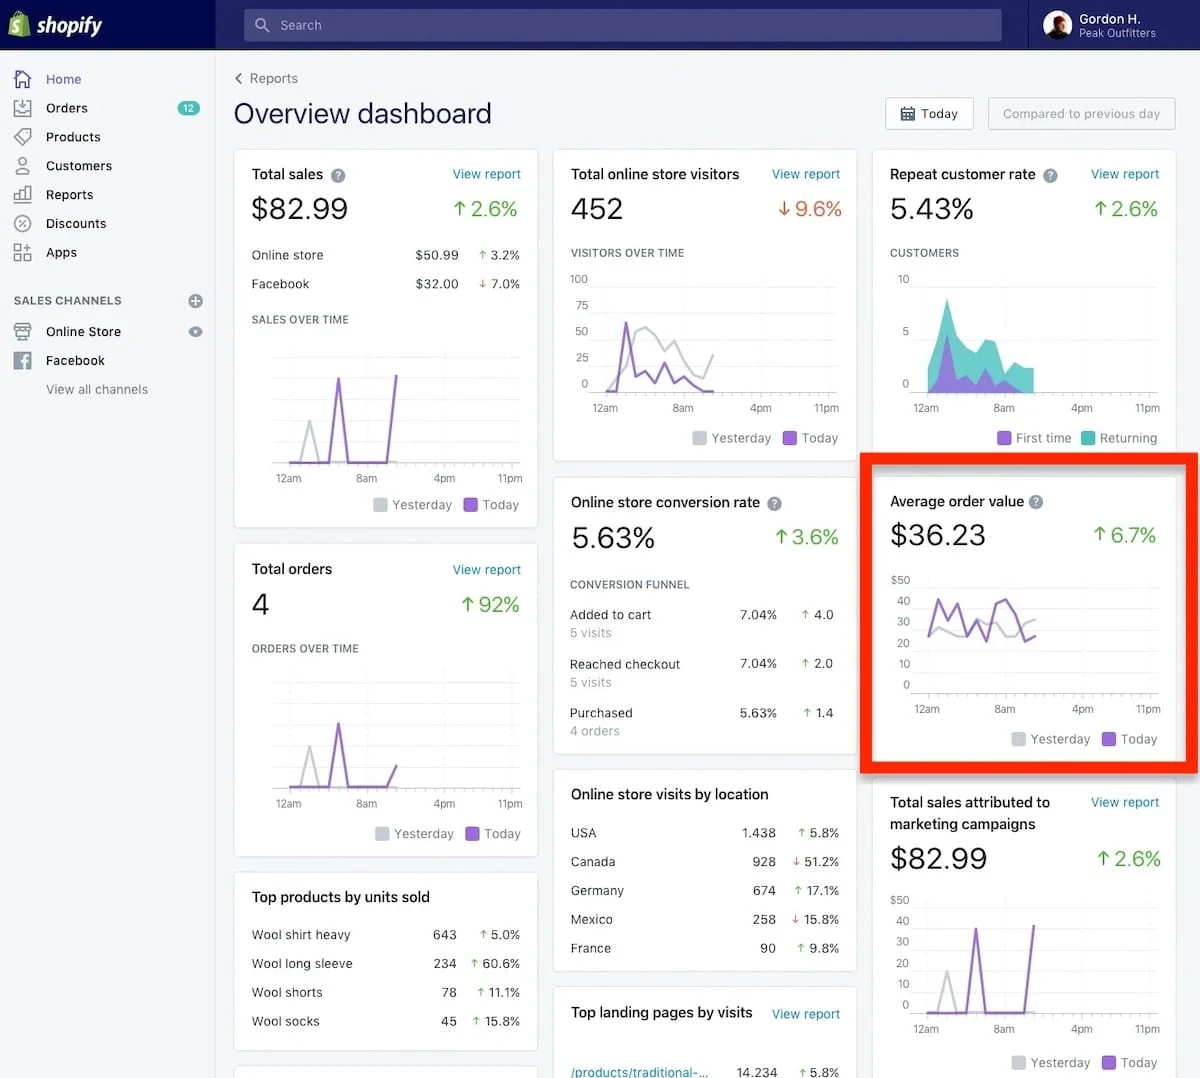
Conversion Rate Optimization (CRO) has evolved from a niche digital marketing tactic into a fundamental pillar of corporate strategy, serving as the bridge between raw web traffic and bottom-line revenue. As businesses navigate an increasingly competitive digital landscape, the ability to distinguish between mere data points and actionable Key Performance Indicators (KPIs) has become a critical skill for marketing executives, product managers, and data analysts alike. CRO KPIs are the essential metrics used to determine whether modifications to a digital interface—ranging from minor headline adjustments to complete checkout overhauls—are yielding tangible business results.
A robust CRO KPI serves three primary functions: it provides a clear indication of success or failure for specific tests, it aligns digital behavior with broader organizational goals, and it offers a diagnostic lens through which user friction can be identified and mitigated. While standard web metrics provide a snapshot of user activity, a true KPI measures the outcomes that drive growth, such as lead quality, average order value, and long-term customer acquisition.
The Critical Distinction: CRO Metrics vs. CRO KPIs
In the realm of digital analytics, the terms "metric" and "KPI" are frequently used interchangeably, yet they represent distinct layers of data interpretation. A metric is any quantitative measurement of user behavior on a website. Common examples include bounce rates, scroll depth, click-through rates on specific buttons, and pageviews. These are valuable for diagnosing technical issues or understanding general engagement, but they do not inherently reflect the health of a business.
Conversely, a KPI is a curated metric that directly correlates with a business objective. For an e-commerce platform, a high click-through rate on a product image is a metric, but the purchase conversion rate is a KPI. For a Software-as-a-Service (SaaS) provider, a form start is a metric, whereas the trial-to-paid conversion rate is a KPI. The distinction is vital for resource allocation; tracking too many metrics can lead to "analysis paralysis," while focusing on the wrong KPIs can result in optimizations that improve engagement without increasing revenue.
Core KPIs for Revenue and Conversion Measurement
The most immediate indicators of CRO success are those tied directly to the transaction or the primary conversion event. These KPIs provide the highest level of visibility into the effectiveness of a digital funnel.
1. Purchase Conversion Rate
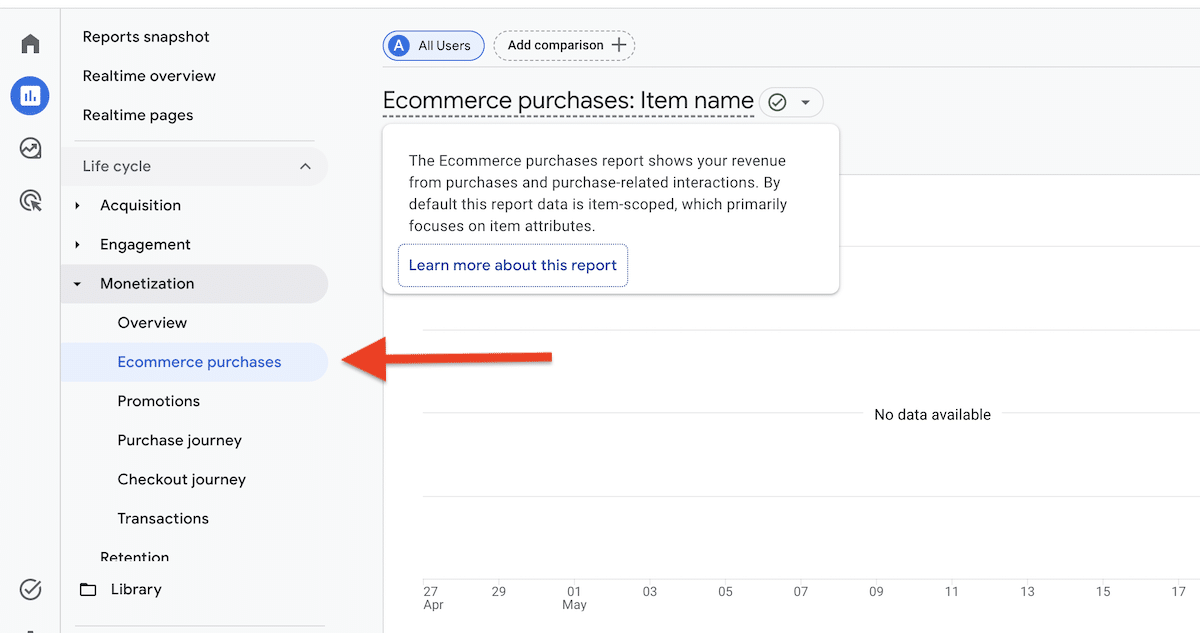
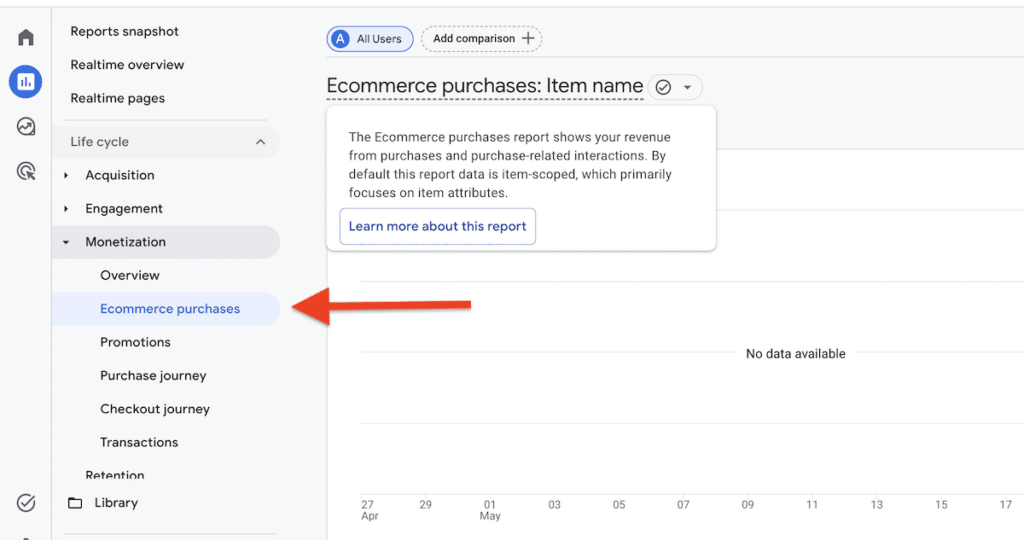
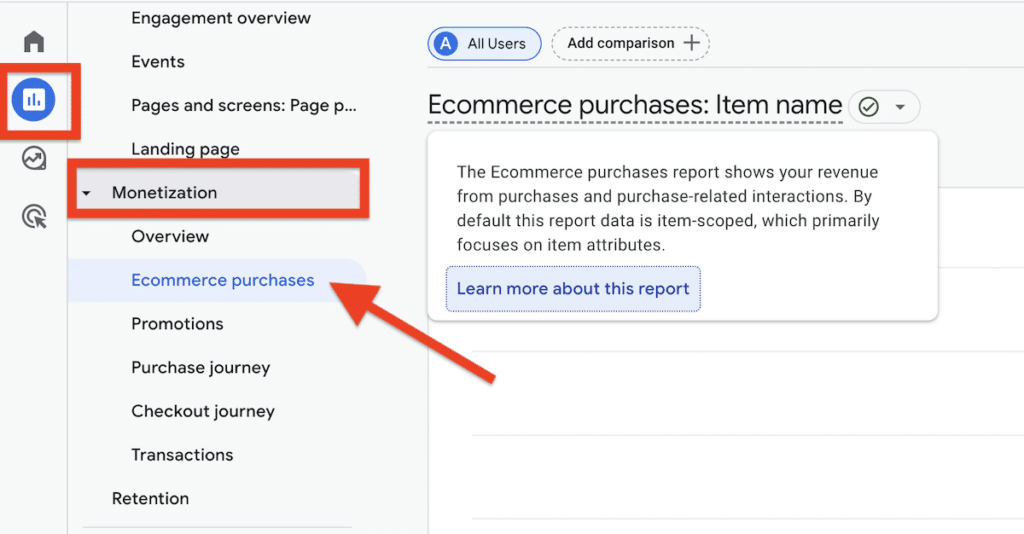
The conversion rate remains the primary benchmark for most digital enterprises. Calculated by dividing the number of successful conversions by the total number of visitors and multiplying by 100, this KPI offers a direct percentage of the audience taking the desired action. In the modern analytics era, specifically with the transition to Google Analytics 4 (GA4), tracking this involves identifying "Key Events" that represent significant business milestones.
2. Revenue Per Visitor (RPV)
RPV is a sophisticated KPI that combines conversion rate and order value into a single metric. By dividing total revenue by total visitors, businesses can determine the average worth of every person who lands on the site. This is particularly useful for assessing the quality of incoming traffic and the overall efficiency of the monetization strategy. If a website’s conversion rate remains steady but RPV increases, it indicates that the optimization efforts are successfully encouraging visitors to spend more.
3. Average Order Value (AOV)
AOV measures the average dollar amount spent each time a customer places an order. This KPI is indispensable when testing upselling and cross-selling strategies, shipping thresholds, or product bundling. An increase in AOV often signifies that the website is effectively communicating the value of premium products or successfully incentivizing larger purchases.
4. Lead and Trial Acquisition Rates
For B2B and SaaS companies, the "sale" rarely happens on the first visit. Instead, the website’s primary function is to capture leads or initiate trials. Tracking the demo booking rate or trial signup rate allows these organizations to measure the effectiveness of their value propositions and landing page designs before the lead enters the long-term sales cycle.
Analyzing the Funnel: Behavioral KPIs and Friction Points
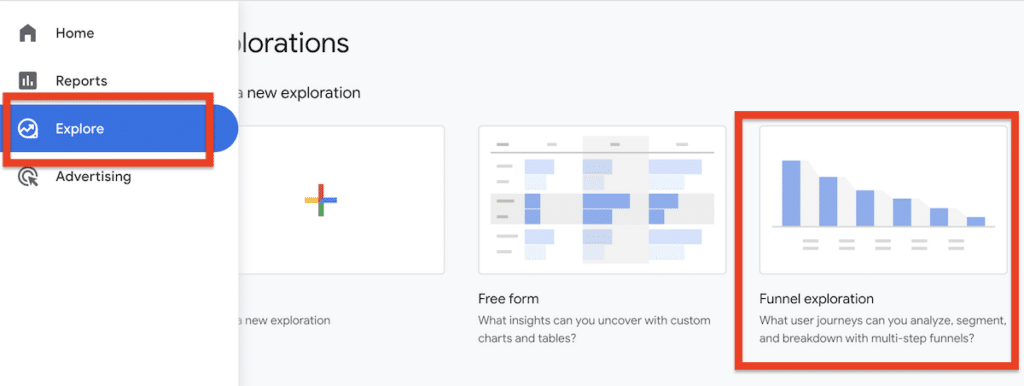
To understand why a conversion rate is fluctuating, analysts must look deeper into the user journey. Funnel KPIs identify exactly where potential customers are dropping off, allowing for targeted interventions.
Add-to-Cart and Cart-to-Checkout Rates
The add-to-cart rate is a primary indicator of product page effectiveness. If visitors are reaching product pages but not adding items to their carts, the issue likely lies in product descriptions, imagery, pricing, or social proof. Moving further down the funnel, the cart-to-checkout rate measures the transition from interest to intent. High abandonment at this stage often points to friction in the cart experience, such as unexpected shipping costs or a lack of trust signals.
Checkout and Form Completion Rates
The final hurdles in any conversion journey are the checkout process and lead forms. The checkout completion rate isolates the efficiency of the payment and shipping selection steps. According to industry research, forced account creation and overly complex forms are the leading causes of checkout abandonment. Similarly, the form completion rate measures the ratio of users who start a form versus those who submit it. This KPI is essential for identifying "field fatigue," where excessive data requests discourage users from finishing the process.
The Shift Toward Lead Quality in B2B Environments
In the B2B sector, volume is often a secondary concern to quality. A landing page that generates 1,000 low-quality leads is significantly less valuable than one that generates 100 highly qualified prospects. Data from HubSpot’s 2024 marketing reports suggests that over 40% of marketers now prioritize lead quality over lead quantity as their primary success metric.
Qualified Lead Rate (QLR)
The QLR measures the percentage of leads that meet specific "fit" and "intent" criteria. This requires a unified definition of a "Qualified Lead" between marketing and sales teams. Factors often include company size, industry, budget, and the authority of the individual contact. If a CRO test increases the total number of leads but decreases the QLR, the test may be considered a failure from a business perspective, as it increases the workload for sales teams without increasing potential revenue.
Lead-to-Opportunity and Lead-to-Customer Rates
These long-term KPIs track the progression of a lead through the entire sales pipeline. Because B2B sales cycles can span months, these metrics require CRM integration (such as Salesforce or HubSpot) to track. The lead-to-opportunity rate confirms whether the marketing-captured leads are substantial enough to warrant a formal sales deal, while the lead-to-customer rate provides the ultimate validation of the website’s contribution to company growth.
A Strategic Framework for Selecting KPIs
Choosing the right KPI for a specific test is as important as the test itself. Organizations that succeed in CRO typically follow a structured framework to ensure their data collection is purposeful.
1. Define the Business Goal: Every initiative must start with a high-level objective, such as "reduce customer acquisition costs" or "increase subscription renewals."
2. Identify the Primary KPI: This is the single metric that will determine the "winner" of an experiment. For a checkout redesign, the primary KPI should be the checkout completion rate.
3. Monitor Diagnostic KPIs: These metrics explain the "why" behind the primary KPI’s movement. If the conversion rate goes up, diagnostic KPIs like "average time on page" or "click-through rate on reviews" can help analysts understand what specifically influenced the change.
4. Establish Guardrail KPIs: Guardrail metrics are a safety mechanism. They ensure that an improvement in one area does not cause a catastrophe in another. For instance, if a company offers a massive discount to boost the conversion rate (Primary KPI), the profit margin (Guardrail KPI) must be monitored to ensure the business remains viable. Microsoft’s research into "Trustworthy Experimentation" emphasizes that guardrail metrics are essential for catching unintended consequences, such as technical bugs or long-term brand damage.
5. Segment the Data: Aggregated data often hides the truth. By segmenting KPIs by traffic source (organic vs. paid), device type (mobile vs. desktop), or user type (new vs. returning), businesses can uncover insights that are invisible at the surface level. A test might be highly successful for mobile users while failing for desktop users; without segmentation, the results would appear neutral, and a growth opportunity would be missed.
Implications and Future Trends in CRO Tracking
The landscape of CRO KPI tracking is undergoing a significant transformation driven by privacy regulations and the rise of Artificial Intelligence. With the deprecation of third-party cookies and the implementation of stricter data privacy laws like GDPR and CCPA, businesses are shifting toward "first-party data" strategies. This makes on-site CRO KPIs even more valuable, as they rely on direct interactions within the brand’s own ecosystem rather than external tracking.
Furthermore, the integration of AI into analytics platforms is allowing for predictive KPI modeling. Instead of simply looking at what happened in the past, modern CRO teams are beginning to use "predictive conversion rates" to identify which users are most likely to convert and tailoring their experiences in real-time.
In conclusion, CRO KPIs are far more than just numbers on a dashboard; they are the strategic compass for digital growth. By moving beyond basic metrics and focusing on high-impact KPIs—while maintaining a rigorous framework of diagnostic and guardrail measurements—organizations can ensure that every change they make to their digital presence is a step toward greater profitability and a better customer experience. The future of digital competition will be won not by those with the most traffic, but by those who best understand and optimize the value of the traffic they already have.







