

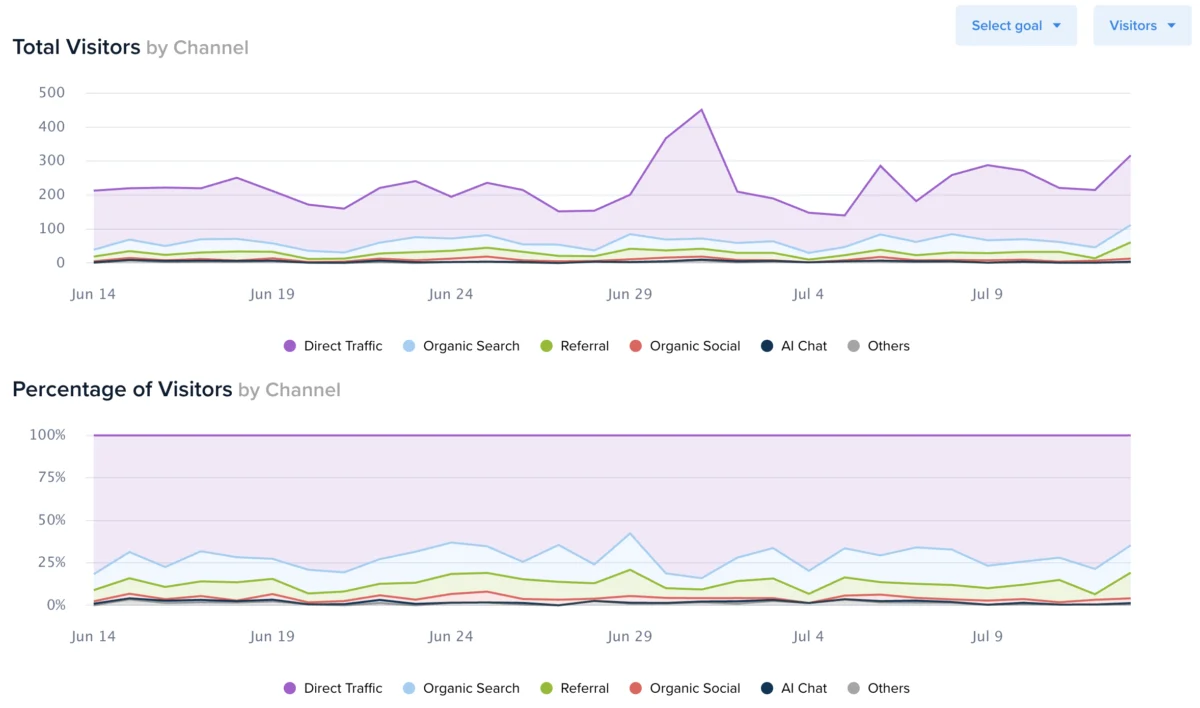
The digital optimization platform Crazy Egg has officially announced a significant upgrade to its Web Analytics suite, introducing dedicated time-series charts for every traffic segment to provide users with a more granular view of day-to-day performance. This update marks a strategic pivot for the company, moving beyond its traditional reputation as a heatmap provider and toward becoming a comprehensive web analytics solution that competes with enterprise-level tools. By allowing users to visualize fluctuations in specific audience segments over time, the platform aims to bridge the gap between high-level traffic data and actionable conversion insights.
Enhancing Data Granularity in Modern Web Analytics
In the current digital landscape, understanding the "how" and "why" behind traffic fluctuations is critical for marketing teams and website owners. The latest feature from Crazy Egg addresses a common pain point in data interpretation: the lack of context in aggregate data. Previously, while users could see which segments performed best over a set period, they lacked a visual timeline to identify exactly when specific changes occurred.
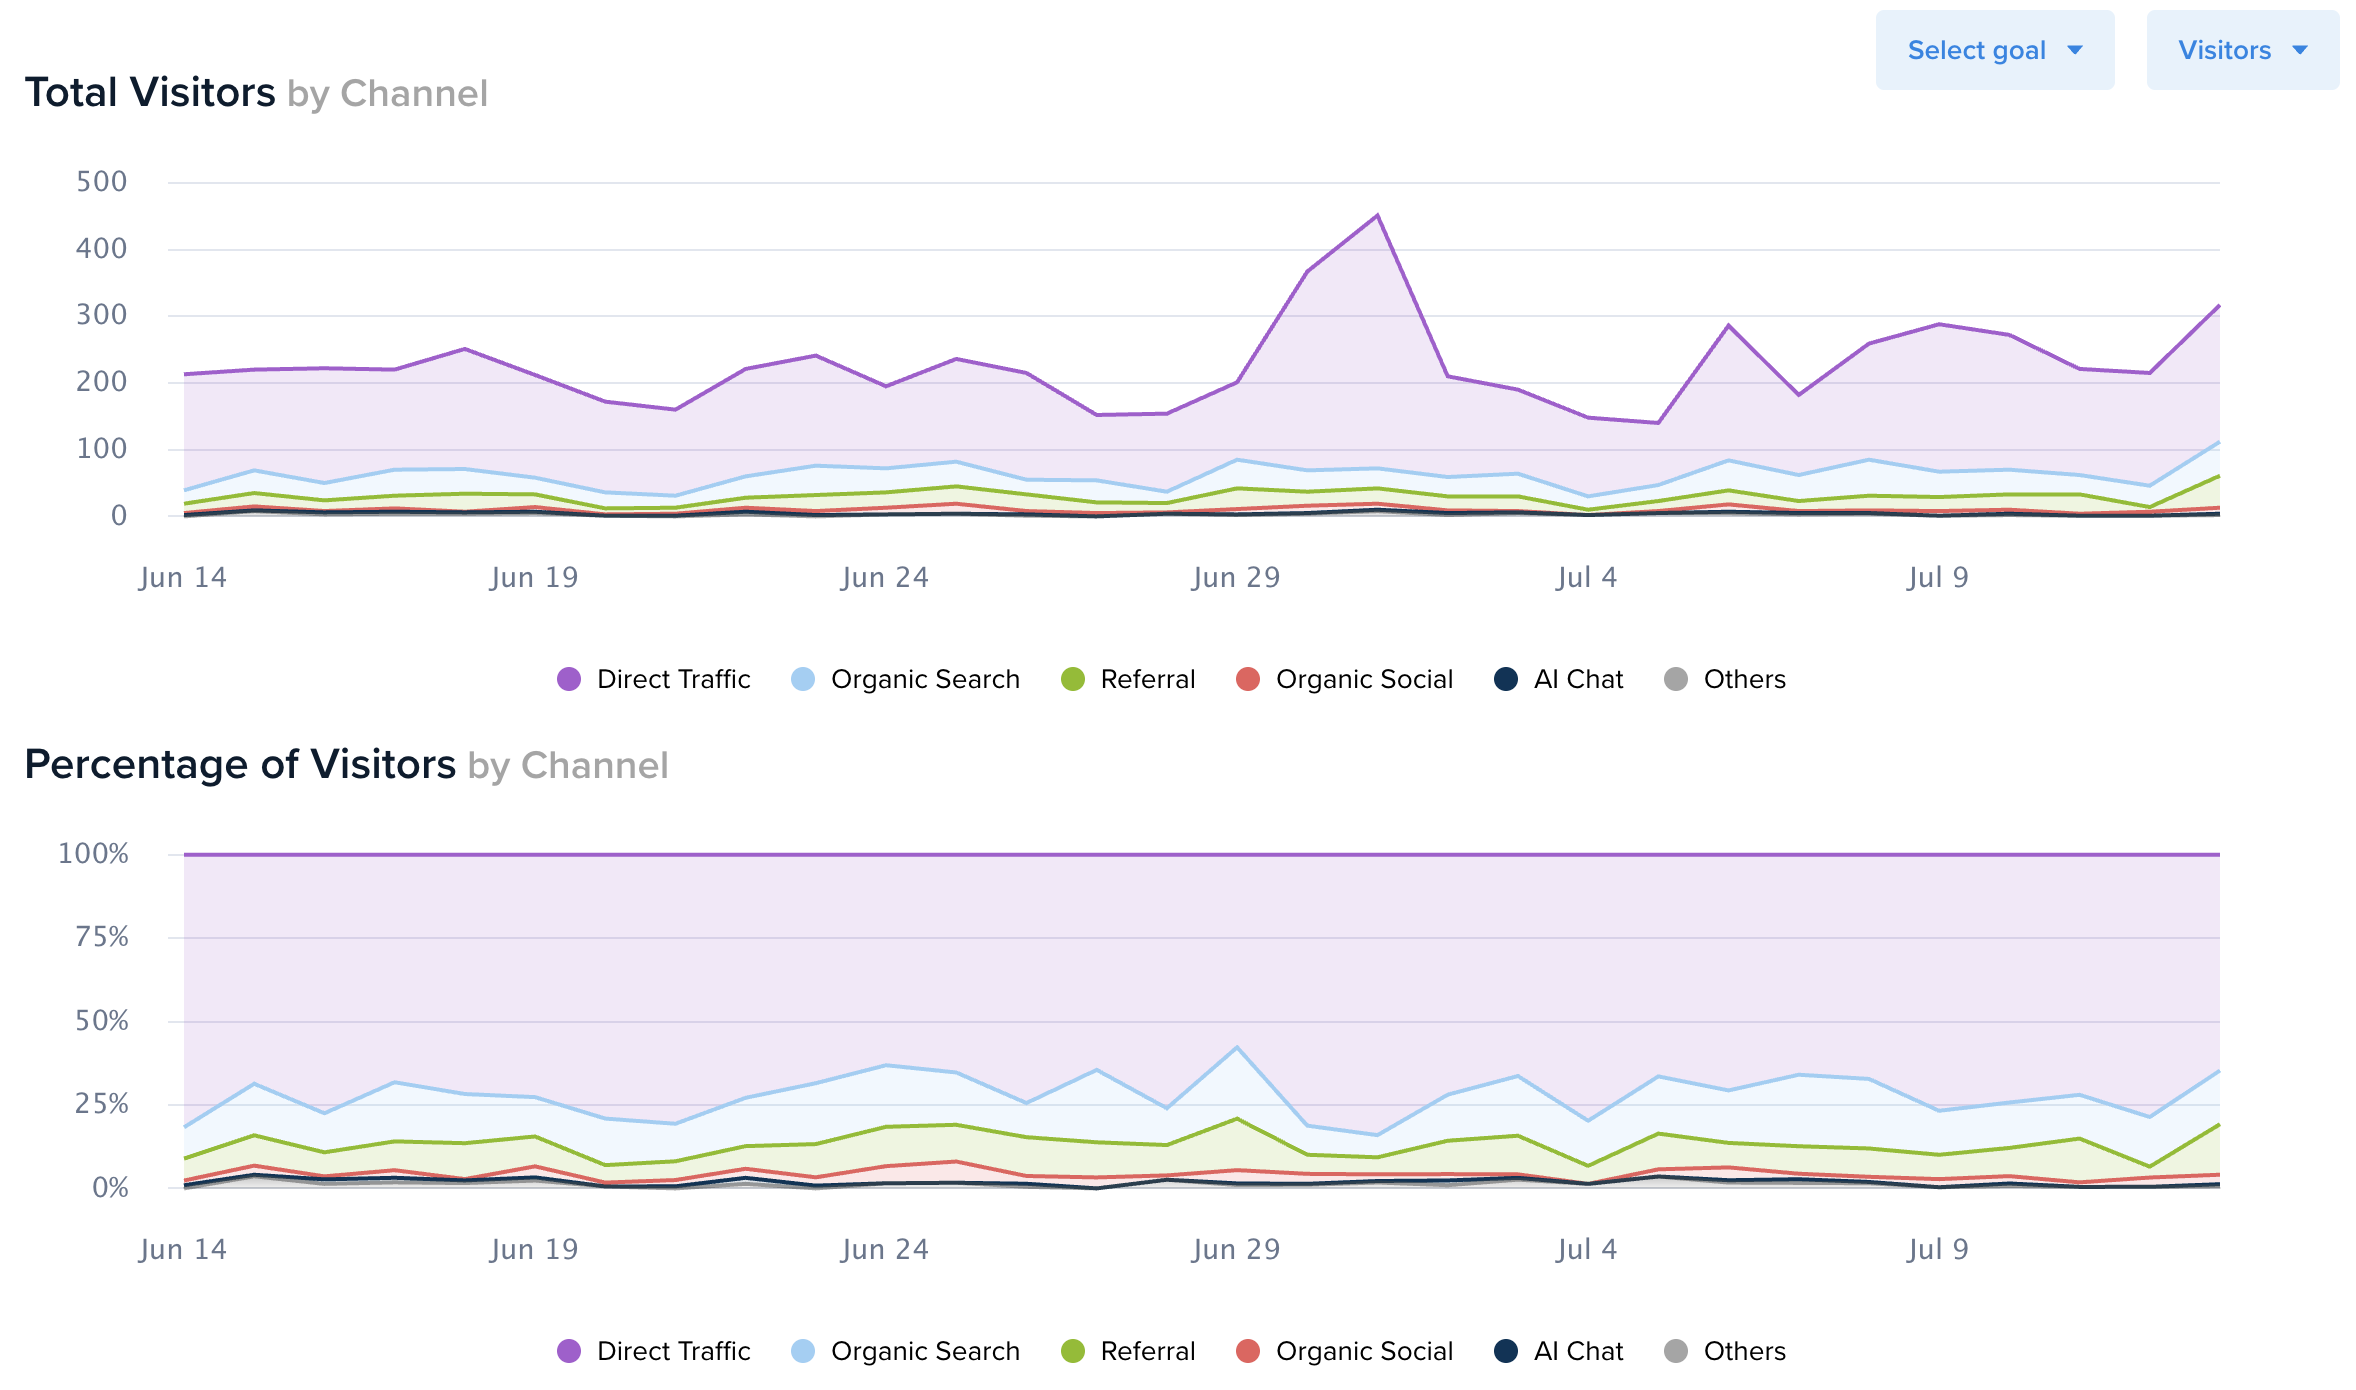
The new time-series charts enable users to visualize when traffic spikes for certain pages, identify which marketing channels are experiencing a decline, and pinpoint which specific campaigns are driving actual conversions. This level of detail is essential for identifying the immediate impact of marketing efforts, such as the launch of a social media campaign or the publication of a new blog post. By breaking down data by day, the tool allows for a more nuanced understanding of user behavior patterns, such as weekend versus weekday trends or the impact of external seasonal events.
Technical Implementation and User Interface
The integration of these charts into the existing Web Analytics dashboard has been designed for intuitive navigation. To access the new data visualizations, users must select a date range of at least two days within the dashboard. Upon selecting a specific audience segment and clicking the expansion button, the interface reveals two distinct charts positioned above the traditional data table.
The interface includes a versatile dropdown menu located in the top-right corner of the reporting module. This allows users to toggle between three primary metrics:
- Unique Visitors: Measuring the individual reach of a segment.
- Sessions: Tracking the frequency of visits and engagement levels.
- Pageviews: Assessing the total volume of content consumption within that segment.
Perhaps the most significant technical addition is the ability to overlay Conversion Goals onto these traffic charts. When a user selects a pre-defined conversion goal, the system generates a dual-axis visualization. The primary Y-axis tracks traffic metrics, while the secondary Y-axis on the right scales the number of daily conversions. This overlay provides an immediate visual correlation between traffic volume and business outcomes, making it easier for analysts to determine if a surge in traffic actually resulted in a surge in revenue or leads.
The Evolution of Crazy Egg’s Analytics Ecosystem
To understand the significance of this update, it is necessary to look at the chronology of Crazy Egg’s product development. Founded in 2005 by Hiten Shah and Neil Patel, Crazy Egg was a pioneer in the "visual analytics" space, primarily known for its heatmaps and scroll maps. For over a decade, the platform was used as a secondary tool to supplement Google Analytics.
However, over the last three years, Crazy Egg has aggressively expanded its "Web Analytics" offering. The goal has been to provide a privacy-friendly, easier-to-use alternative to the increasingly complex Google Analytics 4 (GA4). The introduction of time-series charts for segments is a direct response to user feedback requesting more robust reporting capabilities that do not require the steep learning curve of enterprise data science platforms.
This update follows a series of recent improvements, including enhanced A/B testing integrations and more sophisticated session recording filters. By layering time-series data on top of audience segmentation, Crazy Egg is positioning itself as a primary source of truth for small to medium-sized businesses (SMBs) and marketing agencies that require quick, visual answers to performance questions.
Strategic Value of Segmented Time-Series Data
The move to provide daily breakdowns of segmented data offers several strategic advantages for digital marketers. In a standard analytics setup, a sudden drop in overall traffic might cause alarm. However, with segmented time-series charts, a marketer might discover that the drop is isolated to a single, low-value referral source while organic search traffic remains steady.
1. Identifying Channel Decay:
By monitoring channel-specific trends over weeks or months, businesses can identify "channel decay" early. If a paid search segment shows a steady decline in conversion efficiency despite stable traffic, the time-series chart will highlight that divergence immediately, allowing for rapid budget reallocation.
2. Validating Campaign ROI:
For agencies managing multiple client campaigns, the ability to export this data into spreadsheet formats (.xlsx) is a vital feature. The new update includes a streamlined export process located next to the date range selector, ensuring that these visual insights can be integrated into broader monthly reports or third-party business intelligence tools.
3. Detecting Anomalies:
Sudden spikes in traffic can often be attributed to "bot" activity or spam referrals. By viewing these spikes on a day-by-day basis within specific segments, technical teams can more easily identify the source of the anomaly and filter it out, ensuring that the remaining data used for business decisions is clean and accurate.
Industry Reactions and Market Context
While Crazy Egg has not released formal statements from outside partners, the industry trend toward "simplified" but "deep" analytics is well-documented. Analysts in the martech space have noted that as GA4 has become more difficult for the average business owner to navigate, there is a growing market for tools that offer "one-click" insights.
Industry experts suggest that the addition of conversion overlays on time-series charts is a direct challenge to more expensive platforms like Mixpanel or Amplitude. By offering this at no extra cost to existing subscribers, Crazy Egg is increasing its "stickiness" as a platform. For many users, the ability to see a conversion trend line superimposed over a traffic trend line is the "holy grail" of quick-glance reporting.
The decision to make this feature available across all plans—from the Basic tier to Enterprise—reflects a commitment to democratizing data. In an era where data privacy regulations like GDPR and CCPA are making third-party tracking more difficult, first-party analytics tools that provide clear, segmented views of user behavior are becoming increasingly valuable.
Broader Implications for the Future of Web Reporting
The rollout of these features suggests a future where web analytics is less about data collection and more about data storytelling. By providing pre-built visualizations that automatically handle complex tasks like dual-axis scaling and segment comparisons, Crazy Egg is reducing the "time to insight" for its users.
As e-commerce and digital services continue to dominate the global economy, the demand for tools that can quickly explain shifts in consumer behavior will only grow. This update indicates that Crazy Egg intends to remain a central player in that space, evolving from a niche visualization tool into a comprehensive platform capable of handling the end-to-end needs of digital optimizers.
The new segmented time-series charts are now live and accessible to all Crazy Egg customers. The company has indicated that this is part of a broader roadmap aimed at enhancing the "Web Analytics" portion of their service, with further updates regarding predictive analytics and automated insight generation expected in the coming quarters. For now, the ability to see how every traffic segment performs on a day-by-day basis provides a powerful new lens through which businesses can view their digital growth.







