The global mobile application market, currently valued at hundreds of billions of dollars, has reached a level of saturation where the difference between a top-tier product and a failed venture often rests on the minutiae of user experience. While mobile app professionals have long relied on sophisticated dashboards to monitor performance, a critical flaw remains prevalent in standard analytical workflows. Most developers and product managers focus exclusively on quantitative analytics—the numerical data that tracks "what" is happening—while remaining largely oblivious to the "why" behind user behavior. This oversight creates a ceiling for optimization that can only be broken by integrating qualitative analytics into the development lifecycle.
The Evolution of Mobile Analytics: From Downloads to Behavior
The history of mobile app tracking has moved through several distinct eras. In the early days of the App Store and Google Play, success was measured almost exclusively by download counts. As the market matured, the industry shifted toward engagement metrics: daily active users (DAU), monthly active users (MAU), and session length. Today, we are in the era of behavioral analytics, where the focus has moved from aggregate numbers to the individual user journey.
Despite this evolution, the reliance on quantitative data creates a systemic blind spot. Quantitative analytics provides the "alarm system." It can inform a developer that 40% of users drop off at the registration screen or that the average session length has decreased by 15% following a new update. However, numbers are inherently silent regarding the cause. A high abandonment rate on a signup page could be due to a technical bug, a confusing user interface (UI), an overly intrusive permissions request, or a simple lack of clarity in the value proposition. Without qualitative tools, teams are forced to rely on guesswork, A/B testing every possible variable in a time-consuming and often expensive process of elimination.
The Qualitative Arsenal: Touch Heatmaps and Session Recordings
To address the limitations of traditional data, a new category of qualitative tools has emerged, centered on two primary features: touch heatmaps and user session recordings. These tools provide a visual layer to data that allows product teams to observe the app through the eyes of the user.
Touch Heatmaps and the Science of Interaction
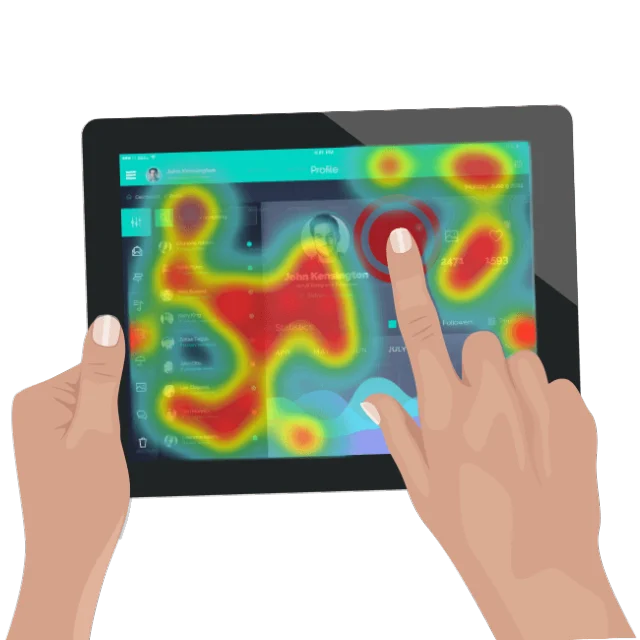
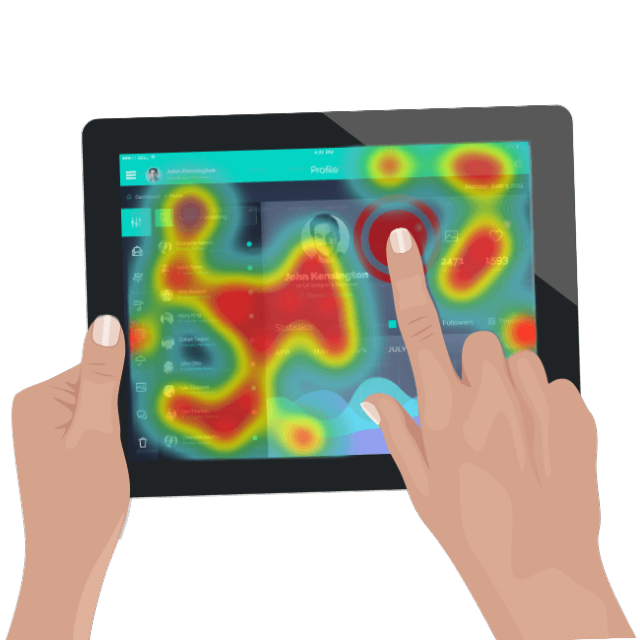
Touch heatmaps aggregate every gesture made by users across every screen of an application. By layering this data, the tool creates a visual representation of interaction density. Areas with high engagement appear "hot," while ignored elements remain "cold." This provides immediate feedback on whether users are interacting with the intended Call to Action (CTA) or if they are being distracted by non-functional design elements.
A critical subset of heatmap data is the "unresponsive gesture." This occurs when a user taps, swipes, or double-taps an element expecting a response, but the app remains static. In the context of user psychology, unresponsive gestures are a primary source of "friction." They signal to the user that the app is either broken or unintuitive. From a development standpoint, these gestures are invaluable; they reveal where the user’s mental model of the app differs from the developer’s design. Identifying and fixing these points of friction can lead to immediate improvements in user satisfaction and retention.
User Session Recordings: The Digital Flight Recorder
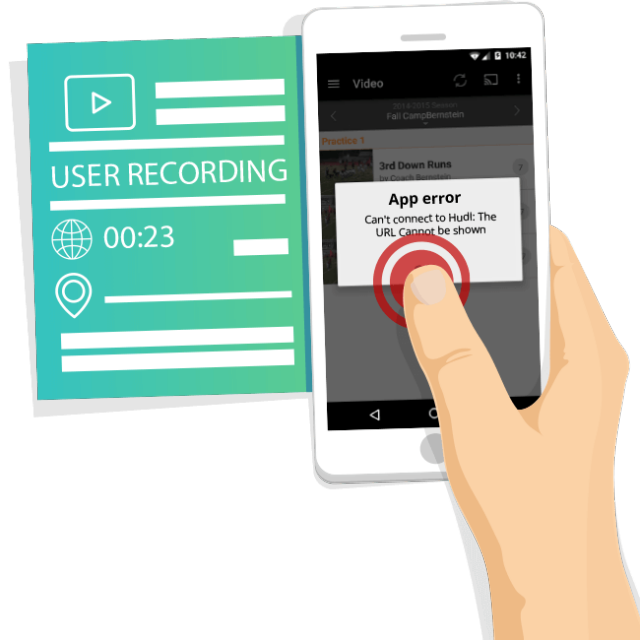
User session recordings provide a real-time, video-like playback of a user’s journey through the app. Unlike traditional screen recording, these tools typically capture the underlying technical events and reconstruct the UI, ensuring minimal impact on device performance and battery life.
The value of session recordings lies in their ability to capture the nuance of user struggle. For instance, if a user attempts to enter a credit card number and the keyboard obscures the "submit" button, a quantitative tool would merely show a "cart abandonment." A session recording, however, would show the user frantically trying to scroll or dismiss the keyboard before giving up. This level of detail transforms troubleshooting from a statistical exercise into an empathetic observation of the user experience.
Data-Fueled Optimization: A Dual-Track Workflow
The integration of qualitative and quantitative data allows for a streamlined optimization workflow often referred to as "Data-Fueled Optimization." This process follows a logical progression: alert, investigate, and resolve.
- Alert (Quantitative): The team monitors KPIs through quantitative dashboards. A sudden spike in the "churn rate" at the checkout screen triggers an alert.
- Investigate (Qualitative): Instead of guessing why users are leaving, the product manager filters session recordings specifically for users who abandoned the checkout. They observe that a specific promo code field is causing a validation error that doesn’t display a clear message to the user.
- Resolve (Actionable Insight): The development team fixes the validation logic and adds a clear error message.
This workflow eliminates the "stab in the dark" approach to app updates. By using qualitative data to validate the findings of quantitative reports, companies can significantly reduce the cost of development by ensuring that every patch or feature update addresses a verified user need.
Proactive Troubleshooting and Technical Integrity
Beyond optimization, qualitative analytics serves as a frontline defense for technical stability. Traditional crash reporting tools provide stack traces and device logs, which are essential for developers but often lack context. A "Proactive Troubleshooting" workflow uses session recordings to see the exact sequence of events leading up to a crash.
For example, a developer might see a recurring crash in the logs related to a social media login API. By reviewing the session recording, they might discover that the crash only occurs when a user attempts to log in, realizes they forgot their password, switches to their email app to find it, and then returns to the app. This "state change" might be the true culprit, a detail that is often lost in standard log files.
Furthermore, qualitative tools allow teams to spot "silent killers"—issues that don’t cause a crash but render the app useless. A broken "buy now" button that simply does nothing when pressed won’t show up in a crash report, but it will be glaringly obvious on a touch heatmap or in a session recording. Spotting these issues early prevents the long-term damage to brand reputation and app store rankings that follows a wave of negative reviews.
Market Context and the Economic Impact of Churn
The shift toward qualitative analytics is driven by the escalating costs of user acquisition (UA). Industry data suggests that the average cost to acquire a mobile app user has risen steadily over the last decade, with some sectors seeing costs as high as $5 to $10 per install. With nearly 25% of users abandoning an app after a single use, the economic stakes of "first-session friction" are immense.
Industry analysts suggest that a 5% increase in user retention can lead to a profit increase of 25% to 95%. Qualitative analytics is the most direct path to improving retention because it addresses the "experience gap." When users feel that an app is intuitive and responsive to their needs, their lifetime value (LTV) increases, providing a higher return on the initial acquisition investment.
Privacy and Ethical Considerations
As the use of session recordings and heatmaps grows, so does the focus on user privacy. Modern qualitative analytics providers have adapted by implementing "privacy by design" features. These include automatic masking of sensitive information—such as passwords, credit card numbers, and personal identifiers—at the SDK level before the data ever leaves the user’s device. For organizations operating under strict regulatory frameworks like GDPR in Europe or CCPA in California, these safeguards are not just features but requirements. The industry standard has moved toward "visualizing behavior" without "identifying individuals," ensuring that optimization does not come at the cost of ethical integrity.
Implications for the Future of App Development
The traditional siloed approach to data—where the marketing team looks at numbers and the UX team looks at prototypes—is becoming obsolete. The future of mobile app success lies in a unified view of the user. Qualitative analytics provides the "fresh twist" on old ideas by making data human-centric rather than just digit-centric.
As artificial intelligence and machine learning continue to integrate with analytics, we can expect qualitative tools to become even more proactive. Future systems may automatically flag "frustrated" user sessions based on "rage-tapping" patterns or erratic scrolling, allowing support teams to reach out to users before they even have a chance to delete the app.
In conclusion, while quantitative analytics remains a cornerstone of the industry, it is no longer sufficient on its own. The most successful mobile powerhouses are those that recognize numbers are just the beginning of the story. By embracing qualitative analytics, app professionals can move beyond tracking what their users are doing and begin to truly understand why, leading to products that are not just functional, but indispensable.