The modern enterprise often operates under a dangerous misconception: that the volume of support tickets and the scores of annual surveys provide a comprehensive view of the customer experience. However, recent industry data and behavioral research suggest that these metrics represent only a small fraction of the actual friction encountered by users. Most companies discover, upon conducting their first comprehensive Voice of Customer (VoC) audit, that the vast majority of customer dissatisfaction remains unspoken until it manifests as churn. This "silent disloyalty" represents a significant drain on corporate revenue, often occurring without any prior warning or engagement from the customer.
According to Gartner’s Effortless Experience research, 96% of customers who endure high-effort interactions eventually become disloyal, compared to a mere 9% of those who experience low-effort interactions. The financial implications are staggering, as nearly 43% of customers who churn never voice a single concern before terminating their relationship with a brand. To combat this, organizations are increasingly turning to VoC audits—a diagnostic process designed to quantify the gap between perceived and actual customer friction and translate those findings into actionable revenue recovery strategies.
The Structural Deficiencies of Traditional Feedback Programs
For decades, the "Kolsky/thinkJar" research has served as a cornerstone of customer experience (CX) literature, establishing that dissatisfied customers overwhelmingly choose silence over complaint. When a user encounters a bug, a confusing interface, or a pricing discrepancy, they rarely reach out to support; they simply leave. Traditional VoC programs are often ill-equipped to capture this behavior because they are built incrementally rather than systematically.
Most programs consist of a patchwork of disparate channels: an Net Promoter Score (NPS) survey launched by the marketing department, a feedback widget added during a website redesign, and support tickets managed by a service team. Because these channels are rarely integrated, the gaps between them become the breeding grounds for customer friction.
There are three primary structural patterns that lead to expensive blind spots in customer intelligence:
- Over-reliance on Support Tickets: While tickets are a vital signal, they only capture the friction that users felt was "worth" the effort of complaining about. Research from Lee Resources suggests that for every one customer who files a formal complaint, approximately 24 others remain silent and eventually disengage. A low ticket volume can, therefore, be a false positive, masking a severe retention crisis.
- Cadence-Based vs. Event-Based Surveying: Periodic surveys, such as quarterly NPS distributions, capture sentiment at a random point in time that may have no relevance to the customer’s actual journey. A customer who churned three weeks prior to a survey will not be included, and a customer on the verge of churning may provide a score based on a recent positive interaction that ignores a long-term systemic failure.
- The Limitations of Closed-Form Questions: Dropdown menus and multiple-choice questions provide clean data for dashboards but often strip away the nuance of the customer’s pain. An option like "Too expensive" offers no insight into whether the user perceives a lack of value, a better competitor price, or a confusing billing structure. Only open-text analysis can reveal the "why" behind the "what."
The 6-Step Framework for a Comprehensive VoC Audit
A professional VoC audit typically requires between two and six weeks to complete, depending on the scale of the organization. The goal is to evaluate what is being measured, what is being ignored, and where the systemic blind spots reside.
Step 1: Mapping the Feedback Ecosystem
The first phase involves cataloging every channel where customer feedback is currently generated. This includes formal channels like support tickets and NPS surveys, as well as informal or external channels such as G2 and Capterra reviews, App Store ratings, sales call notes, and social media mentions. Industry benchmarks suggest that if a team identifies fewer than seven channels, they are likely missing critical data sources. Conversely, more than fifteen channels often indicate a lack of ownership and data fragmentation.
Step 2: Structural SWOT Analysis of Channels
Once mapped, each channel must be evaluated for its inherent strengths and weaknesses. NPS is excellent for tracking general sentiment trends but poor at explaining the root causes of shifts. Session recordings provide a visual account of user behavior but fail to explain user intent. By mapping these channels against specific business questions—such as "Why did users drop off during onboarding?"—organizations can identify where they are redundant and where they are flying blind.
Step 3: Quantitative Measurement of the Blind Spot
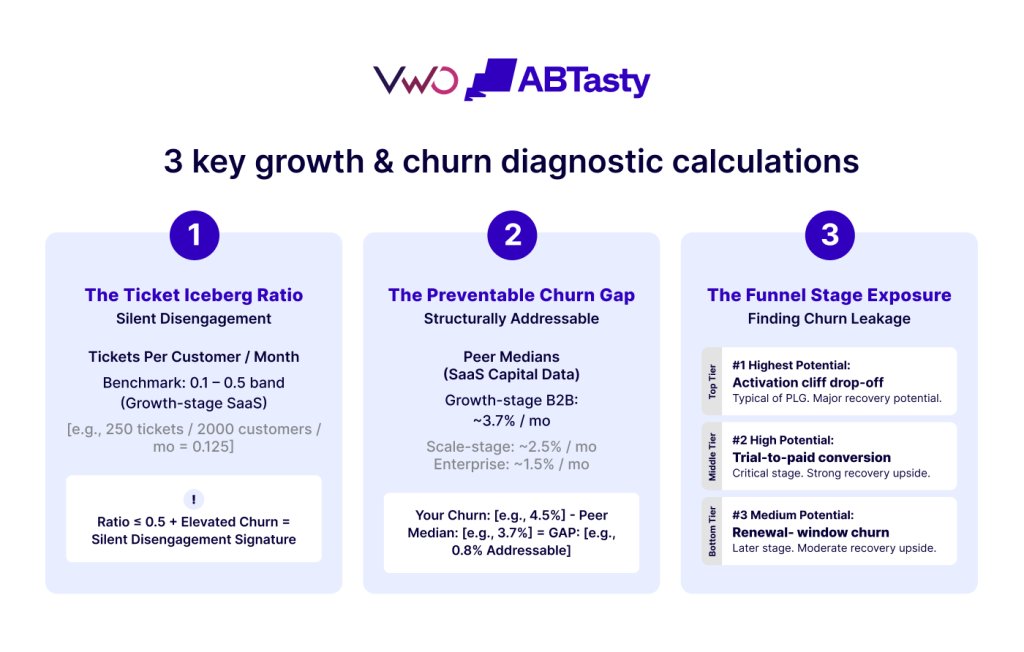
This stage moves from qualitative observation to hard data. Organizations must calculate their "Ticket Iceberg Ratio"—the number of tickets per customer per month compared to growth-stage SaaS benchmarks (typically 0.1 to 0.5). A ratio significantly lower than the benchmark, paired with high churn, is a definitive indicator of silent disengagement.
Furthermore, teams should calculate their "Preventable Churn Gap." According to SaaS Capital data, growth-stage B2B SaaS companies average 3.7% monthly churn, while enterprise-level companies average 1.5%. Any churn exceeding these peer medians represents structurally addressable revenue leakage.
Step 4: Diagnosing Friction Patterns
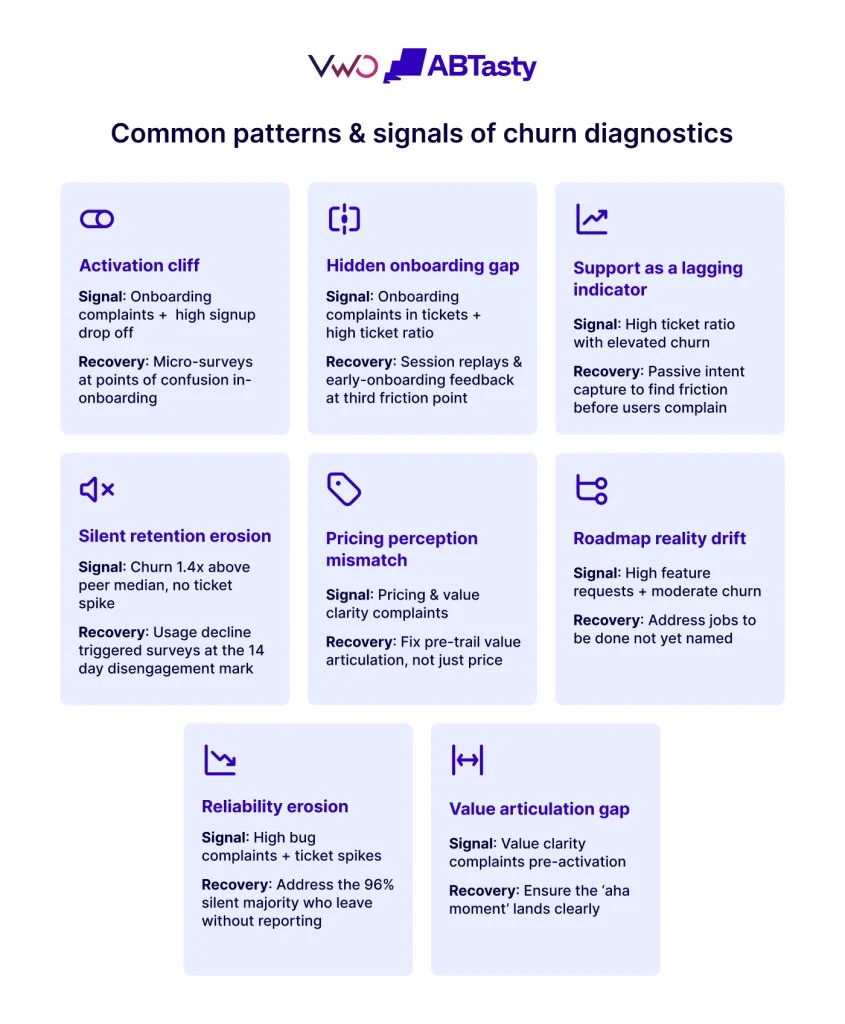
The audit must identify specific recurring patterns of friction. Common archetypes include:
- The Activation Cliff: High drop-off during the initial setup or first-run experience.
- Feature Blindness: Users failing to discover the core value proposition of the product.
- The "Almost-Converted" Gap: High abandonment rates at the final stage of the purchase or renewal funnel.
Step 5: Prioritizing by Revenue Leverage
The instinct to fix the most "severe" problem first is often a strategic error. Instead, teams should prioritize based on "leverage"—the intervention that produces the greatest measurable impact within a fiscal quarter. For most growth-stage companies, addressing the "Activation Cliff" offers the highest return on investment. A 5% increase in activation rates compounds across every future cohort, providing a more significant long-term revenue boost than a 10% reduction in late-stage churn.
Step 6: Closing the Loop Through Experimentation
The final step is the transition from audit to operation. Every identified friction pattern is treated as a hypothesis to be tested. By running controlled experiments to mitigate these friction points, companies can produce real recovery figures that justify the audit’s cost and inform the next quarterly cycle.
Calculating the Economic Impact: Revenue Leakage and Upside
A primary output of a VoC audit is the "Revenue Leakage Estimate." This is a dollar figure that represents the monthly revenue lost to addressable customer friction. CFOs and executive stakeholders rely on this methodology to prioritize budget allocations. The calculation is typically divided into two components:
- Conversion Loss: Calculated by multiplying the volume of traffic by the stage-leak coefficient and the Average Revenue Per User (ARPU).
- Preventable Retention Loss: Calculated by multiplying the customer base by the percentage of churn exceeding peer benchmarks, adjusted for Lifetime Value (LTV) horizons.
By providing a "Blind Spot Score" (on a scale of 0 to 100), the audit gives leadership a clear metric of how much customer signal is being missed. A score above 75 is considered critical, indicating that the measurement gap is wider than 75% of comparable companies in the sector.
VoC Audit vs. Customer Experience (CX) Audit
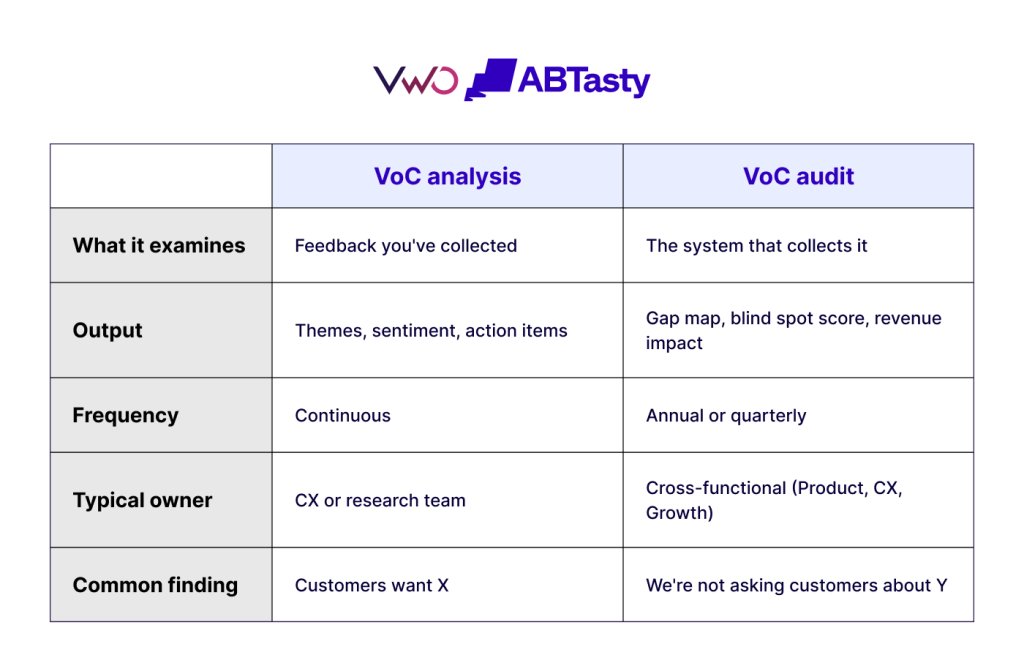
It is essential to distinguish between a VoC audit and a CX audit. A CX audit examines the experience itself—the journey the customer takes. A VoC audit examines the measurement system—the tools and processes used to capture what the customer thinks about that journey. In a professional setting, the VoC audit should ideally precede the CX audit. By first identifying where the measurement system is thin, a company can focus its expensive qualitative research on the areas where it is most "blind."
The Role of Modern Technology in Revenue Recovery
As the category has matured, platforms like VWO Pulse have emerged to automate the heavy lifting of the VoC audit process. These tools allow for contextual, behaviorally-triggered feedback. Rather than sending a generic email survey weeks after an interaction, modern tools trigger micro-surveys at the exact moment of friction—such as when a user abandons a checkout page or fails to complete a setup task.
Furthermore, the integration of Artificial Intelligence has solved the "open-text problem." Previously, analyzing thousands of free-text responses required weeks of manual labor. Modern AI can now categorize sentiment and themes in real-time, surfacing actionable patterns in minutes.
Strategic Implications for the Enterprise
The shift from reactive feedback collection to proactive VoC auditing represents a fundamental change in how successful companies manage growth. In an era where the cost of customer acquisition (CAC) continues to rise, the ability to identify and plug "leaks" in the revenue funnel is a competitive necessity.
An annual or quarterly VoC audit ensures that the feedback system remains aligned with the product’s evolution and the market’s demands. It transforms the Voice of the Customer from a collection of "vanity metrics" into a measurable revenue lever. For organizations looking to move beyond the surface-level insights of support tickets and NPS scores, the VoC audit provides the structural framework necessary to hear the silent majority of their customers and protect the bottom line from avoidable churn.