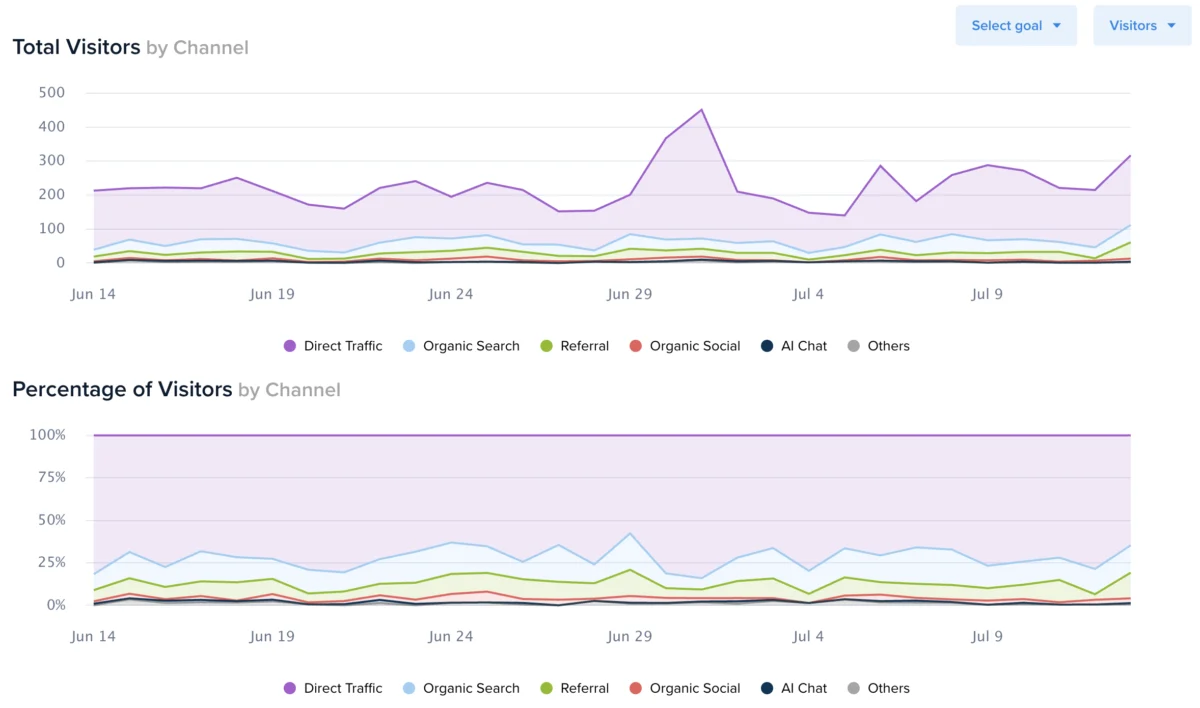
The digital optimization platform Crazy Egg has officially announced a significant update to its Web Analytics suite, introducing dedicated time-series charts for every traffic segment to provide users with a more granular view of day-by-day performance. This latest feature roll-out aims to bridge the gap between high-level traffic overviews and the deep-dive behavioral data for which Crazy Egg is traditionally known. By enabling users to visualize fluctuations in traffic spikes, monitor declining channels, and track the efficacy of specific marketing campaigns in real-time, the platform is positioning itself as a more robust competitor in the increasingly crowded web analytics landscape.
The implementation of time-series charts allows marketers and data analysts to move beyond static data snapshots. Instead of viewing a cumulative total of visitors or conversions for a set period, users can now observe the specific trajectory of different audience segments. This level of detail is critical for identifying whether a sudden increase in traffic was a one-day anomaly or a sustained trend resulting from a successful outreach effort. The update is currently live and available across all Crazy Egg subscription tiers, signaling the company’s commitment to democratizing advanced data visualization tools for businesses of all sizes.
Technical Functionality and User Interface Integration
The new time-series functionality has been integrated directly into the existing Web Analytics dashboard, maintaining the platform’s emphasis on user-friendly navigation. To access the data, users must select a date range of at least 48 hours. Upon selecting a specific audience segment—such as referral source, device type, or geographic location—users can click the expansion button (indicated by the ">" symbol) to reveal the new visualization layer.
The interface now displays two primary charts positioned above the traditional data tables. These charts are designed to provide an immediate visual summary of performance metrics. Users have the flexibility to toggle between different primary metrics via a dropdown menu located in the top-right corner of the reporting module. The available metrics include:
- Total Visitors: The number of unique individuals interacting with the site.
- Sessions: The total number of visits, providing insight into user engagement frequency.
- Pageviews: The total number of pages loaded, useful for determining content depth and site stickiness.
Furthermore, the update includes a sophisticated overlay feature for conversion tracking. By selecting a pre-defined "Conversion Goal" from the secondary menu, the charts will automatically display conversion trends alongside traffic data. This dual-axis visualization uses the left Y-axis for traffic volume and the right Y-axis for conversion scale, allowing users to see at a glance if a spike in traffic actually resulted in a proportional increase in desired actions, such as sign-ups or purchases.
Strategic Importance of Temporal Data in Modern Analytics
The introduction of time-series analysis addresses a common pain point in digital marketing: the "noisy" nature of aggregated data. In a standard analytics view, a high-performing week might mask a catastrophic drop-off in the final two days of that period. By breaking data down into a daily time series, Crazy Egg users can pinpoint the exact moment a campaign began to lose steam or identify specific days of the week when certain segments are most active.
For instance, an e-commerce retailer might notice that while overall traffic is steady, "Mobile" traffic spikes significantly on Sunday evenings while "Desktop" traffic dominates Tuesday mornings. With the new time-series charts, these patterns become visually obvious, allowing for more precise ad spend allocation and content publishing schedules.
The ability to export this data is another critical component of the update. Recognizing that many professional analysts require the ability to cross-reference web data with internal business intelligence tools, Crazy Egg has enabled a comprehensive export function. Users can download the daily breakdown of all traffic metrics into a spreadsheet format (.xlsx), facilitating offline analysis, stakeholder reporting, and historical archiving.
Contextualizing Crazy Egg’s Evolution
Founded in 2005 by Hiten Shah and Neil Patel, Crazy Egg originally revolutionized the industry with its heatmap technology, which provided a visual representation of where users clicked on a page. For over a decade, it was primarily viewed as a supplementary tool to be used alongside "heavyweight" platforms like Google Analytics. However, the digital landscape has shifted. With the industry-wide transition to Google Analytics 4 (GA4)—a move that many users found complex and unintuitive—there has been a growing demand for analytics platforms that offer both depth and ease of use.
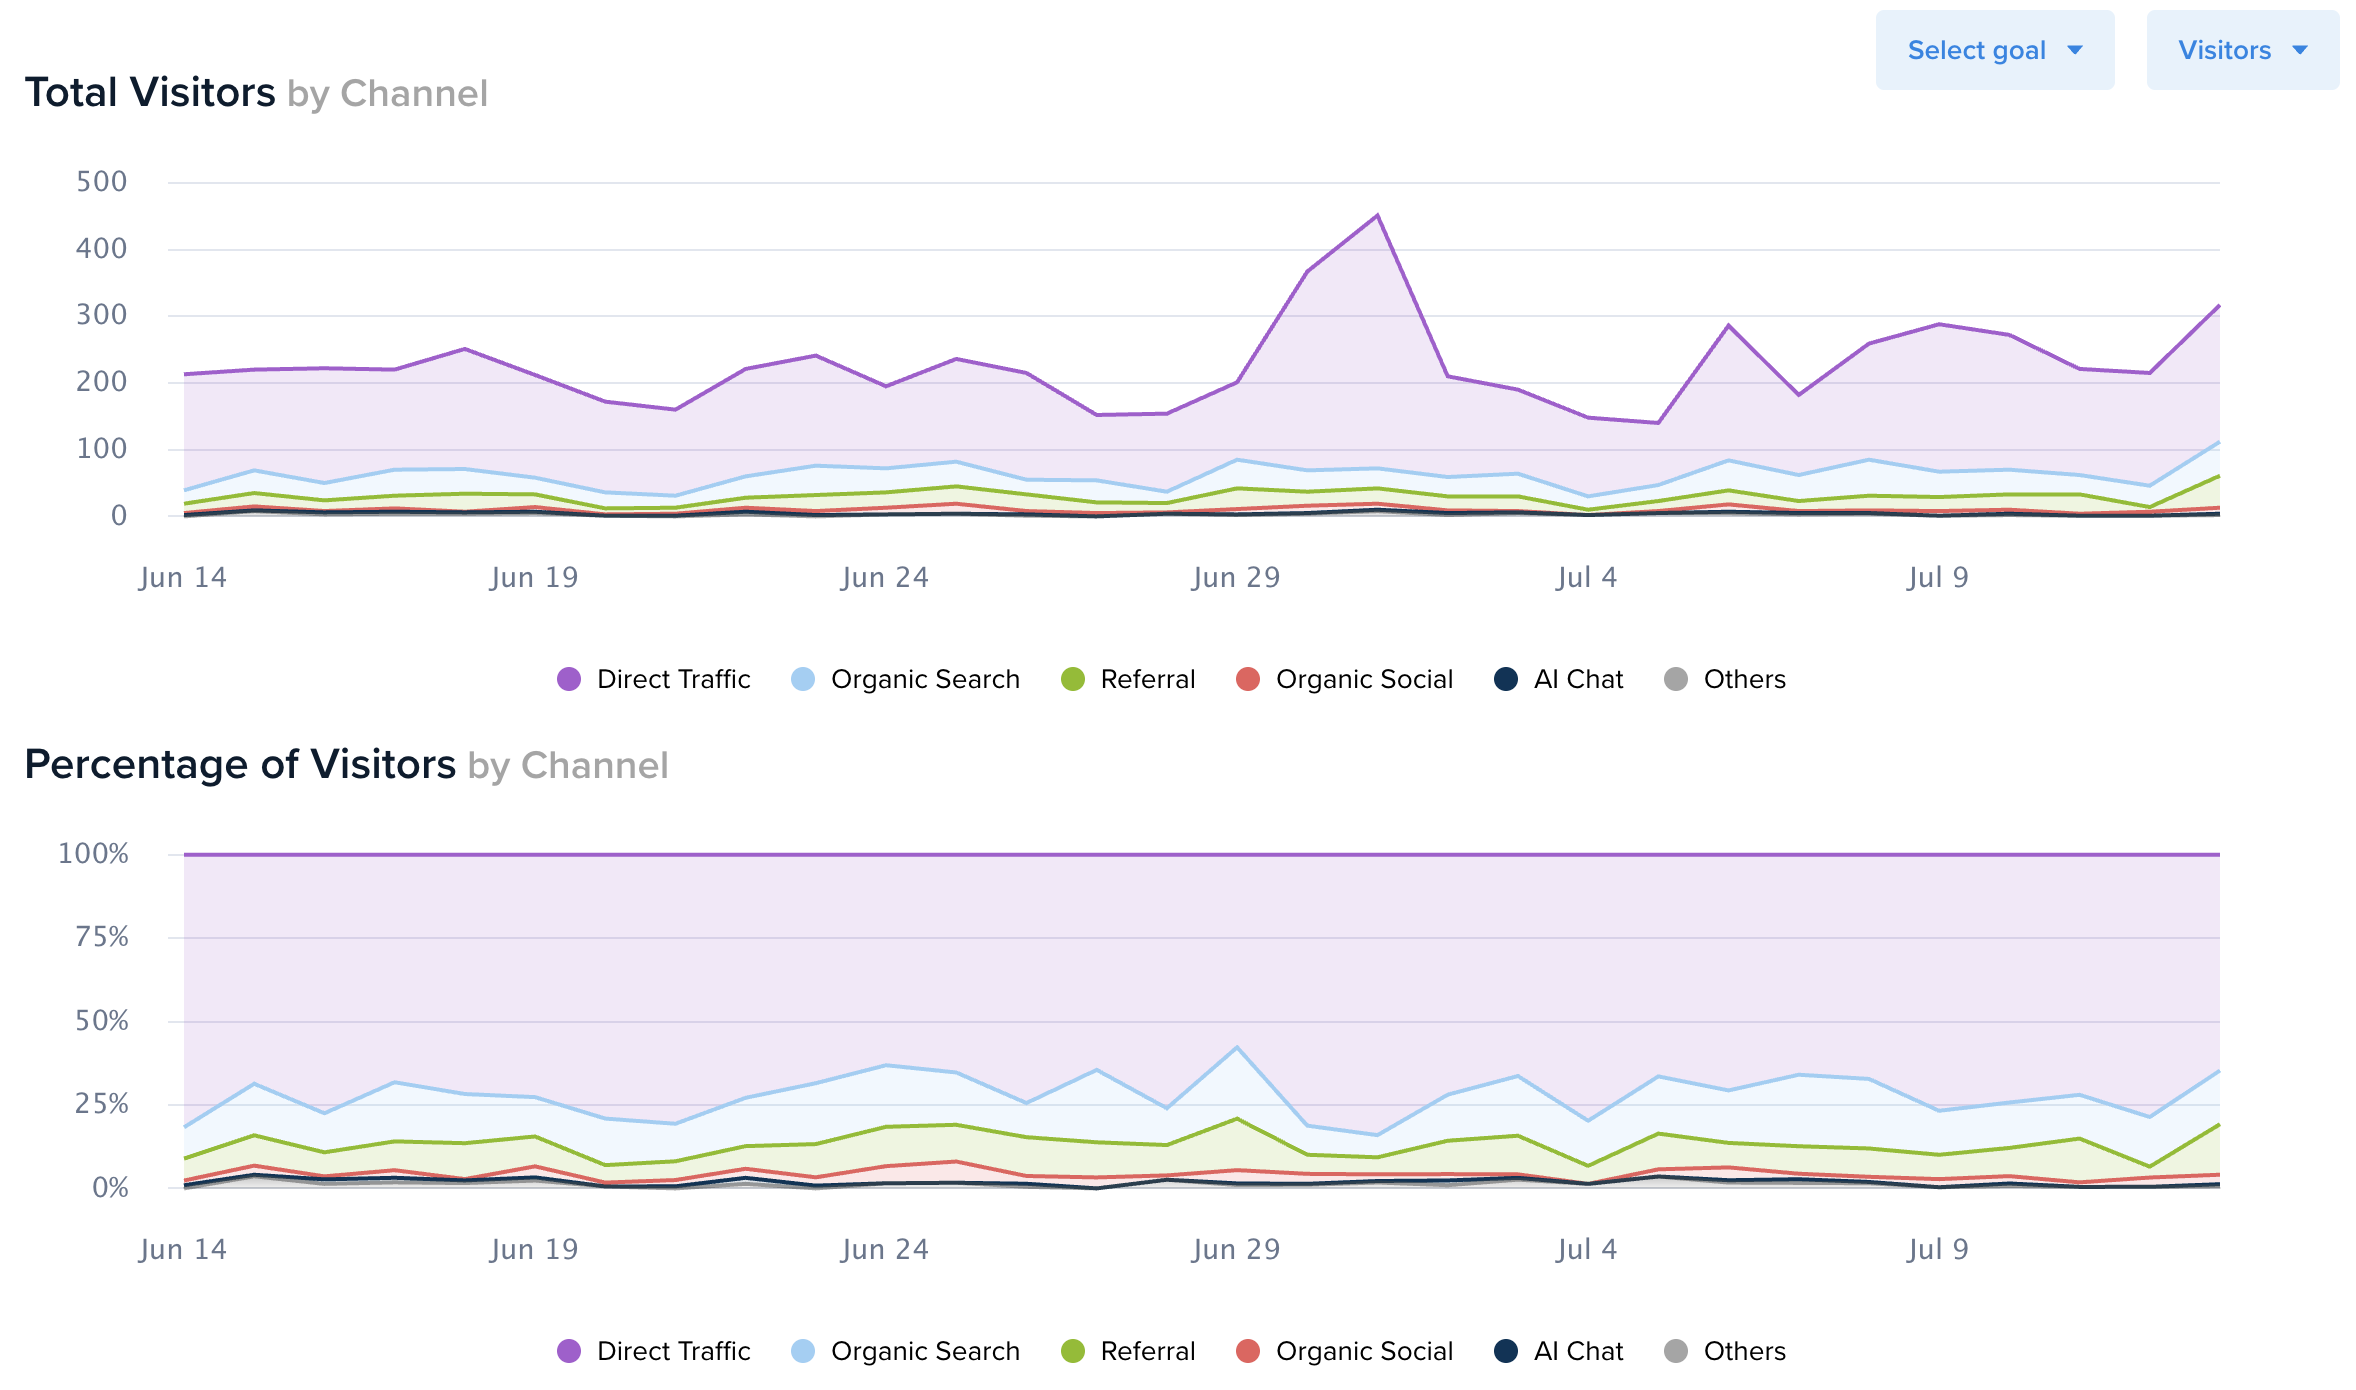
This update represents a strategic pivot for Crazy Egg. By adding time-series segmentation, the platform is moving closer to becoming a primary analytics source for small-to-medium enterprises (SMEs) and marketing teams who require actionable insights without the steep learning curve of enterprise-level software. The company’s decision to include these features at no extra cost to existing plans suggests a move to increase user retention and attract customers looking for a more streamlined alternative to traditional data platforms.
Chronology of Recent Updates
The rollout of time-series charts is the latest in a series of iterative improvements to the Crazy Egg Web Analytics dashboard over the past 24 months.
- Early 2023: Crazy Egg expanded its tracking capabilities to include more automated event tracking, reducing the need for manual tag configuration.
- Late 2023: The platform introduced enhanced "Conversion Goals," allowing users to track specific URLs or button clicks as primary success metrics.
- Q1 2024: Improvements were made to the data processing engine, reducing the latency between user actions and dashboard reporting.
- Current Release: The launch of segmented time-series charts, providing the "when" to go along with the "who" and "where" of user behavior.
Industry Implications and Market Reaction
Market analysts suggest that the "democratization of data visualization" is a key trend for 2024 and 2025. As privacy regulations like GDPR and CCPA make third-party data less reliable, first-party data—the kind collected directly by tools like Crazy Egg—becomes invaluable.
"The ability to see not just that you have traffic, but how that traffic behaves over a timeline within specific segments, is the difference between guessing and knowing," says one digital marketing consultant familiar with the platform. "Most tools give you a ‘what happened’ report. Time-series charts give you a ‘how it’s evolving’ report. For a growth marketer, that distinction is everything."
While Crazy Egg has not released specific user growth figures related to this update, the move is seen as a response to the "visual-first" preference of modern web managers. By allowing users to see a "declining channel" visually, it prompts faster corrective action than a row of numbers in a table might.
Broader Impact on Conversion Rate Optimization (CRO)
The ultimate goal of most Crazy Egg users is Conversion Rate Optimization. The new charts directly serve this purpose by highlighting the correlation between traffic sources and outcomes over time. If a specific campaign on a social media platform shows high traffic but flatlined conversions in the time-series view, a UX designer can immediately investigate if the landing page is broken or if the messaging is mismatched.
Furthermore, the dual Y-axis approach for conversions ensures that even small-scale experiments are visible. In traditional charts, a small number of conversions (e.g., 5 per day) would be invisible when plotted against high traffic (e.g., 10,000 visitors per day). The new scaling system ensures that the "trend line" for conversions remains visible and interpretable, regardless of the disparity in volume.
Conclusion and Availability
The integration of time-series charts into Crazy Egg’s Web Analytics signifies a maturation of the product from a niche visualization tool into a comprehensive data platform. By providing day-by-day granularity for every audience segment, Crazy Egg is empowering its users to make more informed, data-backed decisions regarding their digital presence.
The feature is currently available to all users. To utilize the new charts, account holders can navigate to their Web Analytics dashboard, ensure their date range is set to two or more days, and expand any segment row. As the digital economy continues to prioritize efficiency and precision, tools that simplify complex data sets into actionable visual trends are likely to see continued adoption and relevance.