

The digital marketing landscape in 2025 has reached a critical inflection point where the traditional methods of tracking user behavior are being systematically dismantled. With the definitive phase-out of third-party cookies and the tightening of global privacy regulations such as GDPR and CCPA, businesses are increasingly forced to rely on zero-party data—information that consumers intentionally and proactively share with a brand. Within this context, the website poll, once dismissed as a disruptive pop-up, has emerged as a sophisticated instrument for conversion rate optimization (CRO). When executed with precision and backed by behavioral analytics, these brief interactions provide the "why" behind the "what" of quantitative data, offering a direct line into the consumer’s psyche at the exact moment of engagement.
The Strategic Shift Toward Zero-Party Data
For years, digital marketers relied on passive tracking to build user profiles. However, as customer behavior becomes more fragmented and privacy-conscious, the value of direct feedback has skyrocketed. Industry analysts note that while tools like Google Analytics can pinpoint where a user drops off a funnel, they cannot articulate the emotional or functional barrier that caused the exit. Website polls bridge this gap. By inviting users to share their motivations and frustrations, brands can collect high-intent data that is both accurate and compliant with modern privacy standards.
Khalid Saleh, a prominent figure in the CRO space and CEO of Invesp, emphasizes that the power of polls lies in their ability to provide a few specific data points from a large volume of people. This aggregate data does not replace deep qualitative research, such as one-on-one interviews, but rather sharpens it by validating small-scale findings across a broader demographic. In 2025, this methodology is considered essential for maintaining a competitive edge in a saturated e-commerce market.
The Methodology of Effective Poll Construction
The creation of a successful website poll is a rigorous process that begins long before a single question is typed into a software interface. Professional optimizers argue against the "brainstorming" approach, which often results in vague or leading questions. Instead, effective polling is the result of a multi-stage research hierarchy.
The Preliminary Research Phase
Before deploying a poll, a comprehensive audit of existing site data is required. This typically includes:
- Heuristic Evaluation: A professional review of the site’s interface to identify potential usability issues based on established design principles.
- Analytics Assessment: Analyzing traffic patterns to identify high-exit pages or low-conversion segments.
- Heatmap and Session Replay Analysis: Observing actual user movements to see where they hesitate, scroll aimlessly, or encounter "rage clicks."
- Usability Testing: Gathering initial qualitative feedback to form hypotheses.
By synthesizing these findings, marketers can move from blind guessing to informed inquiry. For instance, if session replays show users lingering on a shipping information page but not proceeding, a poll can be specifically designed to ask if shipping costs or delivery times are the primary concern.
Mapping Polls to the Buyer’s Journey
A common failure in digital polling is the "blanket approach," where the same question is shown to every visitor regardless of their intent. To maximize effectiveness, polls must be segmented according to the five stages of the buyer’s journey:
- Awareness Stage: The visitor has realized they have a problem but is not yet looking for a specific brand. Polls here should focus on the user’s initial needs or how they discovered the site.
- Consideration Stage: The visitor is actively researching solutions. Questions should aim to understand what features are most important to them.
- Decision Stage: The visitor is ready to purchase but is comparing final options. Polls should target "hooks" or unique selling propositions (USPs).
- Retention Stage: The visitor has made a purchase. Feedback should focus on the ease of the transaction and product satisfaction.
- Advocacy Stage: The loyal customer. Polls here measure Net Promoter Scores (NPS) and the likelihood of referrals.
To accurately place visitors in these stages, sophisticated CRM integrations and funnel dashboards are utilized. Segmenting traffic allows marketers to avoid the risk of asking the right question to the wrong user, which not only yields poor data but also degrades the user experience.
Categorizing Data-Driven Poll Questions
To extract actionable insights, poll questions are generally categorized into six distinct functional areas. Each serves a specific purpose in the optimization funnel.
1. Motivator Questions
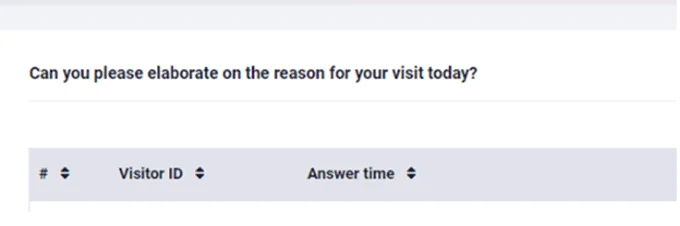
Motivator questions seek to uncover the underlying reason for a visit. In one case study involving an e-commerce client, session replays showed users scrolling through category pages without clicking. A subsequent poll asked, "What is the primary reason for your visit today?" The responses revealed that a significant portion of the audience was looking for a specific product version that was not clearly indexed. By identifying the motive, the company was able to reorganize its navigation, leading to a measurable uptick in click-through rates.
2. Barrier Questions
Barriers are the "Fears, Uncertainties, and Doubts" (FUDs) that prevent a conversion. If Google Analytics shows a high exit rate on a checkout page, a barrier poll can be triggered upon "exit intent"—when the user’s cursor moves toward the browser’s close button. Common questions include:
- "Is there anything preventing you from completing your purchase today?"
- "What was the one thing that almost stopped you from buying?"
- "Is there any information missing that would make your decision easier?"
3. Hook Questions
Hooks are the persuasive elements that successfully convert a visitor. By polling returning customers or those who have just completed a purchase, brands can identify their most effective marketing assets. Asking, "Why did you choose us over a competitor?" can reveal whether the deciding factor was price, brand reputation, or a specific product feature. This data allows marketing teams to double down on what is already working.
4. Missing Content Discovery
Marketers often suffer from "knowledge bias," assuming the information on their site is sufficient. Usability tests frequently show that users cannot find information that is "hidden in plain sight." A simple poll asking, "Were you able to find the information you were looking for?" can highlight gaps in product descriptions, sizing charts, or FAQs.
5. Feedback and Feature Validation
When a new feature is launched or a service is being considered for discontinuation, polls serve as a low-risk validation tool. Instead of making executive decisions based on internal assumptions, companies can ask, "How would you feel if we discontinued [Service X]?" or "What feature would you like to see added to our mobile app?"
6. Satisfaction and Expectations
Customer satisfaction polls measure the alignment between a brand’s promise and the user’s experience. Data indicating a high volume of new visitors but a low volume of returning users suggests a failure to meet expectations. Questions such as, "Does this page meet your expectations?" or "How easy was it to navigate our site today?" provide the necessary context to address these discrepancies.
Chronology of a Data-Driven Poll Campaign
The implementation of a strategic poll follows a logical timeline to ensure data integrity:
- Week 1-2: Quantitative Audit. Review GA4 data to find "leaky" spots in the conversion funnel.
- Week 3: Qualitative Observation. Watch 50-100 session recordings of users on those specific pages.
- Week 4: Hypothesis Formation. Determine if the issue is a barrier, a lack of motivation, or missing content.
- Week 5: Poll Deployment. Launch a targeted poll with a specific trigger (e.g., 30 seconds on page or 50% scroll depth).
- Week 6-7: Data Collection. Gather a statistically significant number of responses (usually 100-200 for qualitative trends).
- Week 8: Analysis and Implementation. Use the feedback to create an A/B test or a permanent site change.
Broader Impact and Industry Implications
The shift toward intentional, data-driven polling represents a broader movement toward "human-centric" optimization. In an era where AI-driven automation can often feel impersonal, the act of asking for a customer’s opinion fosters a sense of agency and engagement.
Furthermore, the integration of poll data into broader business intelligence systems is changing how products are developed. It is no longer just a tool for the marketing department; product managers, customer success teams, and UX designers all utilize this zero-party data to refine their offerings.
As we move further into 2025, the brands that succeed will be those that treat their website visitors not just as data points, but as active participants in the brand’s evolution. By replacing vague, intrusive pop-ups with thoughtful, data-backed inquiries, companies can turn "noise" into a mirror that reflects the genuine needs and desires of their audience. The result is a more efficient sales funnel, higher customer loyalty, and a robust strategy that remains resilient in the face of a changing privacy landscape.







