The digital commerce landscape has reached a critical juncture where quantitative data alone no longer suffices to drive competitive growth. While modern analytics platforms provide granular detail on user behavior—tracking every click, scroll, and exit—they consistently fail to answer the fundamental question of "why" a consumer chooses to disengage. This gap between behavior and motivation has elevated the strategic importance of customer feedback surveys. When deployed at high-friction touchpoints, these surveys transform from simple data collection tools into diagnostic instruments capable of identifying and resolving the psychological and technical barriers that stifle conversion rates.
The Diagnostic Framework of High-Conversion Surveys
Industry benchmarks suggest that the majority of customer surveys fail to yield actionable insights because they are either too broad or deployed at inappropriate times. For a survey to contribute to conversion rate optimization (CRO), it must be designed to diagnose specific friction points rather than collect general sentiment. Experts categorize these friction points into five distinct stages of the customer journey: product engagement, checkout completion, post-purchase attribution, user activation, and retention.
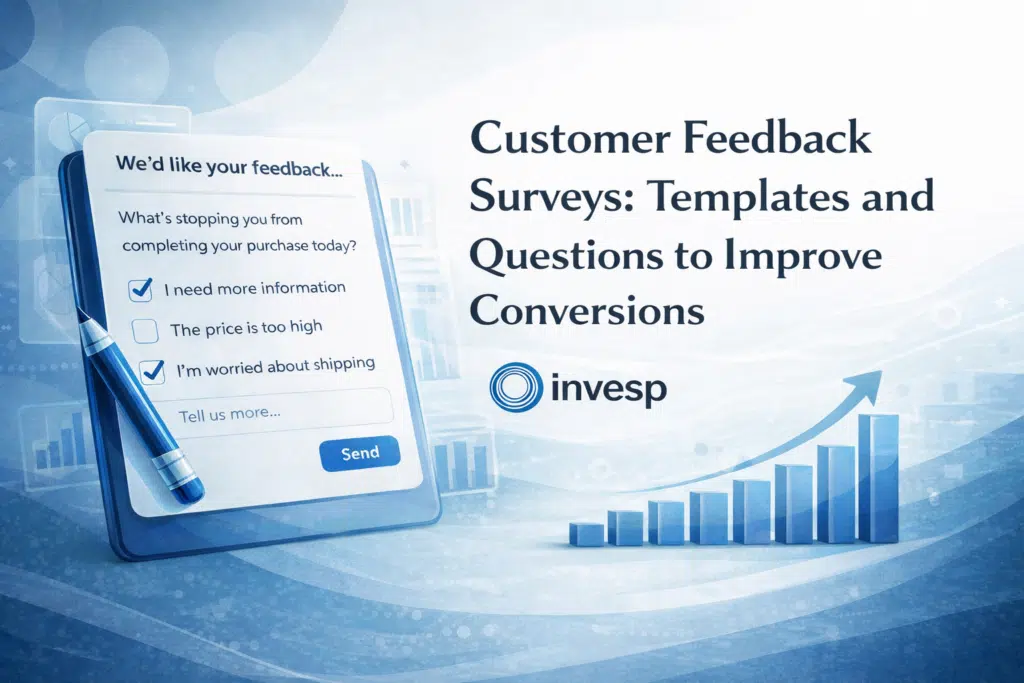
By shifting the focus from "satisfaction" to "friction identification," organizations can uncover the specific doubts and unanswered questions that halt the progression from a visitor to a lead or a customer. This targeted approach allows brands to move beyond guesswork, utilizing direct consumer input to inform A/B testing and user experience (UX) refinements.
Chronology of the Customer Journey and Associated Friction Points
The efficacy of a feedback strategy is dictated by its alignment with the chronology of the consumer experience. Each phase of the funnel presents unique psychological hurdles that require specific inquiry.
Phase 1: Product Page Engagement and the Add-to-Cart Barrier
The product page is the primary battlefield for conversion. According to the latest benchmarks from the Baymard Institute, approximately 52% of desktop e-commerce sites and 62% of mobile sites provide "mediocre" or poor product page UX. This deficiency often results in a high volume of traffic that fails to transition into the "add-to-cart" phase.
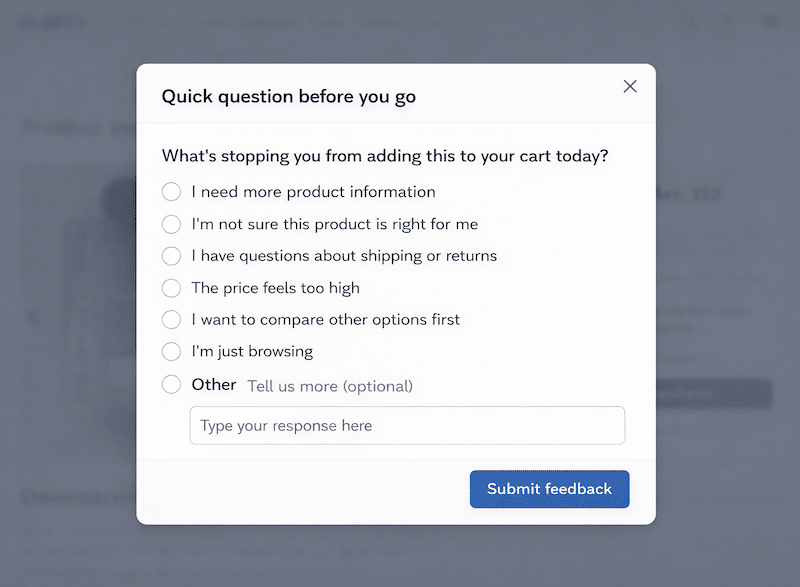
Analysis of consumer behavior suggests that shoppers typically hesitate due to five primary factors: insufficient product information, hidden costs (such as shipping), lack of social proof, concerns regarding compatibility or fit, and general price sensitivity. When a user spends significant time on a product page but exits without taking action, a targeted survey can pinpoint the missing piece of information. For instance, the query "What is stopping you from adding this to your cart today?" offers immediate clarity. Responses indicating "uncertainty about fit" or "unclear shipping costs" provide a direct roadmap for UX improvements, such as adding a size guide or a shipping calculator directly on the product detail page.
Phase 2: The Checkout Crisis and Cart Abandonment
The most significant loss of potential revenue occurs during the checkout process. Recent data indicates that the average cart abandonment rate remains high at 70.19%. At this stage, the user has already demonstrated high intent; their departure is rarely a reflection of the product itself but rather a reaction to the checkout environment.
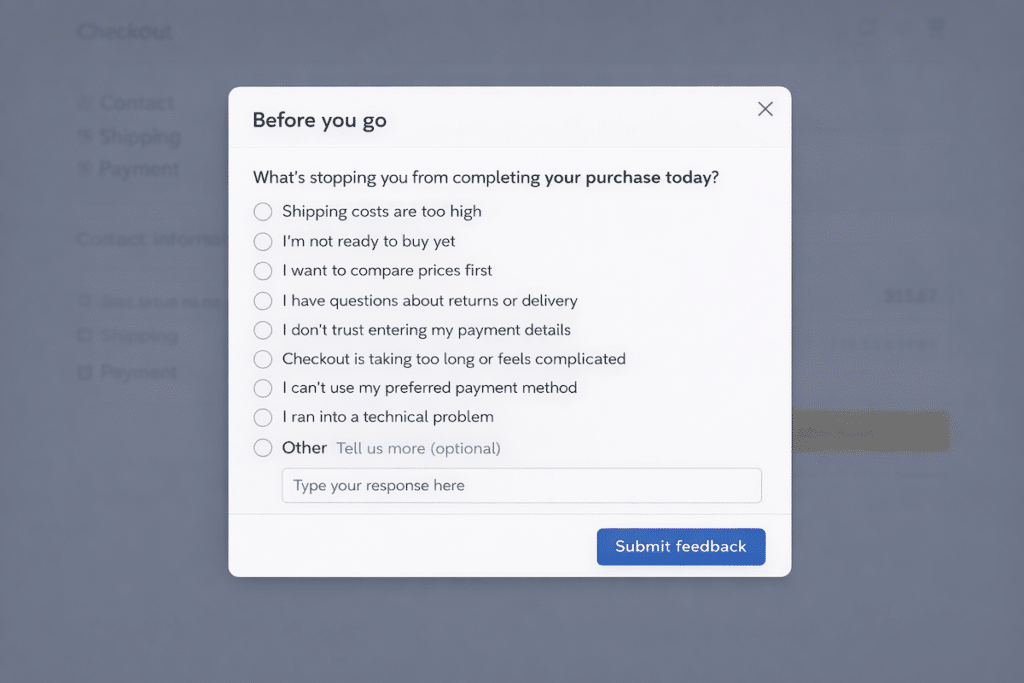
Surveys deployed during checkout abandonment frequently reveal a recurring set of grievances: mandatory account creation, unexpected additional costs, complex checkout flows, and concerns regarding payment security. Journalistic analysis of retail trends in 2024 shows that consumers are increasingly intolerant of "friction for the sake of data collection." A concise survey at this juncture—asking "What is stopping you from completing your purchase today?"—allows brands to identify if a specific payment method is missing or if the delivery timeline is perceived as too slow.
Phase 3: Post-Purchase Attribution and Motivation
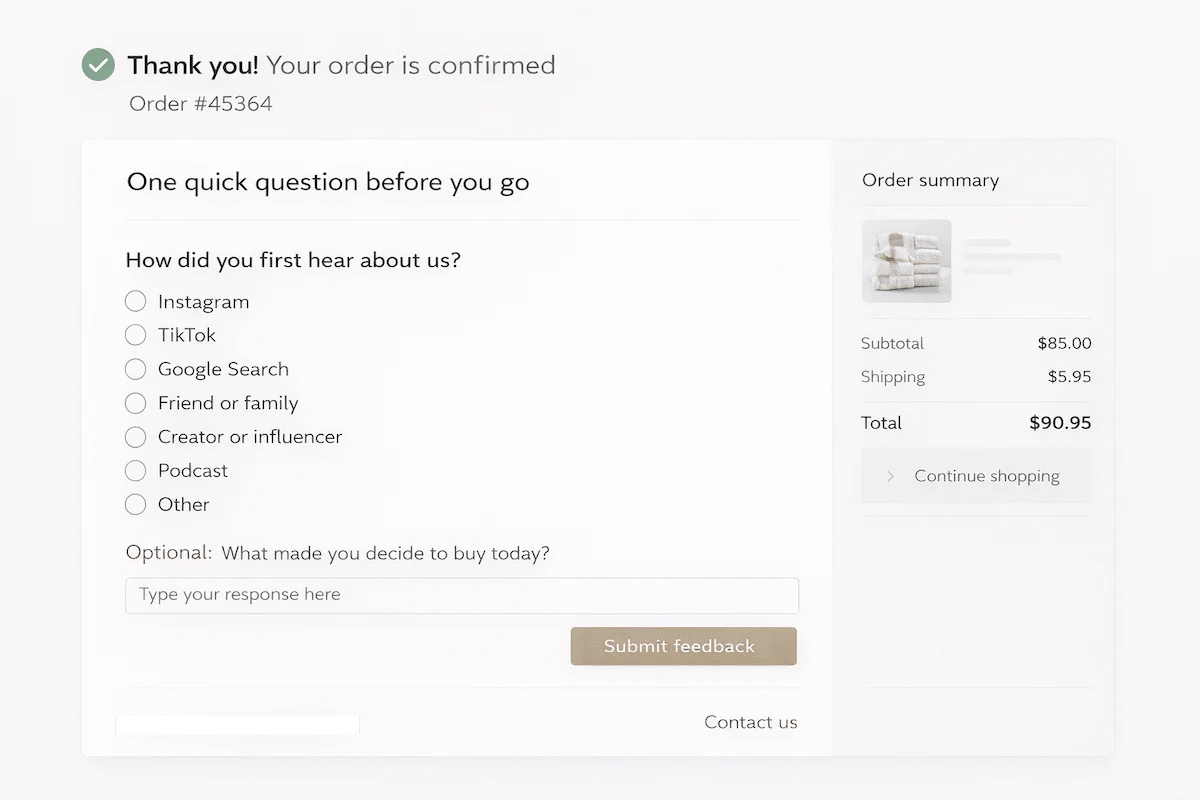
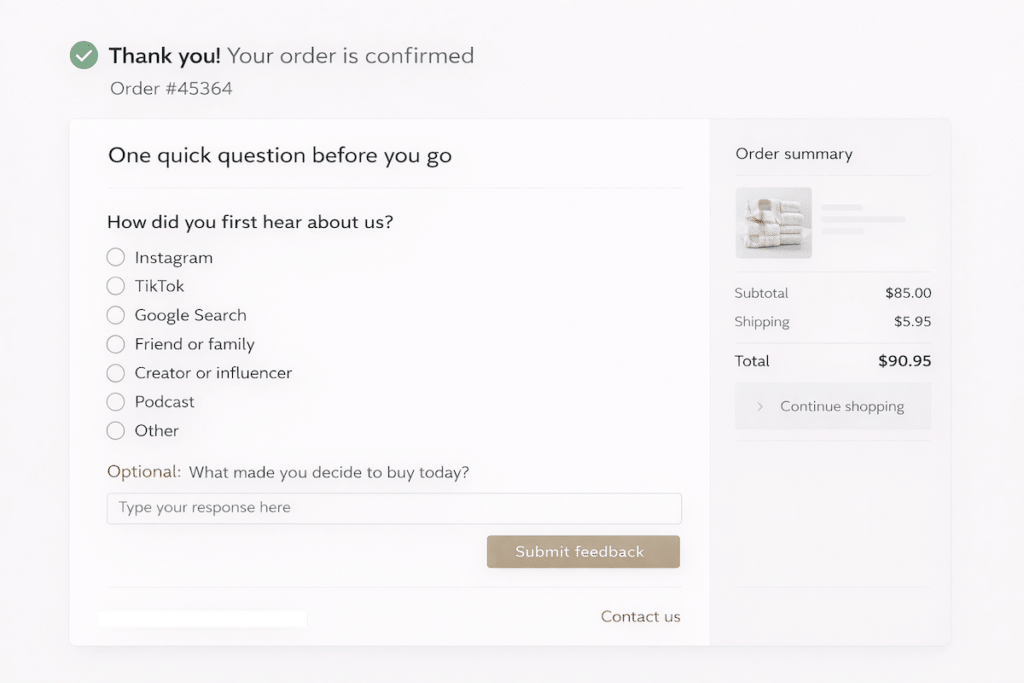
The period immediately following a successful transaction is a high-engagement window where consumer motivation is most transparent. Post-purchase surveys serve a dual purpose: they validate marketing spend and reveal the primary "hook" that converted the customer.
The "How Did You Hear About Us" (HDYHAU) survey has become an essential tool for identifying "dark social" and undercounted channels, such as podcasts, word-of-mouth, and offline mentions. Furthermore, asking "What made you decide to buy today?" helps marketers understand whether the primary driver was a specific feature, a limited-time discount, or a recommendation from a peer. This data is vital for refining brand messaging and optimizing advertising budgets.
Phase 4: SaaS User Activation and the "Time to Value" Gap
In the Software-as-a-Service (SaaS) sector, the challenge shifts from the initial sign-up to user activation. Amplitude’s Product Benchmark Report highlights a sobering reality: by the 14th day of a trial, the median product retains only 2% of new users. Even top-tier products rarely exceed a 9% activation rate.
This drop-off suggests that users often fail to reach the "Aha! moment"—the point where they recognize the product’s value. Surveys targeting trial users who sign up but do not engage are critical for diagnosing whether the onboarding process is too complex or if the product’s utility was misrepresented. Identifying whether a user is "too busy to set it up" versus "confused by the interface" allows for personalized re-engagement campaigns and streamlined onboarding flows.
Phase 5: Retention, Returns, and the Cost of Mismatched Expectations
Post-purchase dissatisfaction represents a significant drain on profitability. The National Retail Federation (NRF) projected that 16.9% of total annual retail sales would be returned in 2024, with online return rates expected to climb to 19.3% in 2025. These returns are often the result of an "expectation mismatch."
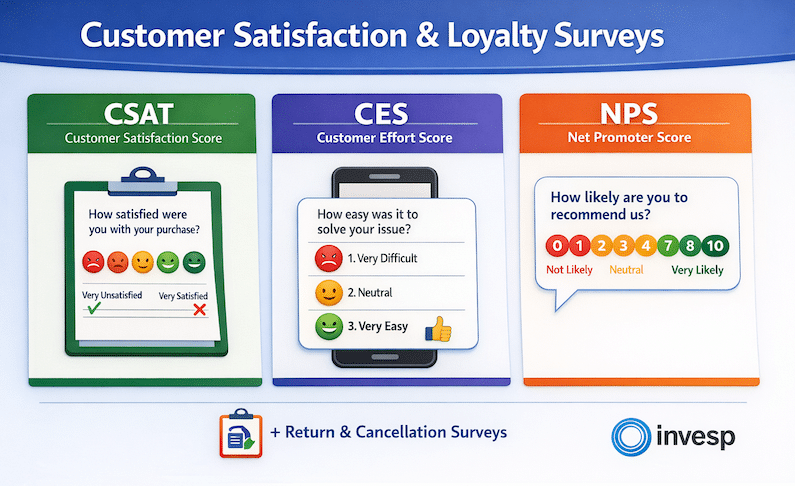
Whether it is a product return or a subscription cancellation, the "exit survey" is the final opportunity to learn. Common drivers for churn include poor product fit, better pricing from competitors, or a perceived lack of ongoing value. By categorizing these reasons, businesses can implement structural changes—such as improving product photography or adjusting subscription tiers—to mitigate future losses.
Strategic Frameworks for Survey Design
To ensure high response rates and high-quality data, the design of the survey must prioritize the user’s time and effort. Professional survey methodology emphasizes the following principles:
- Specific Targeting: Surveys should be triggered by specific behaviors (e.g., spending 60 seconds on a page without clicking) rather than being shown to every visitor.
- Low-Effort Responses: Utilizing multiple-choice options with a "clear and easy" interface encourages participation. A blank text box is often perceived as a high-effort task, whereas a list of common friction points allows for a quick selection.
- The "One-Question" Rule: To maximize completion rates, the primary inquiry should be limited to a single, direct question. An optional follow-up for additional context can be provided for users who wish to elaborate.
- Actionable Language: Questions should be phrased to elicit a specific reason for friction (e.g., "What was the one thing that almost stopped you from buying?") rather than general sentiment.
Industry Implications and Fact-Based Analysis
The integration of qualitative feedback into the CRO process reflects a broader shift in the digital economy toward "customer-centric optimization." As the cost of customer acquisition (CAC) continues to rise across platforms like Meta and Google, the ability to convert existing traffic more efficiently has become a survival imperative.
Analysis of market leaders suggests that those who successfully implement feedback loops see a measurable impact on their bottom line. For example, the brand Weezie utilized post-purchase surveys to discover that 35% of their revenue was driven by word-of-mouth—a channel that traditional digital attribution models often ignore. This insight allowed the brand to reallocate resources toward community-building initiatives rather than strictly performance marketing.
Furthermore, the "return crisis" in e-commerce—costing retailers an estimated $890 billion annually—cannot be solved through logistics alone. It requires a fundamental understanding of why the product failed to meet expectations. Surveys that identify "poor fit" or "color mismatch" as recurring issues provide the data necessary to update product descriptions, thereby reducing the overhead associated with reverse logistics.
Conclusion: The Future of Conversion Optimization
The future of digital growth lies in the synthesis of data and psychology. While AI and machine learning will continue to optimize the "what" of consumer behavior, the "why" will remain the domain of direct customer feedback. Organizations that treat surveys not as a nuisance to the user, but as a genuine tool for improvement, will be better positioned to navigate the complexities of the 2025 retail and SaaS landscapes. By identifying and removing the specific barriers at each stage of the journey, brands can build more resilient conversion funnels and foster deeper long-term loyalty. The transition from a data-informed company to a customer-informed company is no longer an option; it is the prerequisite for sustainable digital success.