In the rapidly evolving landscape of digital commerce, the ability to discern which data points reflect genuine business growth and which are merely "vanity metrics" has become a defining factor for successful enterprises. Conversion Rate Optimization (CRO) Key Performance Indicators (KPIs) serve as the essential compass for digital marketing teams, providing the empirical evidence needed to determine whether website modifications—ranging from headline adjustments to complete checkout redesigns—are yielding a positive return on investment. As organizations transition toward more data-centric decision-making frameworks, understanding the nuance between general metrics and strategic KPIs has become a prerequisite for maintaining a competitive edge in 2024 and beyond.
The Fundamental Distinction: CRO Metrics vs. CRO KPIs
To navigate the complexities of web analytics, it is necessary to distinguish between broad metrics and targeted KPIs. While a metric provides a numerical value for any given activity on a website, a KPI is a specific measurement that aligns directly with overarching business objectives. In the context of the recent industry-wide shift from Universal Analytics to Google Analytics 4 (GA4), this distinction has become even more critical, as the latter emphasizes event-based tracking over session-based tracking.
Metrics such as scroll depth, click-through rates on non-essential buttons, and general pageviews offer valuable diagnostic insights into user behavior. They help developers and UX designers identify "friction points" where users might be struggling. However, these figures do not inherently indicate business success. Conversely, a KPI is an outcome-oriented figure. If a company’s primary goal is revenue expansion, a KPI might be the purchase conversion rate or the Average Order Value (AOV). If the objective is market penetration for a SaaS platform, the KPI would likely be the trial-to-paid conversion rate.
Industry benchmarks suggest that while the average e-commerce conversion rate hovers between 2% and 3%, high-performing organizations that focus on aligning KPIs with business goals often see conversion rates exceeding 5%. This performance gap underscores the importance of selecting the right indicators to measure the efficacy of a digital strategy.
The Core Revenue and Conversion KPIs
The primary objective of most CRO initiatives is the optimization of the bottom line. To achieve this, analysts focus on a specific subset of KPIs that track the direct flow of capital and the completion of high-value actions.
1. Conversion Rate (CR)
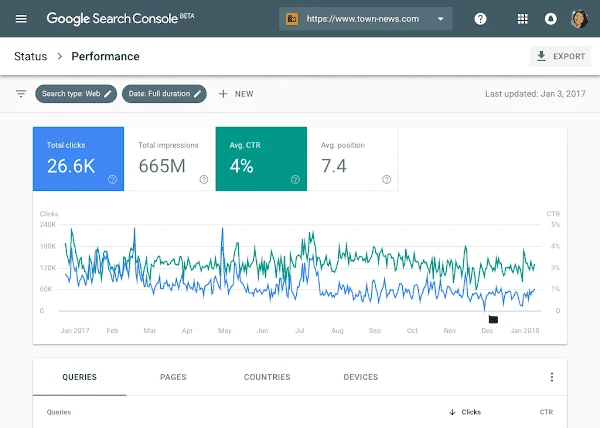
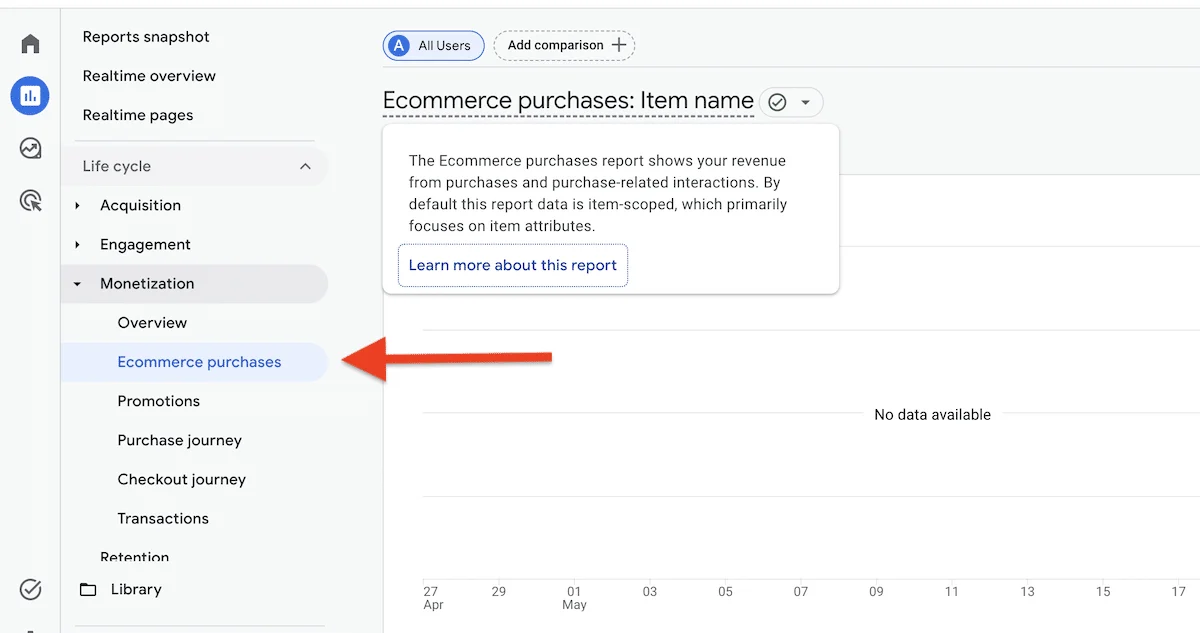
The conversion rate remains the foundational KPI for any optimization program. It is calculated by dividing the total number of successful conversions by the total number of unique visitors, then multiplying by 100. While seemingly straightforward, sophisticated teams segment this data by traffic source, device type, and user intent to gain a more granular view of performance. In the GA4 environment, this is typically tracked via "Key Events," allowing businesses to distinguish between a simple newsletter signup and a high-value product purchase.
2. Revenue Per Visitor (RPV)
Many experts consider Revenue Per Visitor to be the "ultimate" CRO KPI because it provides a holistic view of both traffic quality and site effectiveness. RPV is calculated by dividing total revenue by the total number of visitors. Unlike the standard conversion rate, RPV accounts for the monetary value of those conversions. A website could theoretically see a decrease in its conversion rate but an increase in RPV if the remaining customers are purchasing significantly more expensive items. This metric is vital for assessing the true impact of pricing changes or premium product placement.
3. Average Order Value (AOV)
AOV measures the average dollar amount spent each time a customer places an order. This KPI is particularly relevant during testing phases involving bundles, cross-selling algorithms, or free-shipping thresholds. For instance, if a retailer introduces a "Spend $75 for Free Shipping" banner, the success of this initiative is measured not by the number of orders, but by the upward movement of the AOV.
Tracking the User Journey: Funnel and Engagement KPIs
Beyond the final sale, organizations must track the efficiency of the "leaky bucket"—the various stages of the sales funnel where potential customers drop off.
Funnel Abandonment and Progression Rates
Monitoring the percentage of users who move from a product page to the cart, and from the cart to the final checkout, is essential for identifying technical or psychological barriers. According to data from the Baymard Institute, the average documented online shopping cart abandonment rate is approximately 70%. CRO initiatives aimed at simplifying the checkout process use the "Checkout Completion Rate" as their primary KPI to measure success.
Micro-Conversion Rates
In complex B2B sales cycles or high-ticket e-commerce, a single visit rarely results in an immediate sale. In these instances, tracking micro-conversions—such as downloading a whitepaper, using an interactive calculator, or spending more than three minutes on a key feature page—serves as a leading indicator of future macro-conversions.
KPIs for Lead Generation and SaaS Growth
For service-based industries and software providers, the definition of a "conversion" shifts from a transaction to a relationship.
1. Qualified Lead Rate
Total form submissions can be a misleading metric if the leads generated are not viable for the sales team. Therefore, the "Qualified Lead Rate" (the percentage of visitors who meet specific criteria to become Marketing Qualified Leads or Sales Qualified Leads) is the preferred KPI. This ensures that CRO efforts are attracting the right audience rather than just high volumes of traffic.
2. Trial-to-Paid Conversion Rate
For SaaS companies, the most critical juncture in the customer lifecycle is the transition from a free trial or "freemium" model to a paid subscription. Optimization efforts here focus on the "Activation Rate"—the point at which a user realizes the value of the software—which directly correlates to the eventual conversion to a paid tier.
A Strategic Framework for Selecting CRO KPIs
The selection of a KPI should not be arbitrary. Leading CRO agencies, including industry pioneers like Invesp, advocate for a structured framework that ensures every test is measured against its intended impact while guarding against unintended consequences.
The Primary KPI
Every optimization test or site redesign must have one primary KPI. This is the single "north star" metric that determines whether the experiment was a success or a failure. If the goal is to increase the number of demo bookings, the primary KPI is the demo booking rate.
Diagnostic KPIs
Diagnostic metrics are used to explain the "why" behind the movement of the primary KPI. If a headline change leads to a higher conversion rate, diagnostic metrics like "Click-Through Rate on the CTA" or "Average Time on Page" can help confirm if the headline actually increased user engagement or if other factors were at play.
Guardrail KPIs
Guardrail KPIs are essential for preventing "downstream damage." For example, a marketing team might drastically simplify a lead generation form to increase the conversion rate. While the primary KPI (Conversion Rate) might go up, a guardrail KPI (Lead Quality or Sales Close Rate) might plummet because the leads are no longer vetted. By monitoring guardrails, businesses ensure that short-term gains on one page do not lead to long-term losses for the company.
The Role of Segmentation in KPI Analysis
Data in aggregate is often misleading. The most effective CRO programs rely heavily on segmentation to understand how different cohorts interact with the site.
- Device Segmentation: Mobile users often have higher bounce rates and lower AOV than desktop users due to the "on-the-go" nature of mobile browsing.
- Traffic Source: Visitors arriving via organic search for a specific product often convert at a higher rate than those arriving via a broad social media advertisement.
- Geographic Data: Regional differences in shipping costs, currency, and cultural preferences can significantly impact conversion KPIs.
By analyzing KPIs through the lens of these segments, businesses can tailor their optimization strategies to specific user groups, leading to more personalized and effective user experiences.
Implementation and Reporting: Communicating Value to Stakeholders
The final stage of a mature CRO program is the effective reporting of these KPIs to executive leadership and cross-functional teams. A professional CRO dashboard should be more than a collection of charts; it should tell a story of business impact.
Effective reporting focuses on:
- Incremental Lift: Showing the percentage increase in the primary KPI compared to the baseline.
- Estimated Revenue Impact: Translating conversion increases into projected annual revenue.
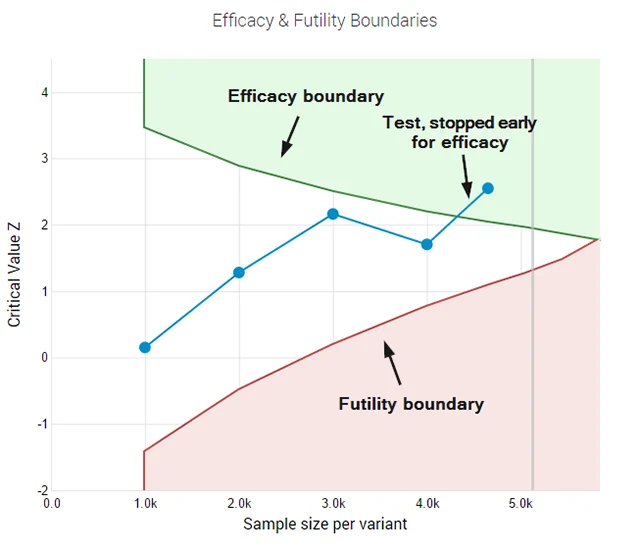
- Statistical Significance: Ensuring that the changes observed in the KPIs are not the result of random chance, typically requiring a confidence level of 95% or higher.
As the digital marketplace becomes increasingly crowded, the cost of customer acquisition continues to rise. In this environment, the ability to optimize existing traffic through the rigorous application of CRO KPIs is no longer an optional luxury—it is a strategic necessity. By focusing on the numbers that truly align with business goals, organizations can transform their websites from static brochures into dynamic engines of growth, ensuring that every click has the potential to contribute to the bottom line.