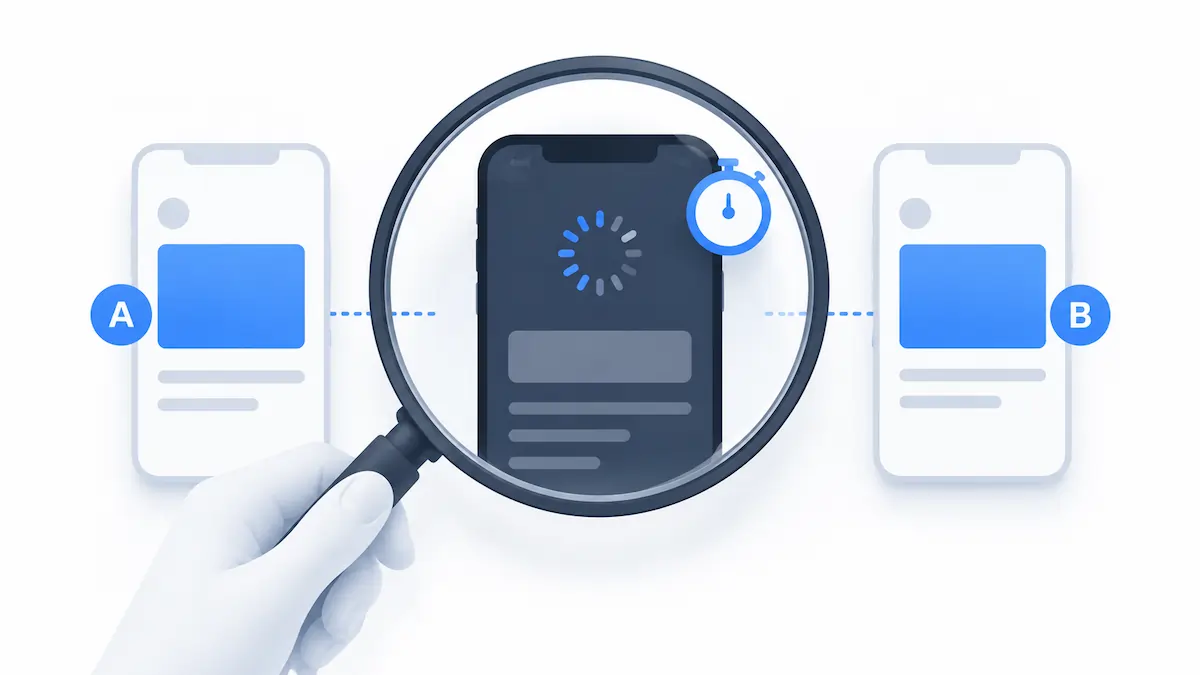
Digital marketing professionals and data analysts have long grappled with a persistent technical challenge in the field of conversion rate optimization: the inevitable data mismatch between A/B testing tools and primary analytics suites like Google Analytics 4 (GA4). While minor discrepancies have historically been dismissed as rounding errors or differences in attribution logic, new research into browser behavior and network conditions suggests that the gap is often driven by hardware and connectivity limitations rather than simple configuration errors. For organizations relying on data-driven experimentation to justify marketing spend, understanding the technical chasm between synchronous testing scripts and asynchronous analytics beacons has become a critical requirement for maintaining data integrity.
The fundamental disagreement between tools often manifests when an A/B testing platform, such as Convert Experiences, reports a specific number of unique visitors, while GA4 shows a significantly lower figure for the same timeframe and experiment. This discrepancy typically hovers between 5% and 10% in well-configured environments, but can exceed 20% in scenarios involving mobile-heavy traffic or regions with inconsistent internet infrastructure. Recent investigations by technical teams indicate that the “truth” of the data is often found not in a single tool, but in the intersection of how different scripts are prioritized by the visitor’s browser.
The Technical Evolution of Tracking Discrepancies
The shift from Universal Analytics (UA) to Google Analytics 4 marked a significant turning point in how web data is processed. UA relied heavily on session-based logic, whereas GA4 adopted an event-driven model. While this shift was designed to provide a more granular view of the user journey, it also introduced new complexities in how data is queued and transmitted. In the legacy era of web optimization, tracking scripts were often simpler and less demanding of browser resources. Today, the modern web stack is crowded with consent banners, tag managers, heatmapping tools, and heavy JavaScript frameworks, all competing for the same narrow window of processing power.
The chronology of this issue tracks back to the widespread adoption of asynchronous loading. To prevent tracking scripts from “blocking” the rendering of a page—which would frustrate users and harm search engine rankings—most analytics providers moved to asynchronous delivery. However, A/B testing tools must often remain synchronous or sit at the very top of the <head> tag to prevent “flicker,” the phenomenon where a user sees the original version of a page for a split second before the experiment variation loads. This structural difference creates a chronological gap in when these two tools begin their work.
The Impact of Network Latency and Device Performance
Research conducted over a two-year period, involving the auditing of dozens of enterprise-level GA4 implementations, has identified network conditions as the primary culprit behind unexplained data loss. The tracking script for an experimentation tool typically fires the moment a page starts loading. In contrast, GA4 events are queued behind other browser tasks. On high-speed 5G connections and modern hardware, this queue clears in a matter of milliseconds, making the delay imperceptible.
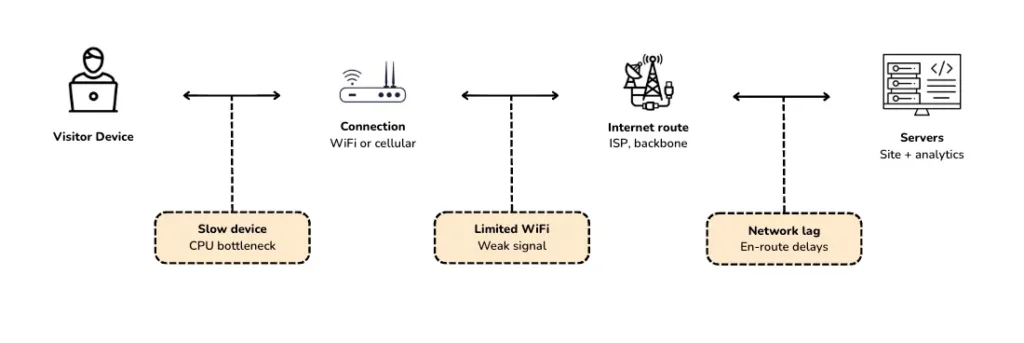
However, the global landscape of connectivity is far from uniform. According to data from the CTIA, as of 2025, only approximately half of cellular connections in the United States are on 5G networks. The remainder utilize LTE or even slower protocols. Furthermore, mobile network reports from organizations like Opensignal indicate that even users with 5G-capable devices frequently drop down to 4G speeds depending on their physical location or network congestion.
On a “slow” device—such as a five-year-old smartphone or a laptop on a congested public Wi-Fi network—the GA4 event queue may not clear before the user navigates away or closes the tab. In these instances, the A/B testing tool, which fired synchronously in the header, successfully logs the visitor. GA4, waiting for its turn in the processing queue, never gets the chance to fire its page_view event. Consequently, that user exists in the testing data but is entirely invisible to the analytics platform.
Patterns of Data Loss in the Conversion Funnel
Analysis of controlled testing environments has revealed three distinct patterns that characterize network-driven data loss. The first and most prominent is the “20-second delay.” In environments simulating slow 3G or 4G conditions, researchers observed that GA4’s initial page_view event frequently failed to fire for up to 20 seconds after the page began to load. For a typical user, 20 seconds is more than enough time to skim a landing page and bounce. If the user leaves before that 20-second threshold, the session is never registered in GA4, creating an immediate deficit in the user count.

The second pattern is the specific “funnel shape” of the data discrepancy. If data loss were random or caused by a general configuration error, one would expect to see a consistent 5% or 10% gap across all stages of the conversion funnel. Instead, the data shows that the largest gaps occur at the very top of the funnel (initial entry) and at the final conversion point. The middle of the funnel—events like “add to cart” or “view product details”—often shows much higher alignment between tools.
This occurs because users who reach the middle of the funnel have, by definition, remained on the site long enough to overcome the initial loading bottleneck. Their subsequent events fire as expected because the browser has already finished the heavy lifting of the initial page load. However, the final conversion point often involves a redirect or a new page load (such as a “Thank You” page), which reintroduces the risk of network-driven latency, leading to a secondary gap in the data.
The Google Tag Manager “Window Loaded” Trap
A significant finding from recent audits contradicts a common piece of advice often given to web developers and SEO specialists. To improve Core Web Vitals and page speed scores, many developers configure Google Tag Manager (GTM) to fire analytics tags only when the “Window Loaded” trigger is reached. While this technically improves performance metrics by ensuring the analytics script doesn’t compete with image or text rendering, it dramatically increases the risk of data loss.

On a slow network, the time between the initial page load and the “Window Loaded” state can be several seconds. By delaying the firing of the GA4 tag to this late stage, organizations are effectively filtering out their most impatient or connection-challenged users from their data. While the page speed reports may look better, the resulting analytics data becomes skewed toward users with high-end devices and stable connections, leading to an inaccurate representation of the total audience and experiment performance.
Diagnostic Methodology for Data Alignment
To address these discrepancies, analysts are encouraged to move beyond a search for “perfect” accuracy and instead adopt a rigorous diagnostic framework. This process begins with ensuring that the comparison between tools is fundamentally sound. A common error involves comparing “Visitors” in a testing tool to “Sessions” in GA4. Because a single visitor can initiate multiple sessions, this is an “apples-to-oranges” comparison. Analysts must instead compare unique visitors to GA4 “Users.”
The second phase of diagnosis involves segmenting data by device category. If the gap between the testing tool and GA4 is negligible on desktop devices but substantial on mobile, network conditions and hardware performance are almost certainly the cause. Furthermore, by comparing conversion funnels side-by-side, analysts can look for the “network-loss signature.” If the discrepancy is concentrated at the entry and exit points of the funnel while the middle remains stable, it confirms that the issue is related to initial load times rather than a broken integration.

Finally, organizations are increasingly turning to server-side data as a “source of truth.” Unlike client-side scripts, which run in the user’s browser and are subject to local network conditions, server-side tracking occurs on the organization’s own infrastructure. By cross-referencing A/B test results with backend CRM data or server logs, companies can determine if the shortfalls in GA4 are a result of users not converting or simply a result of the tracking beacons failing to reach Google’s servers.
Implications for the Experimentation Industry
The realization that a significant portion of data drift is caused by the physical realities of the internet has profound implications for how A/B tests are interpreted. If a variation performs exceptionally well among users with fast connections but fails to be tracked among users on slower networks, the resulting data may lead to biased business decisions. This “survivorship bias” in analytics can cause companies to over-optimize for high-end demographics while ignoring the needs of users in developing markets or those using older hardware.
As the industry moves forward, the adoption of server-side experimentation and edge computing is expected to mitigate many of these issues. By moving the “logic” of the experiment and the “logging” of the data away from the client’s browser and onto the server, organizations can achieve near-perfect data alignment. Until such technologies become the standard, the prevailing wisdom among data scientists remains: do not chase 100% accuracy, but rather investigate any drift that exceeds the 5-15% threshold. In the world of digital experimentation, understanding the “why” behind the gap is often more valuable than the numbers themselves.