Social media engagement rate stands as a pivotal metric in the contemporary digital landscape, serving as a critical indicator of how effectively content resonates with its intended audience. Far beyond mere follower counts, engagement rate quantifies the level of active interaction a piece of content, a specific campaign, or an entire social media account garners relative to its reach or audience size. This metric has become the currency of social media success, reflecting genuine audience interest and providing invaluable insights into content performance and strategic effectiveness.
The Evolving Significance of Engagement in Digital Strategy
The shift towards prioritizing engagement metrics stems from the evolution of social media algorithms. Platforms like Instagram, Facebook, TikTok, and X (formerly Twitter) increasingly favor content that generates meaningful interactions, surfacing it to wider audiences. This algorithmic preference means that higher engagement rates directly translate to enhanced organic visibility, a crucial factor for brands and creators aiming to cut through the noise without relying solely on paid promotions. Furthermore, a highly engaged audience signals trustworthiness and appeal to new profile visitors, fostering a sense of community and authenticity. For businesses, particularly enterprise teams, engagement rate provides a tangible measure of social media return on investment (ROI), linking content performance directly to audience behavior and strategic outcomes. This metric moves beyond superficial vanity figures, offering a deeper understanding of content efficacy and audience connection.

Defining Engagement Across Diverse Platforms
While the core concept of engagement involves user interaction, the specific actions that qualify as engagement vary considerably across social media platforms. Understanding these distinctions is fundamental for accurate measurement and fair cross-channel performance comparisons. Generally, engagement encompasses actions such as likes, comments, shares, saves, poll responses, direct messages, and link clicks. However, each platform has its unique nuances:
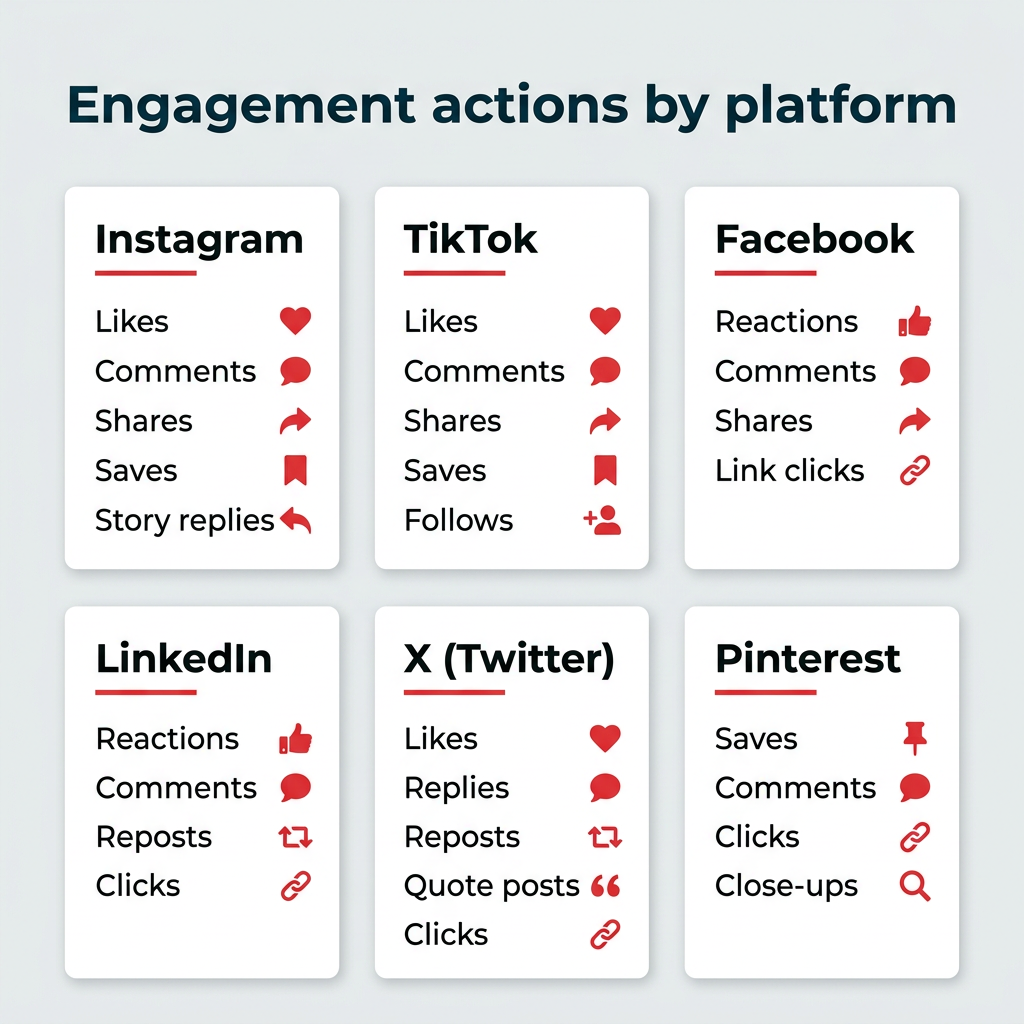
- Facebook: Typically includes likes, reactions, comments, shares, and clicks (link clicks, photo views, video plays).
- Instagram: Focuses on likes, comments, shares, saves, and story interactions (replies, sticker taps). Reels engagement often includes plays, likes, comments, and shares.
- X (formerly Twitter): Measured by likes, retweets, replies, quote tweets, and clicks (link clicks, profile clicks, media views).
- LinkedIn: Emphasizes likes, comments, shares, and clicks (link clicks, company page clicks).
- TikTok: Primarily driven by likes, comments, shares, saves, and video views (often tied to re-watches and completion rates).
It is important to note that passive metrics such as impressions and raw views, while indicating exposure, are generally not counted as direct engagement unless they involve a deliberate user action beyond mere consumption. Marketers must consult each platform’s native analytics to confirm the precise actions included in their engagement calculations, ensuring consistency and accuracy in reporting.
Methodologies for Calculating Engagement Rate

The method chosen for calculating engagement rate significantly influences the insights derived. There are several widely accepted formulas, each offering a distinct perspective on content performance relative to a specific denominator. Selecting the appropriate formula depends on the marketing objective and the type of content being analyzed.
-
Engagement Rate by Reach (ERR): The Standard for Organic Content
This is arguably the most common and often most accurate engagement rate formula for organic content. ERR measures the percentage of people who interacted with a post after having seen it.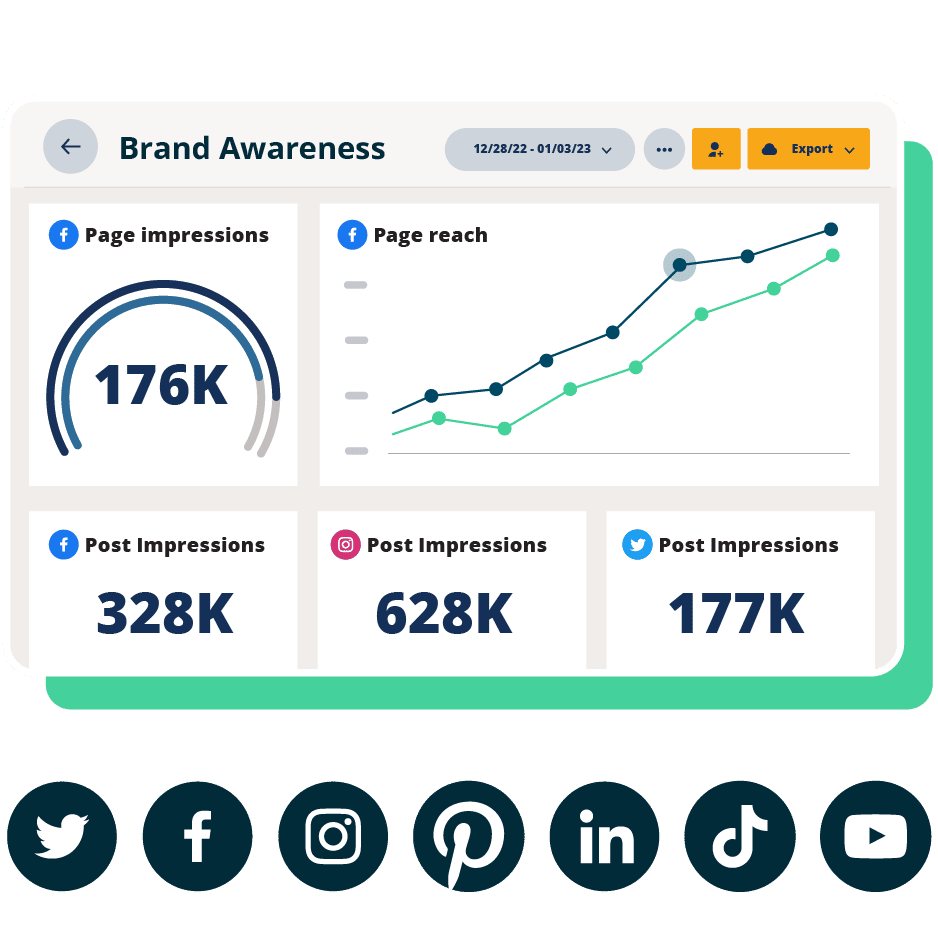
- Formula: ERR = (Total Engagements on a Post / Reach of that Post) * 100
- Average ERR: (Sum of ERR for each post / Total Number of Posts)
- Advantages: Provides a realistic view of how content performs with its actual audience, including both followers and non-followers who discovered it organically. It accounts for the fact that not all followers see every post due to algorithmic filtering.
- Limitations: Reach can be a fluctuating variable, making comparisons over time potentially inconsistent. A very low reach might disproportionately inflate the engagement rate, while a high reach with static engagement might depress it.
-
Engagement Rate by Post (ER Post): Ideal for Post-by-Post Comparisons
ER post measures audience interaction against the total follower count, offering a stable baseline for comparing the performance of individual posts. This method is frequently favored by social media influencers for calculating their average engagement.- Formula: ER Post = (Total Engagements on a Post / Total Followers) * 100
- Average ER Post: (Sum of ER Post for each post / Total Number of Posts)
- Advantages: Provides a consistent metric for evaluating content performance relative to a fixed audience size. It simplifies comparisons between different posts or content types.
- Limitations: This formula does not account for viral reach beyond the existing follower base, potentially underestimating the true impact of highly shareable content. As follower counts grow, this rate naturally tends to decrease unless engagement scales proportionally.
-
Engagement Rate by Impressions (ER Impressions): Best for Paid Campaigns
ER impressions assesses the number of engagements a post receives compared to the total number of times it was displayed (impressions). Impressions count every instance a piece of content appears on a screen, even if the same user sees it multiple times.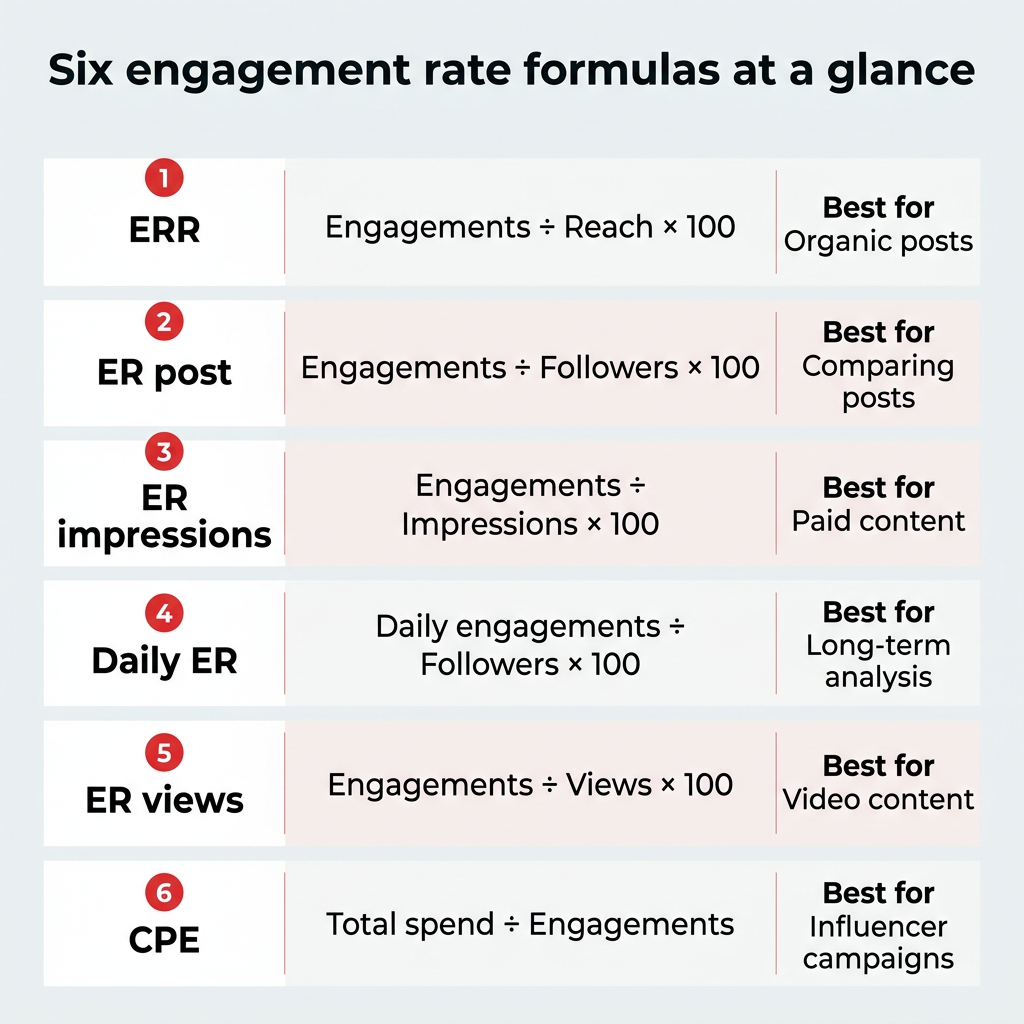
- Formula: ER Impressions = (Total Engagements on a Post / Total Impressions) * 100
- Average ER Impressions: (Sum of ER Impressions for each post / Total Number of Posts)
- Advantages: Highly effective for measuring the success of paid content, particularly those with a Cost Per Mille (CPM) structure. It directly ties engagement to exposure frequency.
- Limitations: This rate is typically lower than ERR or ER Post because impressions are often significantly higher than unique reach. Users are unlikely to engage with the same content multiple times, even if they see it repeatedly. Impressions can also be inconsistent, making interpretation challenging.
-
Daily Engagement Rate (Daily ER): For Long-Term Account Health
Daily ER gauges how frequently followers interact with an account on an average day, considering engagements on all posts, regardless of their original publication date within the reporting period.- Formula: Daily ER = (Total Engagements in a Day / Total Followers) * 100
- Average Daily ER: (Total Engagements for X days / (X Total Followers)) 100
- Advantages: Provides a holistic view of overall account activity, capturing interactions with evergreen content and older posts. It can be tailored to specific actions (e.g., daily comments, daily saves) based on strategic objectives.
- Limitations: This formula cannot differentiate between a single highly active follower and multiple less active ones. Its volume can also fluctuate significantly based on the amount of content published daily, requiring contextual analysis.
-
Engagement Rate by Views (ER Views): Tailored for Video Content
ER views measures the level of engagement a video receives relative to its total view count.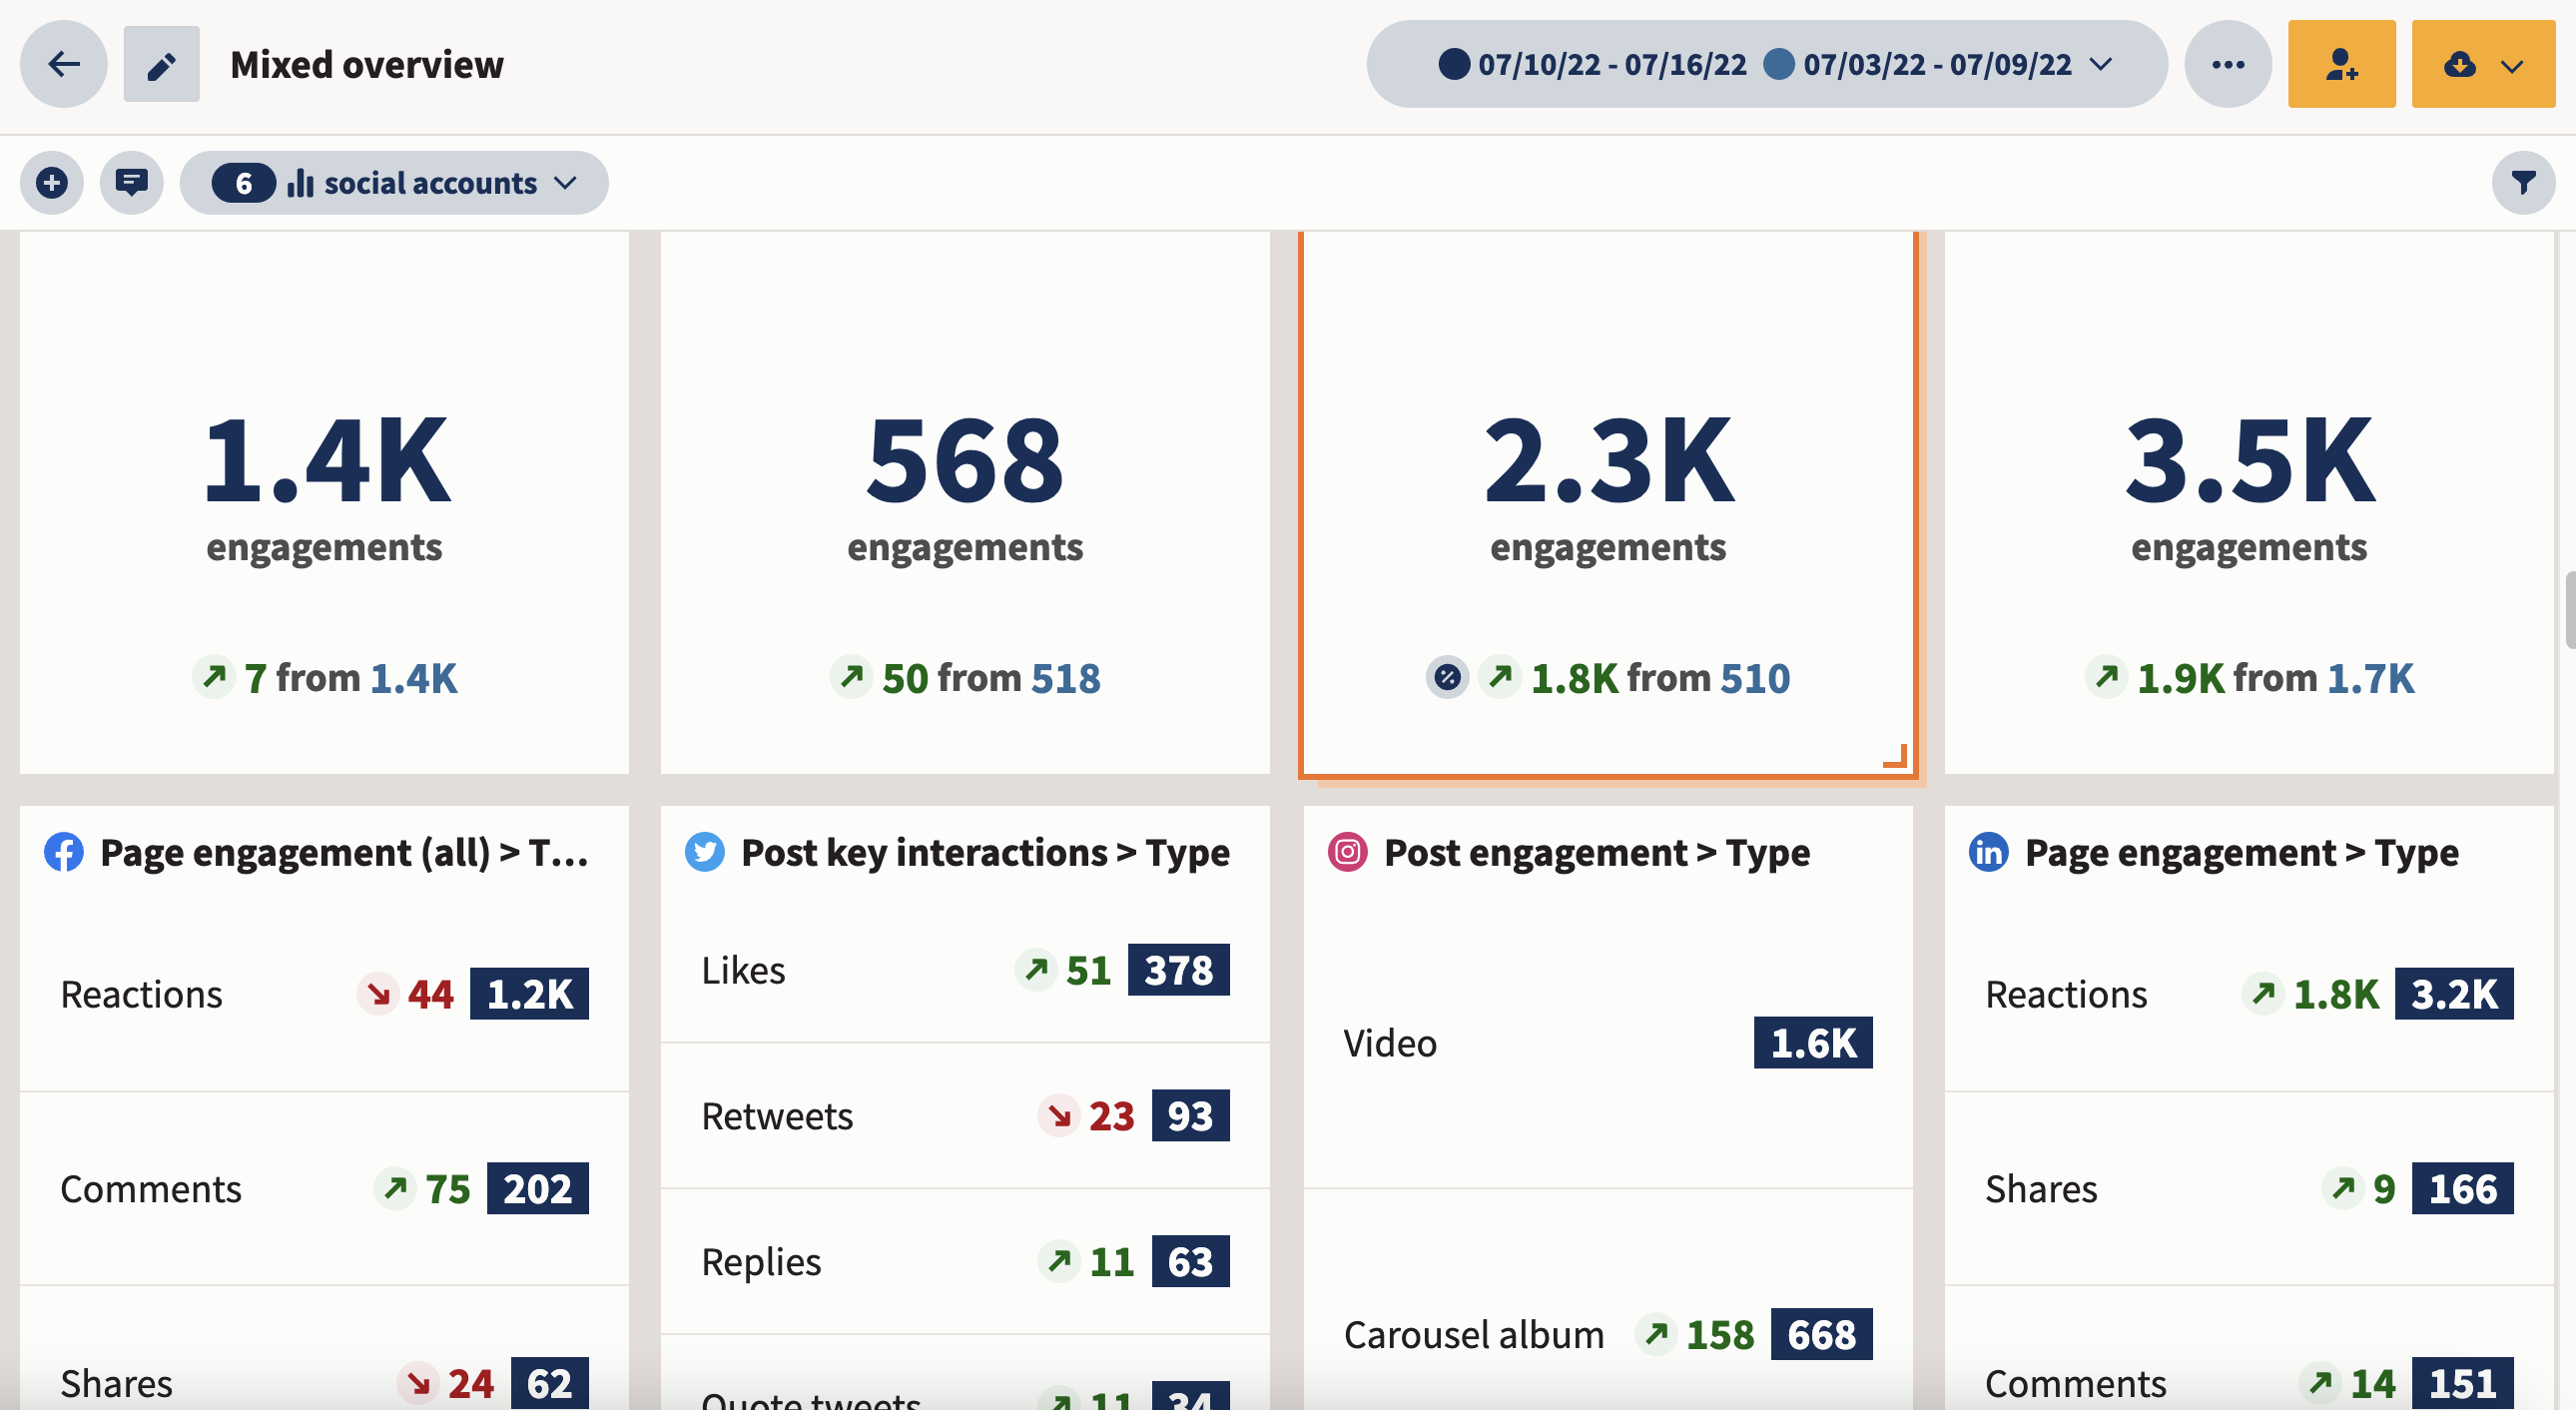
- Formula: ER Views = (Total Engagements on Video Post / Total Video Views) * 100
- Average ER Views: (Sum of ER Views for each post / Total Number of Posts)
- Advantages: Excellent for assessing the effectiveness of video content in generating active responses, especially if engagement is a primary objective.
- Limitations: View counts often include repeat views from the same user, which can dilute the engagement rate compared to unique viewer metrics.
-
Cost Per Engagement (CPE): Financial Efficiency of Interactions
CPE calculates the financial investment required to generate each engagement within a campaign, often used in influencer marketing or conversion-focused campaigns.- Formula: CPE = (Total Amount Spent / Total Engagements)
- Advantages: Directly demonstrates the cost-efficiency of interactions, making it crucial for budget allocation and ROI analysis in paid social media efforts.
- Limitations: Requires a clear and consistent definition of what constitutes an “engagement” across all platforms and campaign elements to ensure accurate comparison.
Automated Analytics: Streamlining Engagement Measurement

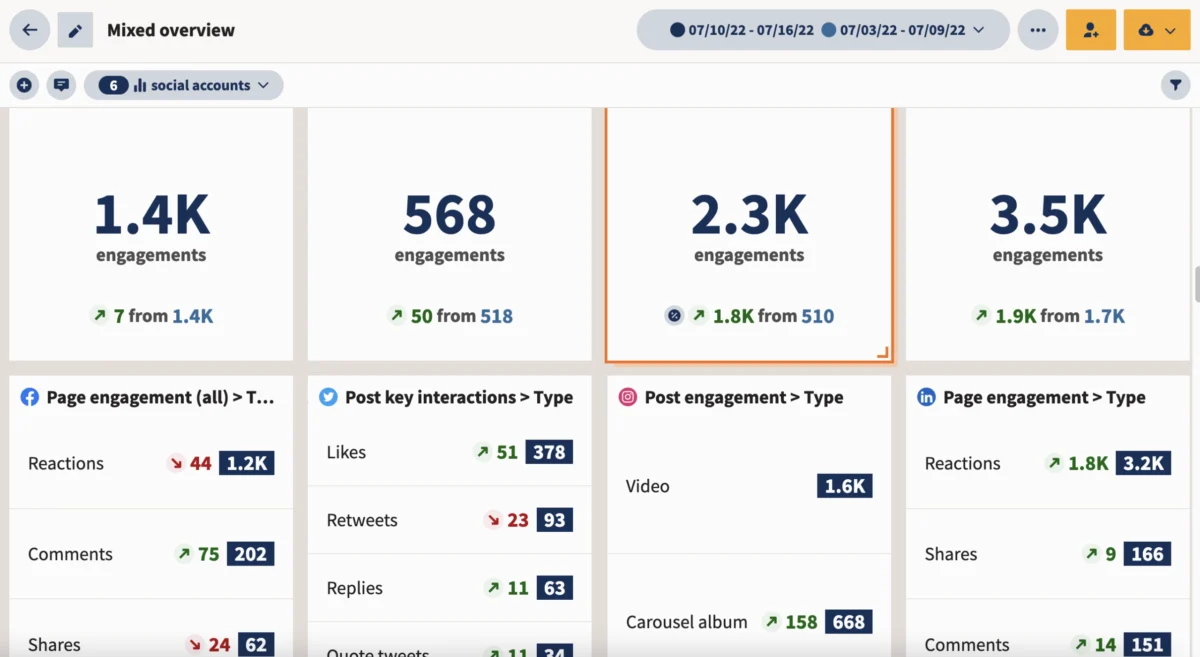
In an increasingly complex social media ecosystem, manual calculation of engagement rates across multiple platforms and campaigns can be time-consuming and prone to error. Social media analytics tools, such as Hootsuite, have become indispensable for automating this process. These platforms collect comprehensive engagement data, apply standard formulas, and present insights in intuitive dashboards. This multi-platform tracking capability saves countless hours of manual spreadsheet work for enterprise teams, allowing them to focus on strategic analysis rather than data compilation. Automated tools provide cross-platform comparisons, identify top-performing content types, reveal optimal posting times, and generate customizable reports, empowering marketers to make data-driven decisions swiftly and efficiently.
Engagement Rate Benchmarks for 2026: An Industry Outlook
While a “good” engagement rate is often cited as falling between 1% and 5%, this range is a broad generalization. True benchmarks are highly dependent on factors such as the specific social media platform, the industry, the size of the audience, and the type of content published. Hootsuite, in partnership with data science agency Critical Truth, conducted a comprehensive analysis of over one million social posts across various industries and networks to establish reliable benchmarks for 2026. This study provides a vital reference point for marketers to set realistic goals and evaluate their performance.
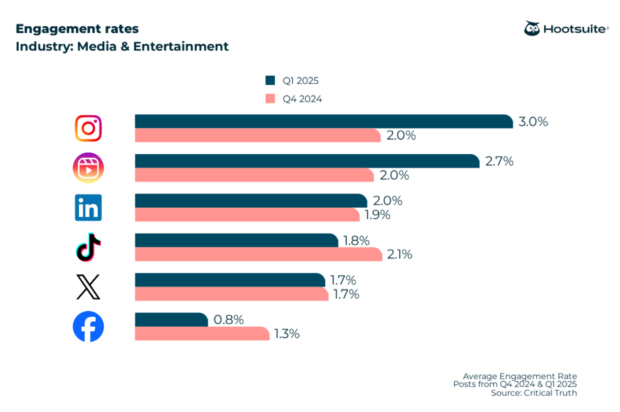
Overall Engagement Rate Benchmarks (All Industries):
- Instagram: 3%
- Instagram Reels: 2.7%
- LinkedIn: 2%
- X (formerly Twitter): 1.8%
- TikTok: 1.5%
- Facebook: 0.8%
These figures highlight Instagram’s continued dominance in driving interactions, particularly through its visual and short-form video content (Reels). Facebook, despite its massive user base, exhibits a lower average engagement rate, reflecting its mature platform status and potentially higher competition for attention.
Industry-Specific Benchmarks:
-
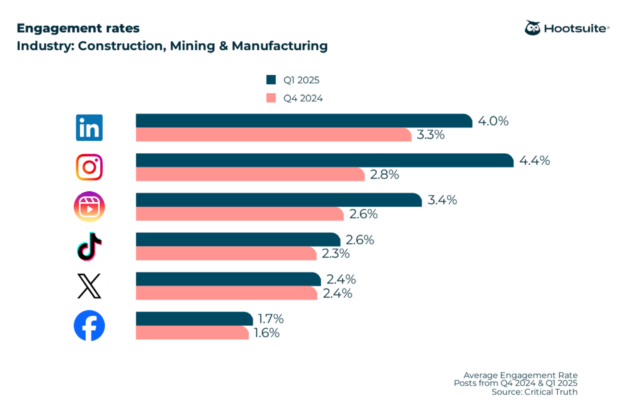
Construction, Mining, and Manufacturing: This sector often thrives on showcasing tangible projects and innovation. Instagram leads at 4.4%, followed by LinkedIn at 2.6%, X at 1.9%, TikTok at 1.7%, and Facebook at 0.9%. The visual nature of Instagram is well-suited for displaying heavy machinery, ongoing projects, and finished products.
-
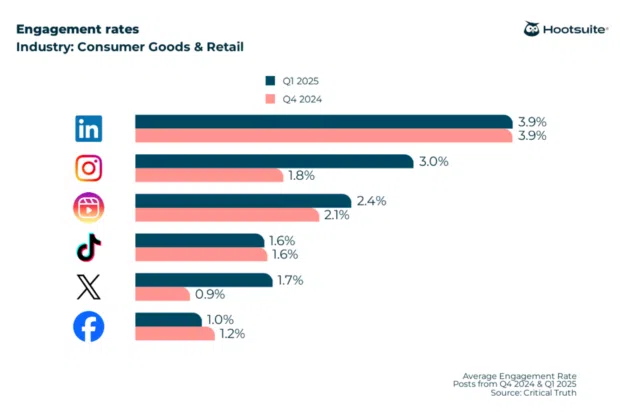
Consumer Goods and Retail: Brands in this space heavily rely on visual appeal and direct consumer interaction. LinkedIn surprisingly shows the highest rate at 3.9%, suggesting strong B2B engagement or professional branding efforts. Instagram follows closely at 3.4% (Reels at 3.1%), TikTok at 1.7%, X at 1.5%, and Facebook at 0.7%.
-
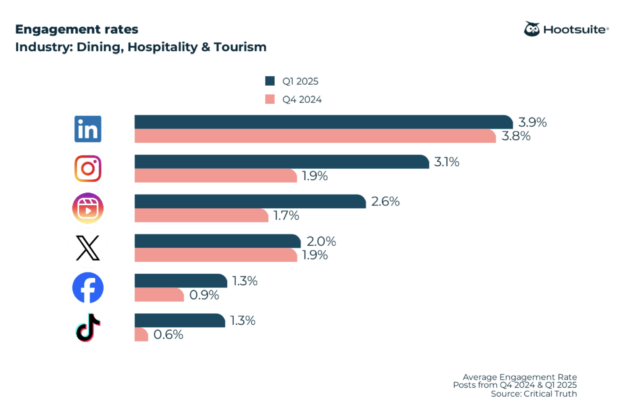
Dining, Hospitality, and Tourism: These industries inherently lend themselves to highly visual and aspirational content. Instagram posts average 3.7% (Reels at 3.2%), followed by LinkedIn at 2.2%, TikTok at 1.9%, X at 1.7%, and Facebook at 0.8%. Visual storytelling around experiences, food, and destinations drives strong interaction.
-
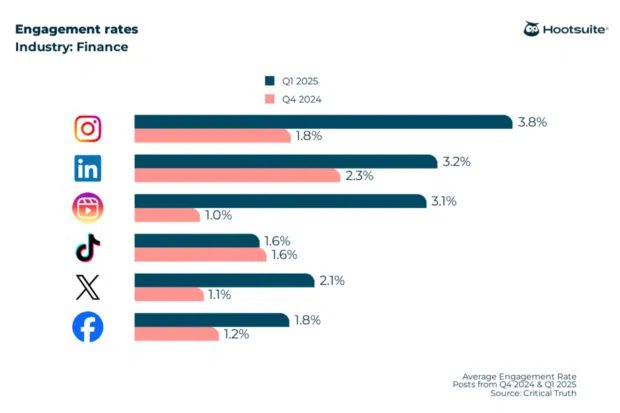
Finance: Due to regulatory environments and the serious nature of financial topics, engagement often differs. Instagram performs strongly at 3.8% (Reels at 3.5%), indicating a successful effort to humanize finance through visual storytelling. LinkedIn stands at 2.5%, X at 1.7%, TikTok at 1.2%, and Facebook at 0.7%.
-
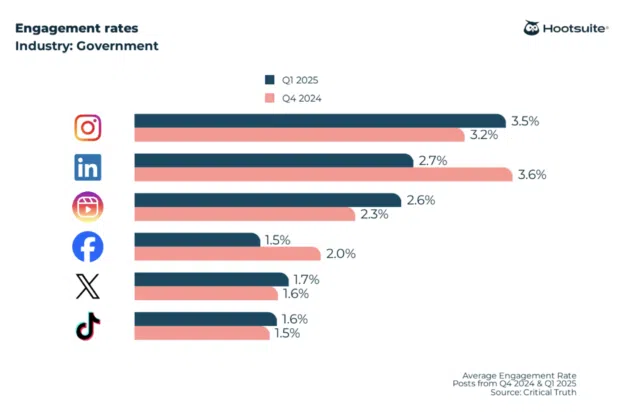
Government: Government entities face unique challenges in engagement, often prioritizing information dissemination over direct interaction. Instagram shows a strong 4.1% (Reels at 3.8%), suggesting visual content and short updates resonate well. LinkedIn is at 2.1%, X at 1.9%, TikTok at 1.4%, and Facebook at 0.9%.
-
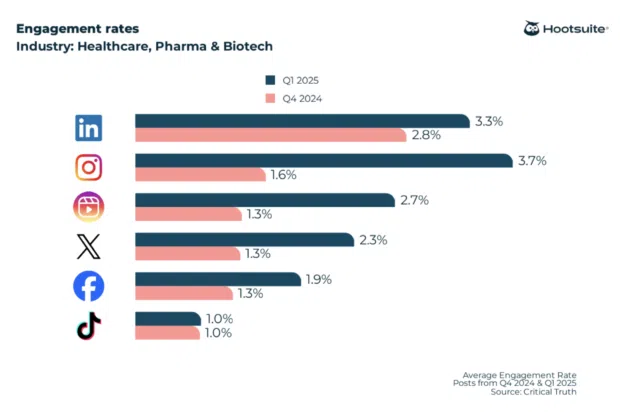
Healthcare, Pharma, and Biotech: Similar to finance, this sector navigates sensitive topics. Instagram leads at 3.9% (Reels at 3.6%), indicating a successful use of visual and educational content. LinkedIn is at 2.3%, X at 1.8%, TikTok at 1.3%, and Facebook at 0.7%.
-
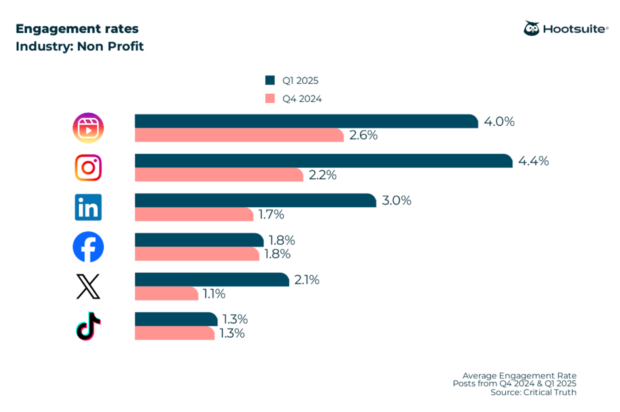
Nonprofit: Nonprofits excel at emotional storytelling and community building. Instagram is a powerhouse at 4.4% (Reels at 3.9%), demonstrating the platform’s effectiveness for sharing impact stories. LinkedIn is at 2.7%, TikTok at 1.8%, X at 1.6%, and Facebook at 0.8%.
These benchmarks underscore the importance of comparing performance against relevant industry and platform averages rather than a universal standard. They serve as a guide for marketers to identify opportunities for improvement and strategize content that aligns with platform strengths and audience expectations.
Strategies for Elevating Social Media Engagement
Improving engagement rates requires a continuous cycle of analysis, experimentation, and adaptation. The most effective strategies are rooted in understanding what resonates with the target audience and consistently delivering value.
- Analyze High-Performing Content: Regularly review analytics to identify patterns in successful posts. What topics, formats (e.g., carousels, Reels, live video), and calls to action consistently drive interaction? Duplicate these successful elements.
- Post at Optimal Times: Utilize analytics to pinpoint when the target audience is most active and receptive to content. Scheduling posts during these peak windows maximizes immediate visibility and interaction.
- Experiment with Diverse Content Formats: Social media users consume content in various ways. Incorporate a mix of images, short-form videos (Reels, TikToks), carousels, stories, polls, quizzes, and live streams to keep content fresh and appealing.
- Foster Community Interaction: Beyond simply responding to comments, proactively ask questions, run Q&A sessions, encourage user-generated content, and participate in relevant conversations. Authenticity and responsiveness build stronger connections.
- Incorporate Clear Calls to Action (CTAs): Guide your audience on what to do next. Whether it’s “tag a friend,” “share your thoughts,” “click the link in bio,” or “save for later,” clear CTAs can significantly boost engagement.
- Leverage User-Generated Content (UGC): Encourage followers to share their experiences with your brand. Reposting UGC not only provides authentic content but also makes your audience feel valued and heard.
- Run Contests and Giveaways: These can provide short-term boosts in engagement, reach, and follower growth by incentivizing interaction. Ensure the contest mechanics align with engagement goals (e.g., “comment to enter,” “tag a friend”).
- Collaborate with Influencers: Partnering with relevant influencers can expose your brand to new, engaged audiences who trust the influencer’s recommendations.
- Stay Current with Trends: Integrate trending topics, sounds, and challenges into content where appropriate. This can increase relevance and visibility on platforms like TikTok and Instagram Reels.
- A/B Test Content Variations: Experiment with different headlines, visuals, CTAs, and posting times to scientifically determine what generates the highest engagement.
Strategic Application of Engagement Data
Engagement rate data is not merely a reporting figure; it is a powerful tool for strategic decision-making. By tracking trends over time and applying these insights, organizations can refine their content planning, optimize resource allocation, and enhance overall social media ROI. The data helps in identifying audience preferences, understanding content gaps, and demonstrating the tangible impact of social media efforts to leadership. Ultimately, a focus on engagement transforms social media from a broadcasting channel into a dynamic platform for building relationships, fostering loyalty, and driving measurable business outcomes. The continued evolution of social media algorithms and user behavior underscores the indispensable role of active engagement in a successful digital marketing strategy.