

The landscape of digital commerce has undergone a radical transformation over the last decade, shifting from a focus on raw traffic to a sophisticated discipline known as Conversion Rate Optimization (CRO). At the heart of this discipline are Key Performance Indicators (KPIs), the specific metrics that allow organizations to determine whether website modifications—ranging from headline changes to checkout redesigns—are driving genuine business value. Unlike standard metrics that track general activity, CRO KPIs are specifically designed to align digital behavior with bottom-line business objectives.
The distinction between a general metric and a KPI is fundamental to modern data science. While a website may track dozens of data points, such as bounce rates, scroll depth, and pageviews, these are often diagnostic in nature. A KPI, by contrast, is a targeted metric used to judge the success of a specific business goal. For an e-commerce entity, this might be Revenue Per Visitor (RPV); for a B2B SaaS company, it may be the Trial-to-Paid Conversion Rate. Understanding this hierarchy is the first step in moving from data collection to data-driven decision-making.
The Evolution of Digital Performance Tracking
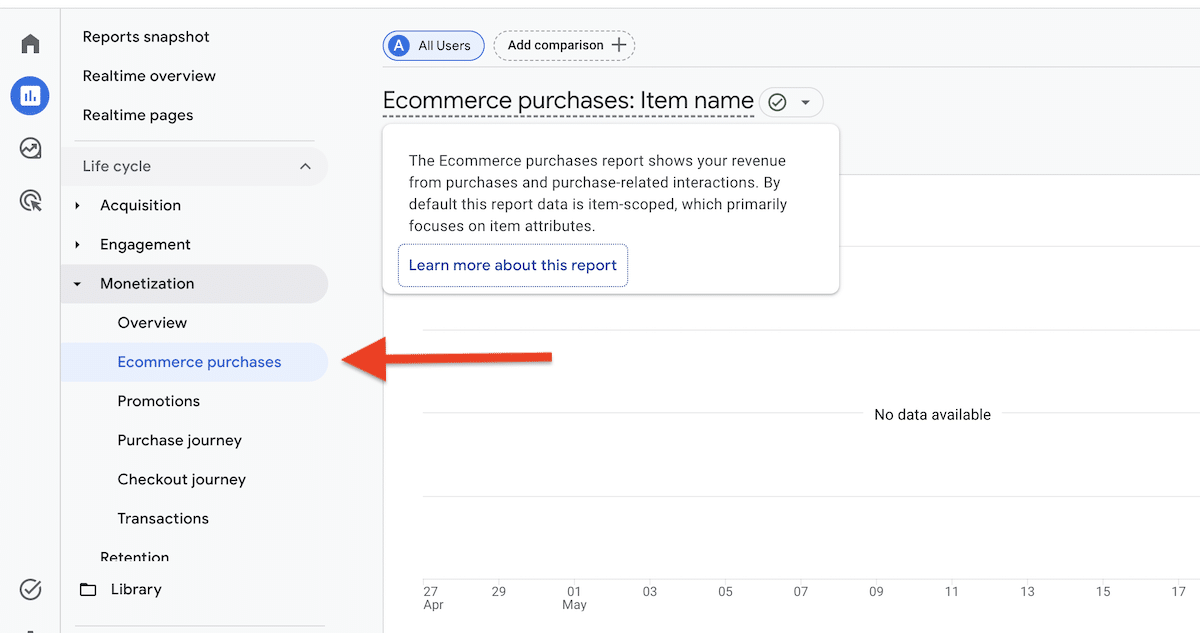
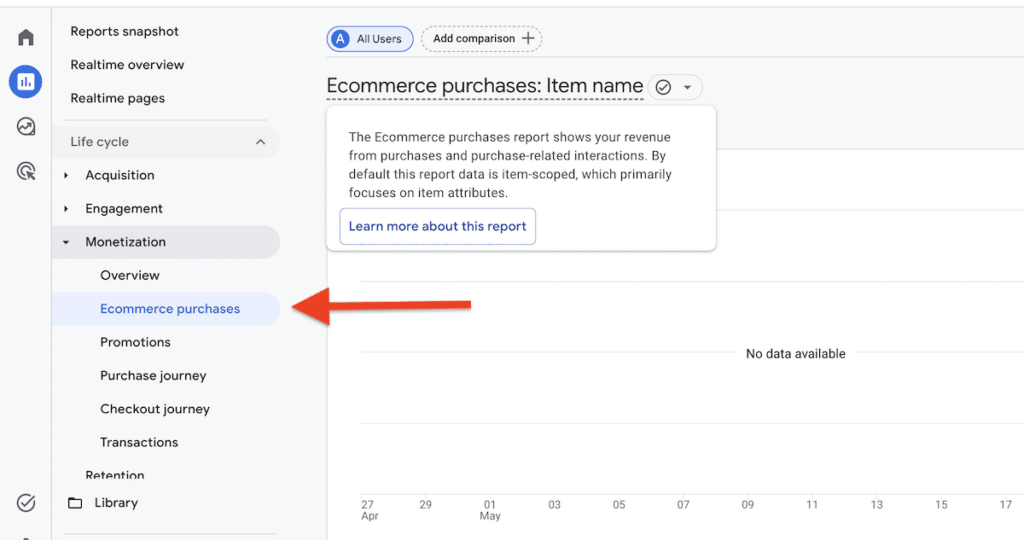
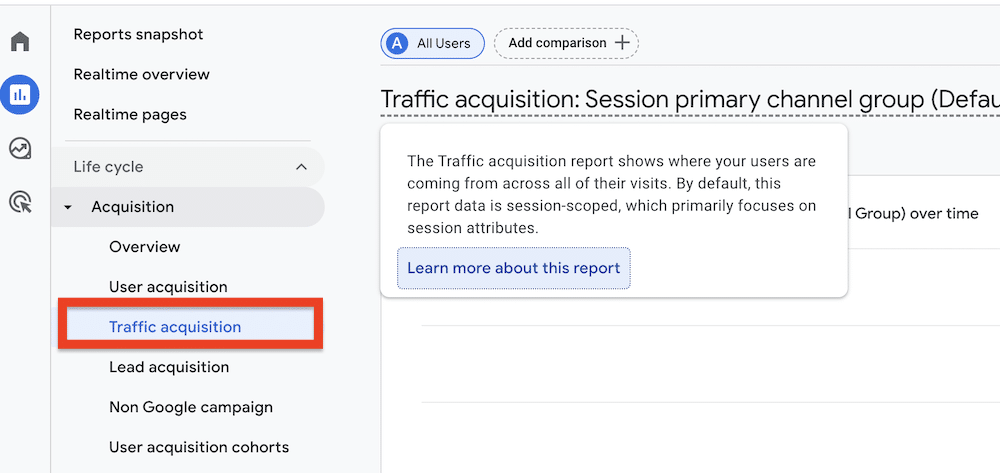
The history of digital tracking has moved through several distinct eras. In the early 2000s, businesses focused on "hits" and pageviews. By the 2010s, the focus shifted to session-based tracking through platforms like Universal Analytics. However, the current era, defined by the transition to Google Analytics 4 (GA4), focuses on event-based tracking. This shift allows for a more granular understanding of the user journey, enabling CRO professionals to track specific interactions like form starts, video plays, and partial checkouts as "key events."
This chronological shift has forced marketers to become more selective. With the abundance of data now available, the challenge is no longer gathering information, but filtering out "vanity metrics"—numbers that look good on paper but do not correlate with profit—in favor of KPIs that reflect the health of the sales funnel.
Core KPIs for Revenue and Direct Conversions
For most commercial enterprises, the primary objective of CRO is the optimization of direct revenue. There are four primary KPIs used to measure this outcome:
-
Conversion Rate (CR): This remains the industry standard for measuring efficiency. It is calculated by dividing the number of successful conversions by the total number of visitors, multiplied by 100. While a high conversion rate is generally positive, analysts warn that it must be viewed in context; a high CR on low-priced items may yield less profit than a lower CR on high-ticket items.
-
Revenue Per Visitor (RPV): Often considered more valuable than the conversion rate alone, RPV measures the average amount of money generated by every person who lands on the site. It is calculated by dividing total revenue by total visitors. RPV is a holistic metric because it accounts for both the frequency of purchases and the value of those purchases.
-
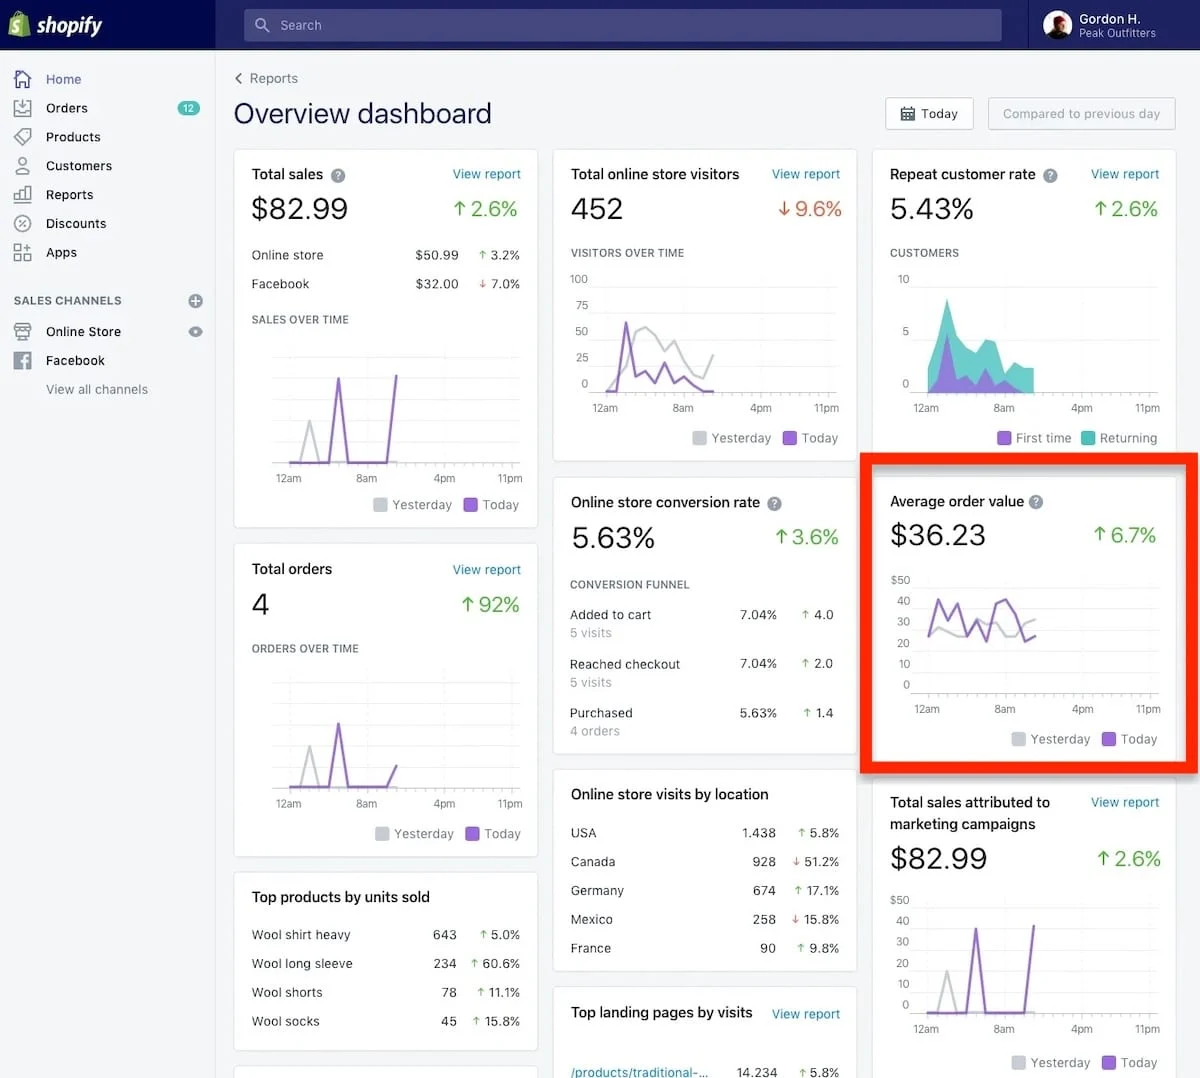
Average Order Value (AOV): This KPI tracks the average dollar amount spent each time a customer places an order. It is a critical metric for businesses testing upsells, cross-sells, or free-shipping thresholds. If a website redesign increases the conversion rate but causes AOV to plummet, the overall business impact may be negative.
-
Lead and Trial Signup Rates: For B2B and SaaS organizations, the "conversion" is rarely a direct purchase. Instead, the website serves to move the visitor to the next stage of the sales cycle, such as booking a demo or starting a free trial. These rates are essential for measuring the effectiveness of top-of-funnel landing pages.
Analyzing the Funnel: Micro-Conversions and Drop-off Points
A low overall conversion rate is a symptom, not a diagnosis. To find the cure, CRO specialists look at funnel-specific KPIs to identify where users are abandoning the process.
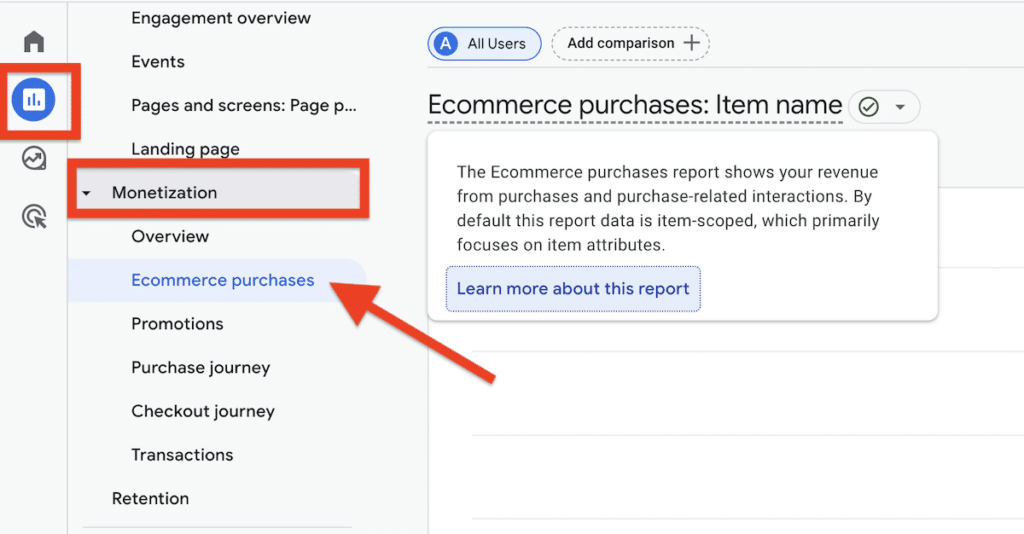
The Add-to-Cart Rate serves as a primary indicator of product page effectiveness. If visitors are reaching a product page but not adding items to their cart, the issue likely lies in product descriptions, pricing, or social proof. Moving further down the funnel, the Cart-to-Checkout Rate measures the transition from intent to action. High abandonment at this stage often signals "sticker shock" from unexpected shipping costs or taxes.
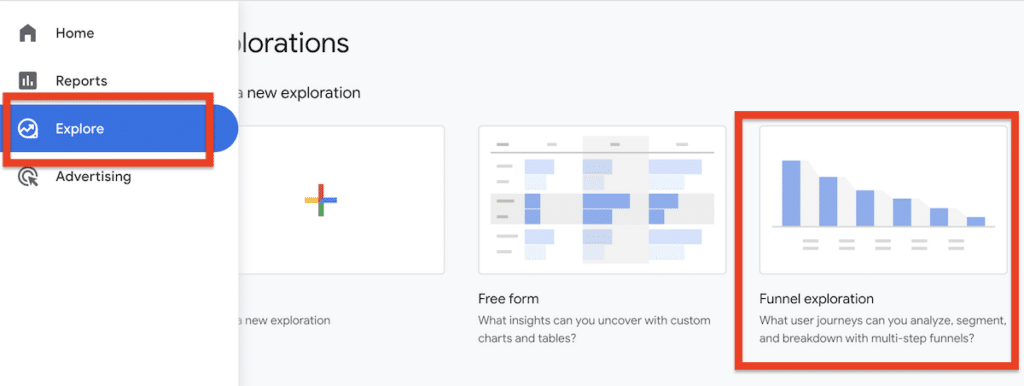
The Checkout Completion Rate is perhaps the most scrutinized metric in e-commerce. It measures the percentage of users who finish a purchase after starting the checkout process. Friction at this stage—such as forced account creation, overly long forms, or limited payment options—can be identified and corrected by monitoring this KPI. Similarly, for lead-generation sites, the Form Completion Rate (submissions divided by starts) reveals whether a form is too intrusive or technically flawed for mobile users.
The Shift Toward Lead Quality in B2B Environments
In the B2B sector, volume is often a misleading metric. A landing page that generates 1,000 leads is a failure if none of those leads are qualified to buy. Industry data from 2024 and 2025 marketing reports suggest that nearly 40% of marketers now prioritize lead quality over lead quantity.
To measure lead quality, organizations must track the Qualified Lead Rate. This is the percentage of total leads that meet specific criteria regarding company size, budget, and authority. A test that reduces the total number of leads but doubles the number of qualified leads is considered a significant win in a B2B context.
Further down the sales pipeline, the Lead-to-Opportunity Rate and Lead-to-Customer Rate provide the ultimate verification of CRO success. Because these metrics depend on the sales team’s performance and the length of the sales cycle (which can span months), they are lagging indicators. However, they are essential for determining the long-term ROI of marketing campaigns.
The Strategic Framework: Primary, Diagnostic, and Guardrail KPIs
A common pitfall in CRO is the "multiple comparisons problem," where tracking too many metrics leads to confusion or "cherry-picking" successful-looking data. To avoid this, industry leaders like Microsoft and Google advocate for a structured hierarchy of KPIs for every experiment.
The Primary KPI is the single metric used to decide if a test is a "winner." It must be directly related to the change being made. For instance, if a team is testing a new checkout layout, the primary KPI should be the Checkout Completion Rate.
Diagnostic KPIs are secondary metrics that explain the "why" behind the primary result. If a product page redesign increases revenue, diagnostic KPIs like scroll depth or image gallery clicks can help analysts understand what specific behavior led to that increase.
Finally, Guardrail KPIs are used to ensure that a localized "win" does not cause a global "loss." A classic example of a guardrail metric is the Return Rate or Support Ticket Volume. If a new marketing headline increases signups but leads to a massive spike in customer churn because the product was misrepresented, the guardrail metric will flag the experiment as a failure despite the high conversion rate.
Industry Implications and Future Outlook
The integration of Artificial Intelligence (AI) into CRO tools is beginning to automate the tracking of these KPIs. Predictive analytics can now forecast RPV trends based on real-time user behavior. However, the fundamental principles of KPI selection remain a human-led strategic task.
Industry experts suggest that as privacy regulations like GDPR and CCPA make third-party tracking more difficult, "first-party" KPIs—those based on direct interactions on the company’s own website—will become the most reliable source of truth. The focus is shifting toward "zero-party data," where KPIs measure how effectively a site encourages users to voluntarily share their preferences.
From a management perspective, reporting these KPIs requires a tiered approach. Executives typically require high-level views of RPV and Customer Acquisition Cost (CAC), while product teams need granular data on funnel drop-offs. A successful CRO program bridges this gap by translating technical web metrics into the language of business growth.
In conclusion, CRO KPIs are more than just numbers on a dashboard; they are the navigational instruments for digital strategy. By distinguishing between simple metrics and strategic KPIs, and by implementing a rigorous framework of primary and guardrail measurements, businesses can ensure that every change to their digital presence is a measurable step toward increased profitability and improved customer experience. The future of the digital economy belongs to those who can not only collect data but interpret it through the lens of these critical performance indicators.







