In the high-stakes environment of digital optimization, the impulse to check experiment results early is nearly universal. For product managers, marketers, and data scientists, the question is always the same: is the new variation winning yet? However, this natural curiosity often clashes with the rigid requirements of classical statistics. Standard A/B testing models are designed with the assumption that data will only be analyzed once—after a predetermined sample size has been reached. When practitioners “peek” at results and stop a test the moment it reaches a threshold of significance, they inadvertently inflate the false-positive rate, leading to the implementation of changes that may actually provide no benefit or even harm the user experience.
To address this “peeking problem,” VWO, a leading experimentation platform, has refined its approach to sequential testing. By implementing a sophisticated variant of Group Sequential Testing (GST) that prioritizes both statistical validity and user readability, the platform aims to eliminate the friction between rigorous data science and the practical needs of business decision-making.
The Statistical Trap of Early Peeking
The fundamental issue with early peeking is rooted in the “multiple comparisons problem.” In a traditional fixed-horizon test, a significance level (alpha) of 5% means there is a 1-in-20 chance of claiming a winner when none exists. However, every time a researcher checks the data during the experiment, they are essentially giving the test another chance to produce a false positive.
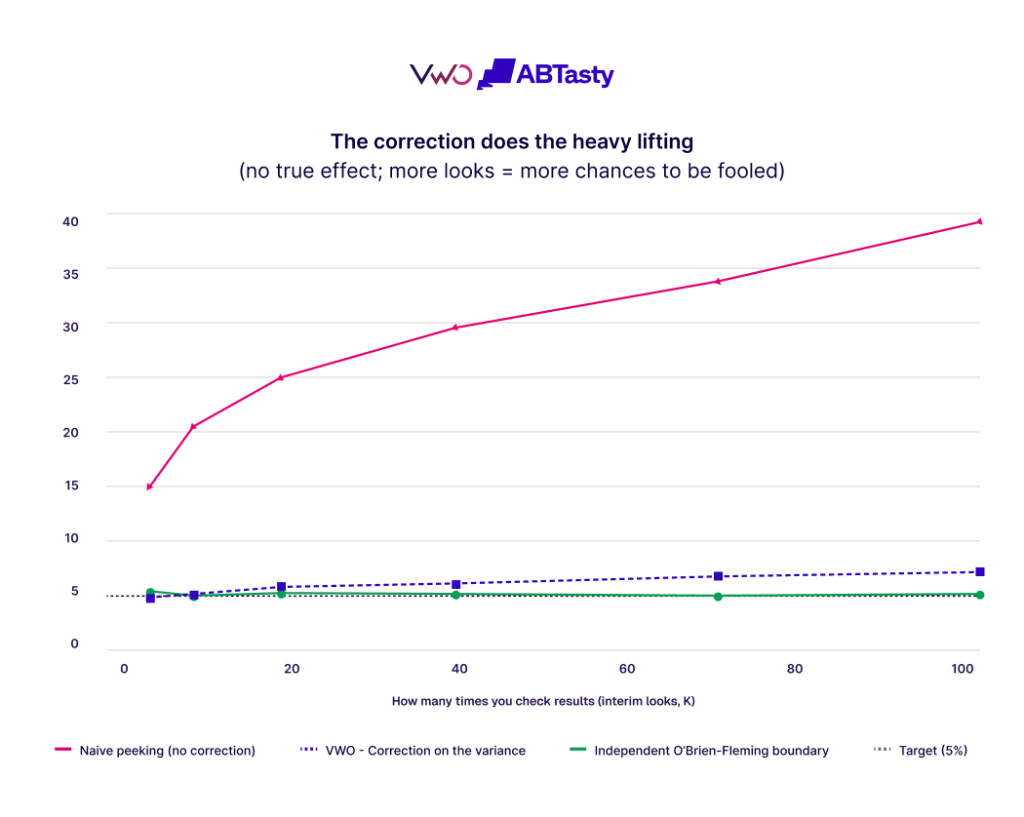
Engineering teams at major tech firms, such as Spotify, have extensively documented this phenomenon. Their research indicates that a test designed with a 5% false-positive rate can see that rate balloon to nearly 40% if the data is monitored continuously and the test is stopped at the first sign of significance. This degradation of statistical integrity creates a “chasing the ghost” effect, where teams celebrate wins that are merely artifacts of random noise.
The industry response to this challenge has been the development of sequential testing frameworks. These methodologies allow for multiple “looks” at the data by adjusting the statistical requirements for significance at each stage. While several frameworks exist, the challenge for SaaS platforms has been to implement these complex mathematical corrections without making the results unintelligible to non-statisticians.
Chronology of Experimentation Methodologies
The evolution of A/B testing has moved through several distinct phases:
- Fixed-Horizon Testing (Pre-2010s): Derived from agricultural and clinical trial methodologies, these tests required a fixed sample size and a single analysis at the end. While mathematically sound, they were too slow for the rapid pace of the software industry.
- Naive Sequential Monitoring (Early 2010s): As digital tools made real-time data available, users began stopping tests early based on “p-values” that were not corrected for multiple looks, leading to a crisis of reproducibility in conversion rate optimization.
- The Rise of Sequential Frameworks (Mid-2010s): Platforms began adopting O’Brien-Fleming boundaries and other Group Sequential Testing (GST) methods. These allowed for interim analyses but often required complex manual setups and “moving” goalposts that confused users.
- Integrated, Frictionless Rigor (The Current Era): Modern platforms like VWO are now moving toward “always-on” sequential testing that hides the mathematical complexity, providing a stable, readable metric that remains valid regardless of how often it is viewed.
The VWO Approach: Stationary Thresholds and Variance Correction
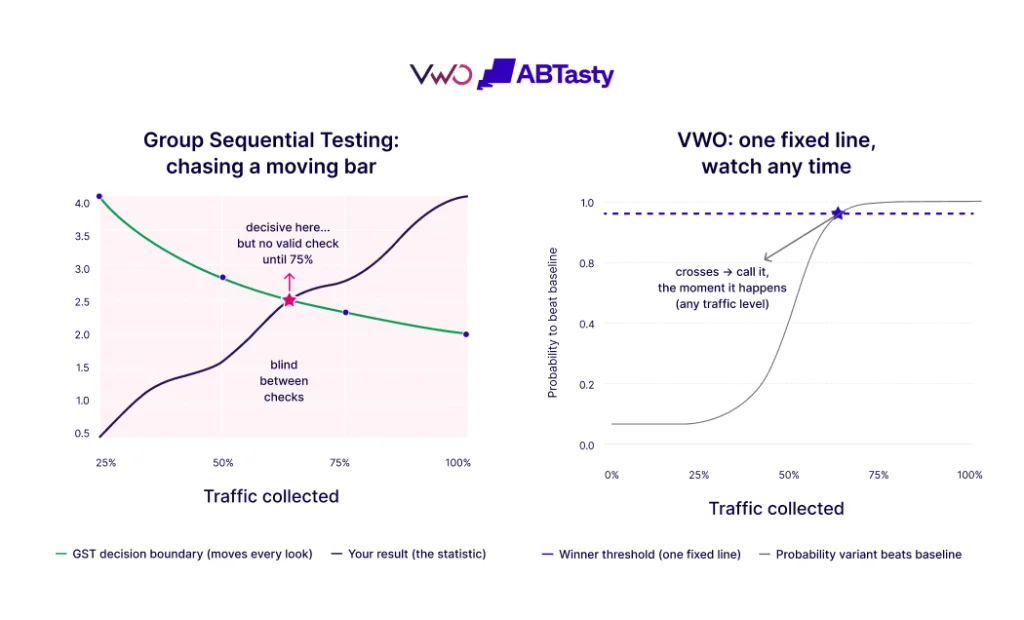
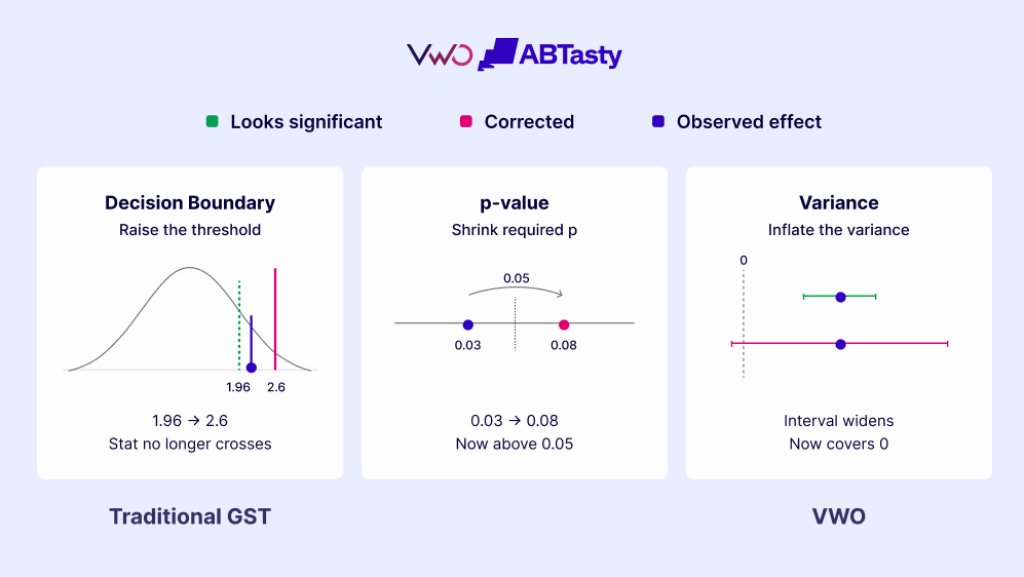
While most serious experimentation platforms utilize some form of GST, VWO has distinguished its methodology by how the correction is applied. Traditional GST typically employs a “moving decision boundary.” Under this model, the bar for significance starts very high when data is scarce and gradually lowers as more visitors enter the test. For a user, this means that a result that looked significant on Tuesday might not look significant on Wednesday, even if the conversion rate hasn’t changed, simply because the boundary moved.
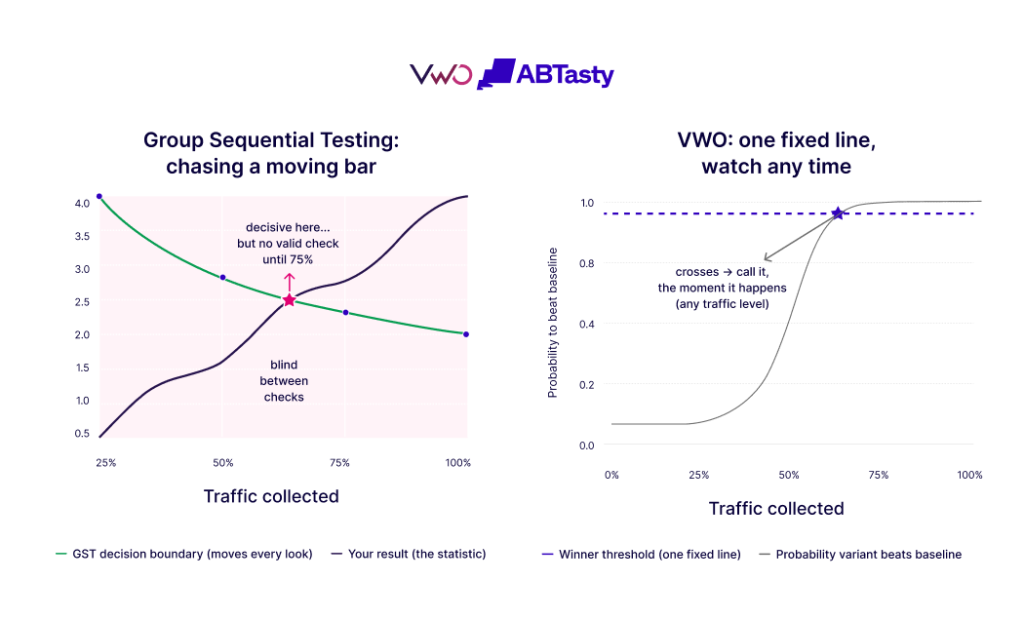
VWO’s engineering team identified that these moving boundaries create a “blind spot” between scheduled checkpoints. If a variation is causing a significant drop in revenue between two planned looks, a traditional GST model might not technically allow for a valid decision to stop the test until the next checkpoint is reached.
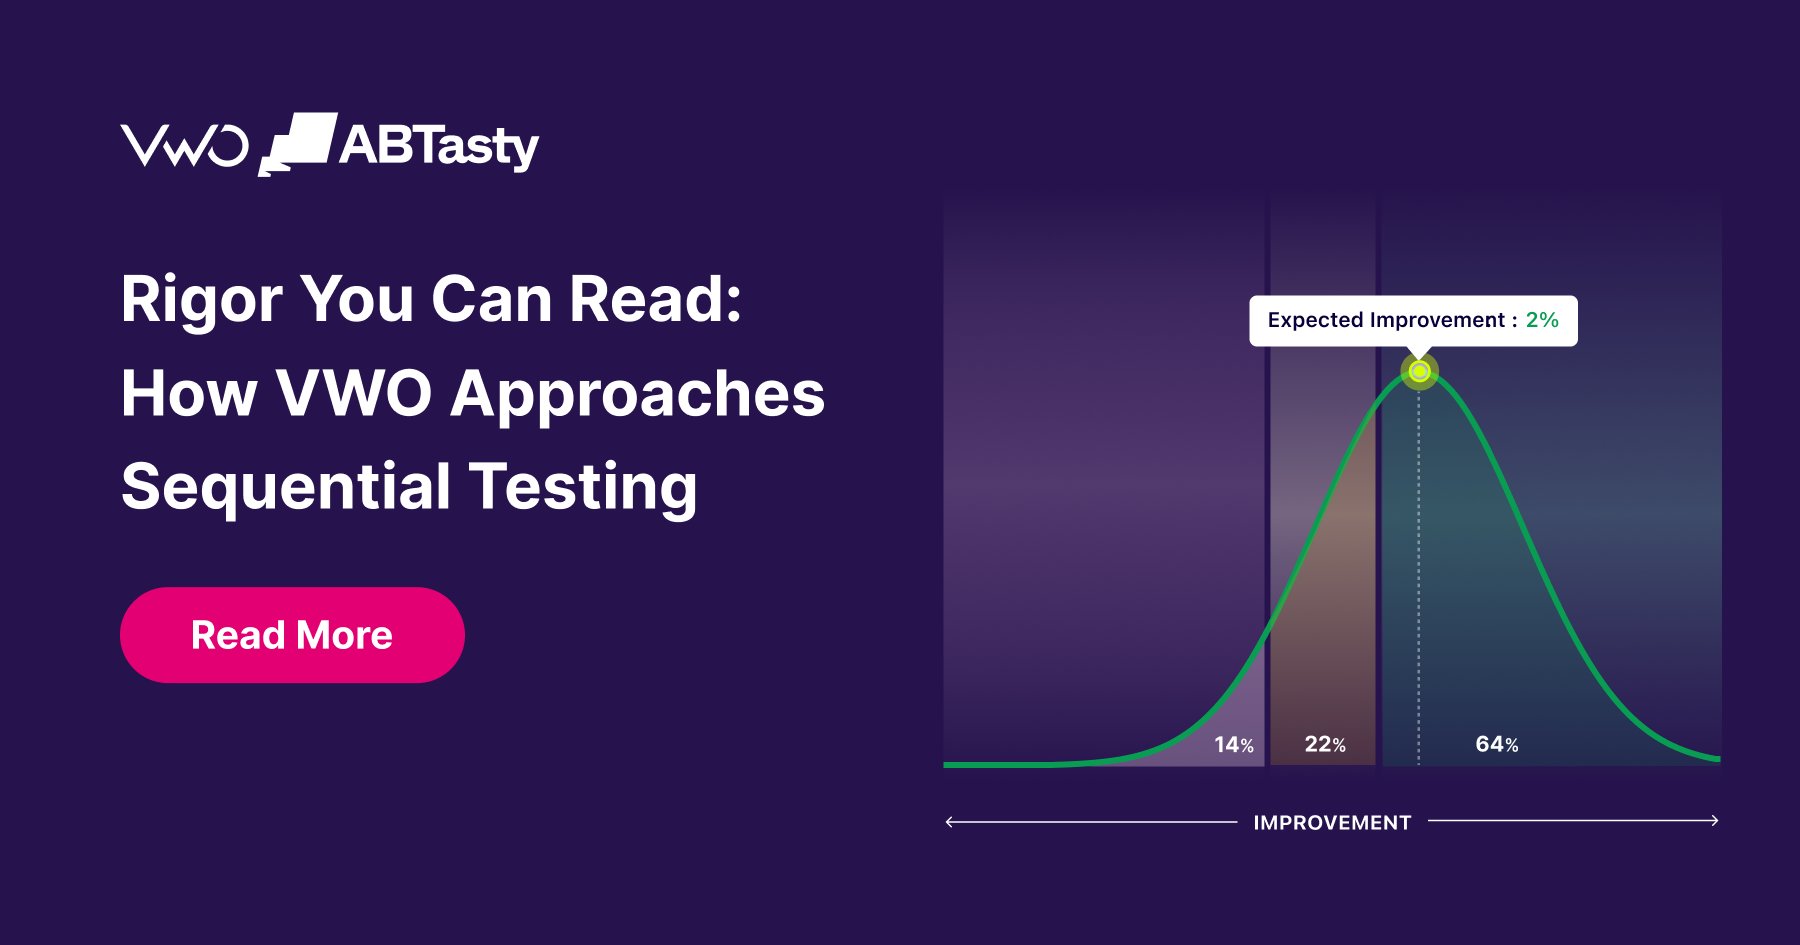
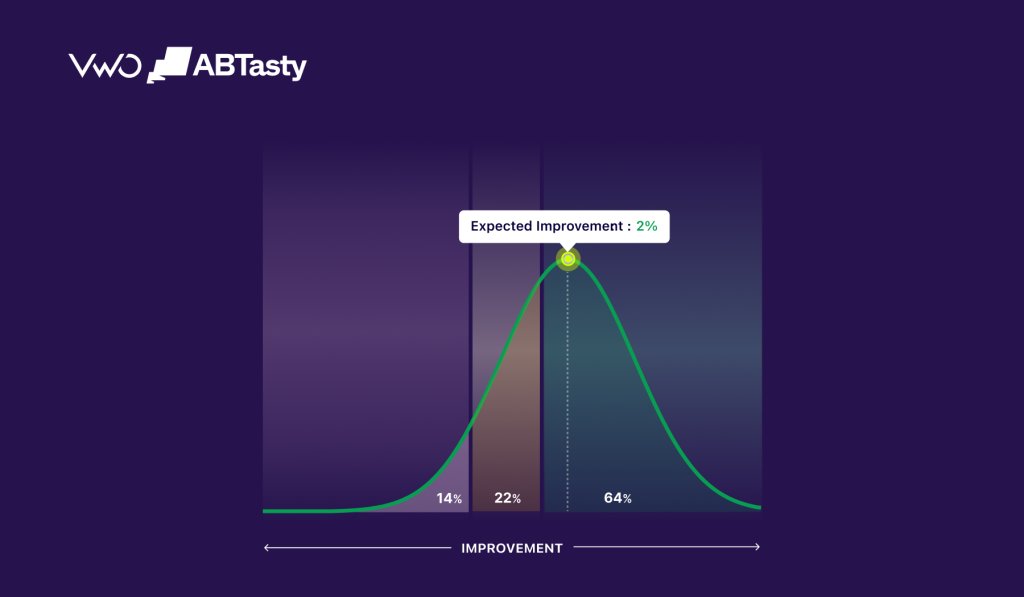
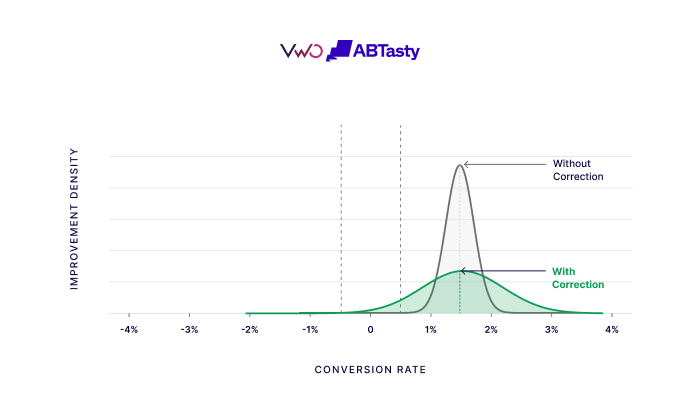
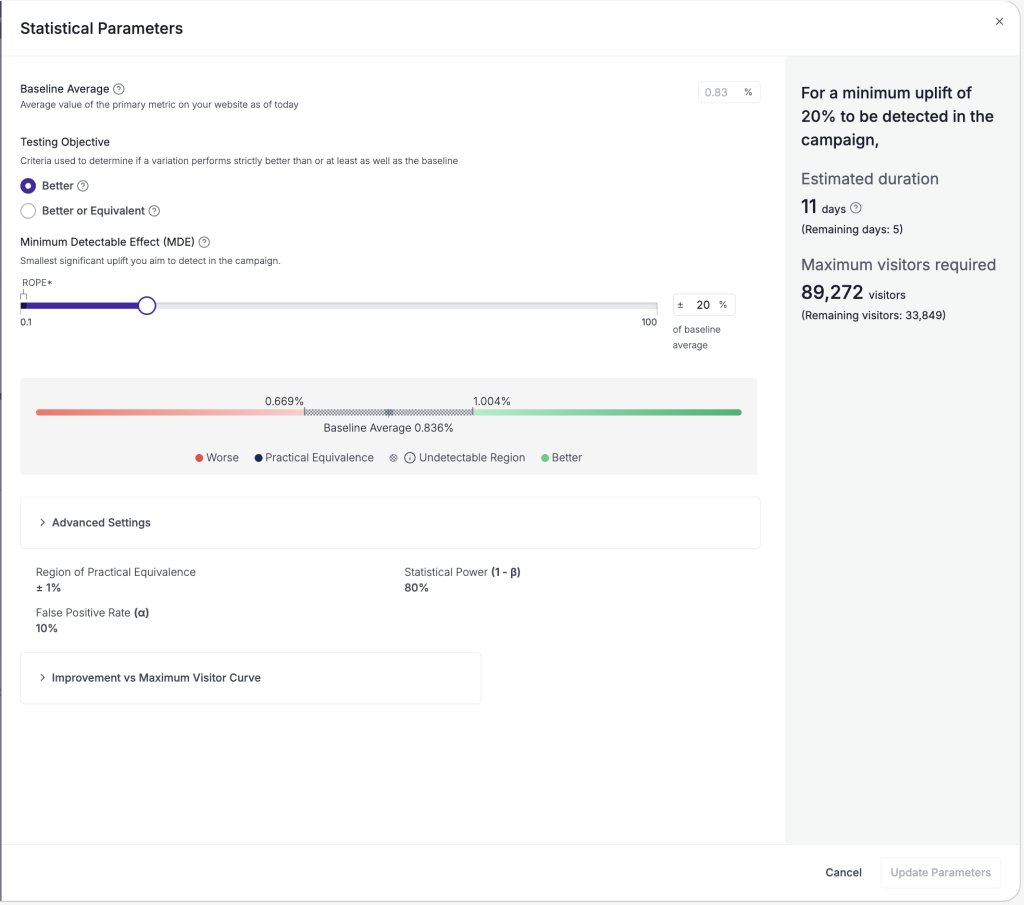
To solve this, VWO applies the statistical correction to the variance of the improvement distribution rather than the decision boundary itself. By widening the uncertainty band—the “margin of error”—by the exact amount required to compensate for peeking, VWO can keep the decision threshold stationary. This means the “Probability to be Better” metric remains a stable, reliable number. When the probability crosses the 95% line, it stays valid, allowing users to call a winner the moment it happens without waiting for a scheduled “check-in.”
Simulation Results: Proof of Error Control
A claim of statistical rigor requires empirical validation. VWO conducted head-to-head simulations comparing its variance-side correction against the textbook O’Brien-Fleming boundary design. The simulations involved thousands of synthetic experiments, testing scenarios ranging from occasional checks to “relentless peeking” (checking every few minutes).
The data revealed several key findings:
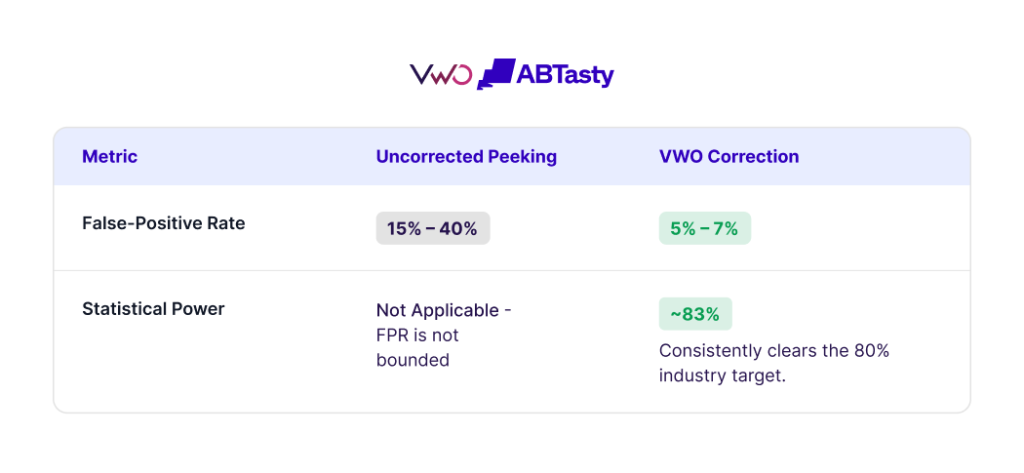
- Naive Testing: Without sequential correction, the false-positive rate climbed from the intended 5% to nearly 40% under continuous monitoring.
- VWO Correction: Under normal interim-look counts, VWO’s method held the false-positive rate precisely at 5%. Even under extreme, continuous peeking (100+ looks), the rate only drifted modestly to approximately 7%.
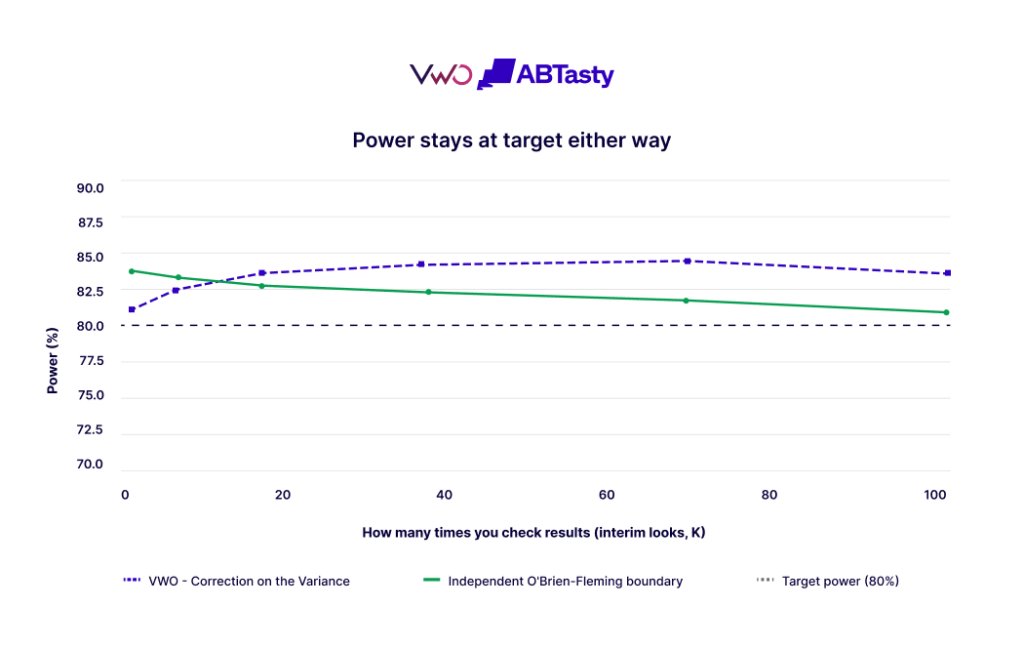
- Statistical Power: Both the traditional O’Brien-Fleming method and the VWO method maintained the industry-standard 80% power target, ensuring that the correction did not make it significantly harder to find real winners.
This 2% drift under extreme conditions is described by VWO as a deliberate trade-off. By accepting a negligible increase in the false-positive rate under unrealistic “relentless” peeking, the platform provides a much more interpretable and actionable interface for the vast majority of real-world use cases.
Democratizing Statistics: No Homework Required
One of the primary barriers to adopting rigorous experimentation is the technical overhead. Many frameworks require users to pre-commit to a specific number of looks or to manually set “alpha-spending” functions before the test begins. If these inputs are misconfigured, the results are compromised.
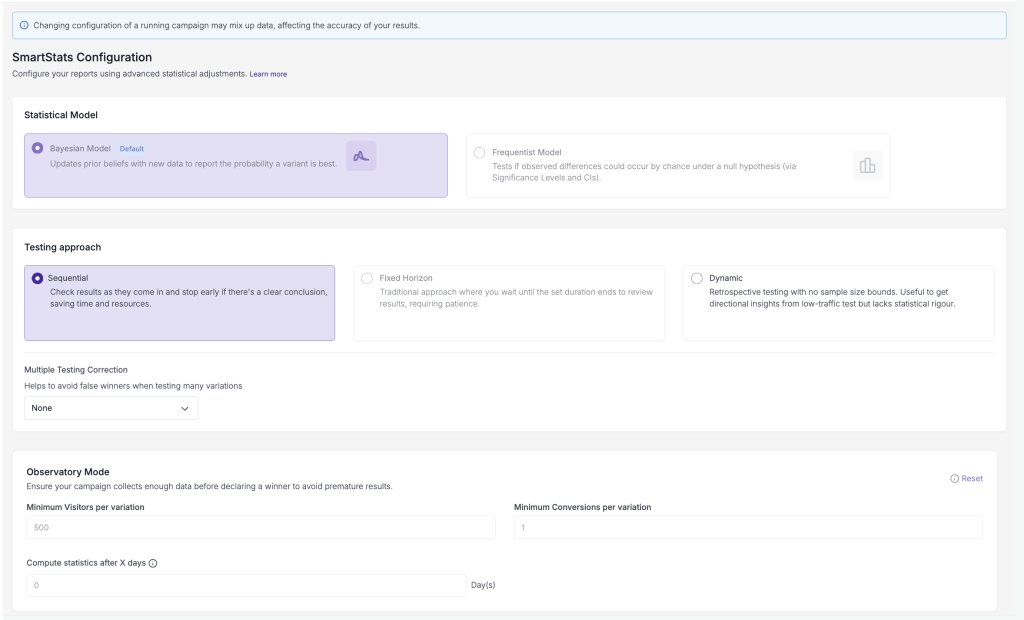
VWO has moved toward a “frictionless” model where these inputs are handled via sensible defaults based on a decade of real-world experimentation data. Furthermore, because the corrections are computed from the collected data rather than pre-committed during setup, users can adjust their reporting preferences—such as switching from a 95% confidence level to 99%—mid-test without invalidating the previous data.
This flexibility extends to the choice of statistical schools of thought. The industry remains divided between “Frequentists” (who favor p-values and confidence intervals) and “Bayesians” (who favor probabilities and credible intervals). VWO has integrated the same sequential correction into both reporting frameworks, allowing teams to use the language they are most comfortable with while maintaining the same underlying level of rigor.
Extending Rigor to SRM and Segmentation
The commitment to sequential validity is also applied to secondary integrity checks, such as Sample Ratio Mismatch (SRM) and automated segment discovery.
SRM occurs when the actual traffic split (e.g., 48/52) deviates significantly from the intended split (50/50), often indicating a technical bug or a bot-related bias. VWO monitors for SRM continuously using a chi-squared test. Interestingly, for SRM, VWO uses a moving boundary approach. Since SRM is a background safeguard that users don’t need to “read” as a progress bar, the moving boundary’s lack of readability is not a drawback, allowing for the most precise possible detection of integrity issues.
Additionally, VWO’s “Opportunities” feature uses the same sequential corrections when slicing data by segments (e.g., mobile users in Europe). Segment-level analysis is notoriously prone to false positives because the smaller sample sizes increase noise. By applying sequential correction to these sub-groups, VWO ensures that a “winning segment” is a statistically sound discovery rather than a random fluctuation.
Broader Implications for the Enterprise
The shift toward more robust, readable sequential testing represents a maturing of the experimentation industry. As companies move beyond simple button-color tests to complex product feature rollouts, the cost of a false positive increases. A bad feature implemented based on flawed data can result in millions of dollars in lost revenue and weeks of wasted engineering time to revert.
By absorbing the mathematical complexity of sequential testing into the platform’s core architecture, VWO is attempting to lower the barrier to “high-integrity” experimentation. The goal is to create an environment where the natural human desire to monitor progress does not compromise the scientific foundation of the test. As organizations continue to strive for data-driven cultures, the ability to “peek freely” while maintaining statistical validity is likely to become a standard requirement for any enterprise-grade experimentation program.