
 Ammar Sabilarrohman
The dynamic landscape of social media has once again shifted, with X, formerly known as Twitter, implementing significant changes to its native analytics offerings. This evolution, marked by the introduction of a Premium paywall for comprehensive data access, has prompted marketers, businesses, and content creators to re-evaluate their strategies for understanding content performance and audience engagement. While a basic, post-level view remains freely available on mobile, the full suite of insights—critical for nuanced strategic planning—is now largely reserved for paid subscribers or accessible via sophisticated third-party tools. This report delves into the current state of X analytics, dissecting the metrics that matter, outlining methods of data acquisition, and providing actionable insights for optimizing digital strategies in 2026 and beyond.

The Evolution of X: From Free Insights to Premium Access
The transformation of Twitter into X under Elon Musk’s ownership in July 2023 marked a pivotal moment for the platform, signaling a broader ambition to evolve into an "everything app." This rebranding brought with it a series of operational and feature adjustments, most notably a push towards monetization through the X Premium subscription service. Historically, Twitter offered a robust and free analytics dashboard to all users, providing invaluable insights into impressions, engagement rates, profile visits, and follower growth. This open access fostered a data-driven approach among its user base, allowing individuals and organizations alike to fine-tune their content strategies without additional cost.
However, the landscape began to change "until recently," as noted in early 2026 when X transitioned its complete analytics dashboard behind the Premium paywall. This strategic move, impacting roughly 4.4 million paid subscribers at the time, aligns with a broader industry trend where social media platforms increasingly seek to monetize advanced features and data access. For non-Premium users, access to performance data has been curtailed, limiting them primarily to individual post-level analytics available through the X mobile application. This shift necessitates a re-evaluation of how businesses and creators approach data collection and analysis on the platform.
Navigating Data Access: Free vs. Premium Options
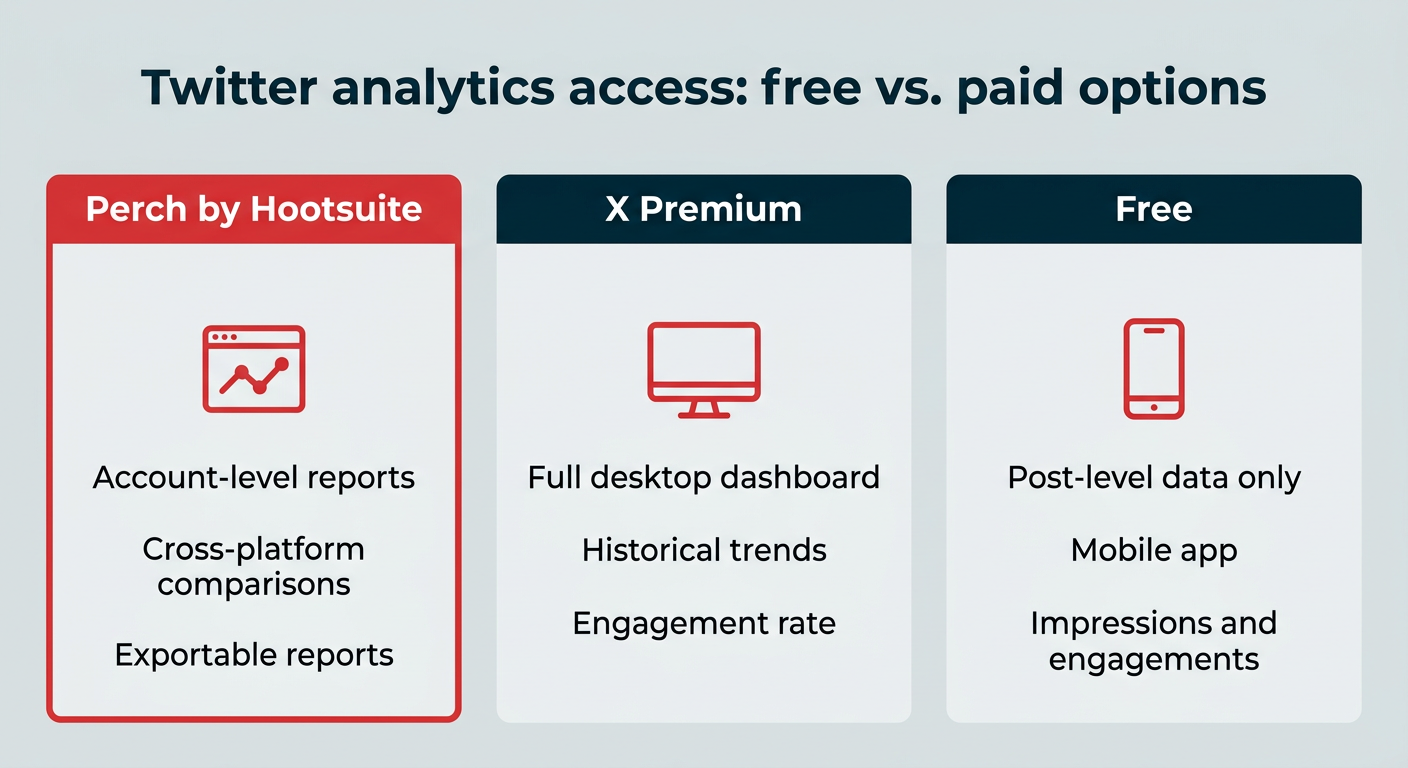
Understanding content performance on X is non-negotiable for effective social media strategy. However, the methods for accessing this data have become segmented. Users now face a choice between limited free options, a paid Premium subscription, or investing in third-party analytics platforms.
1. X Premium (Desktop Access for Full Dashboard):
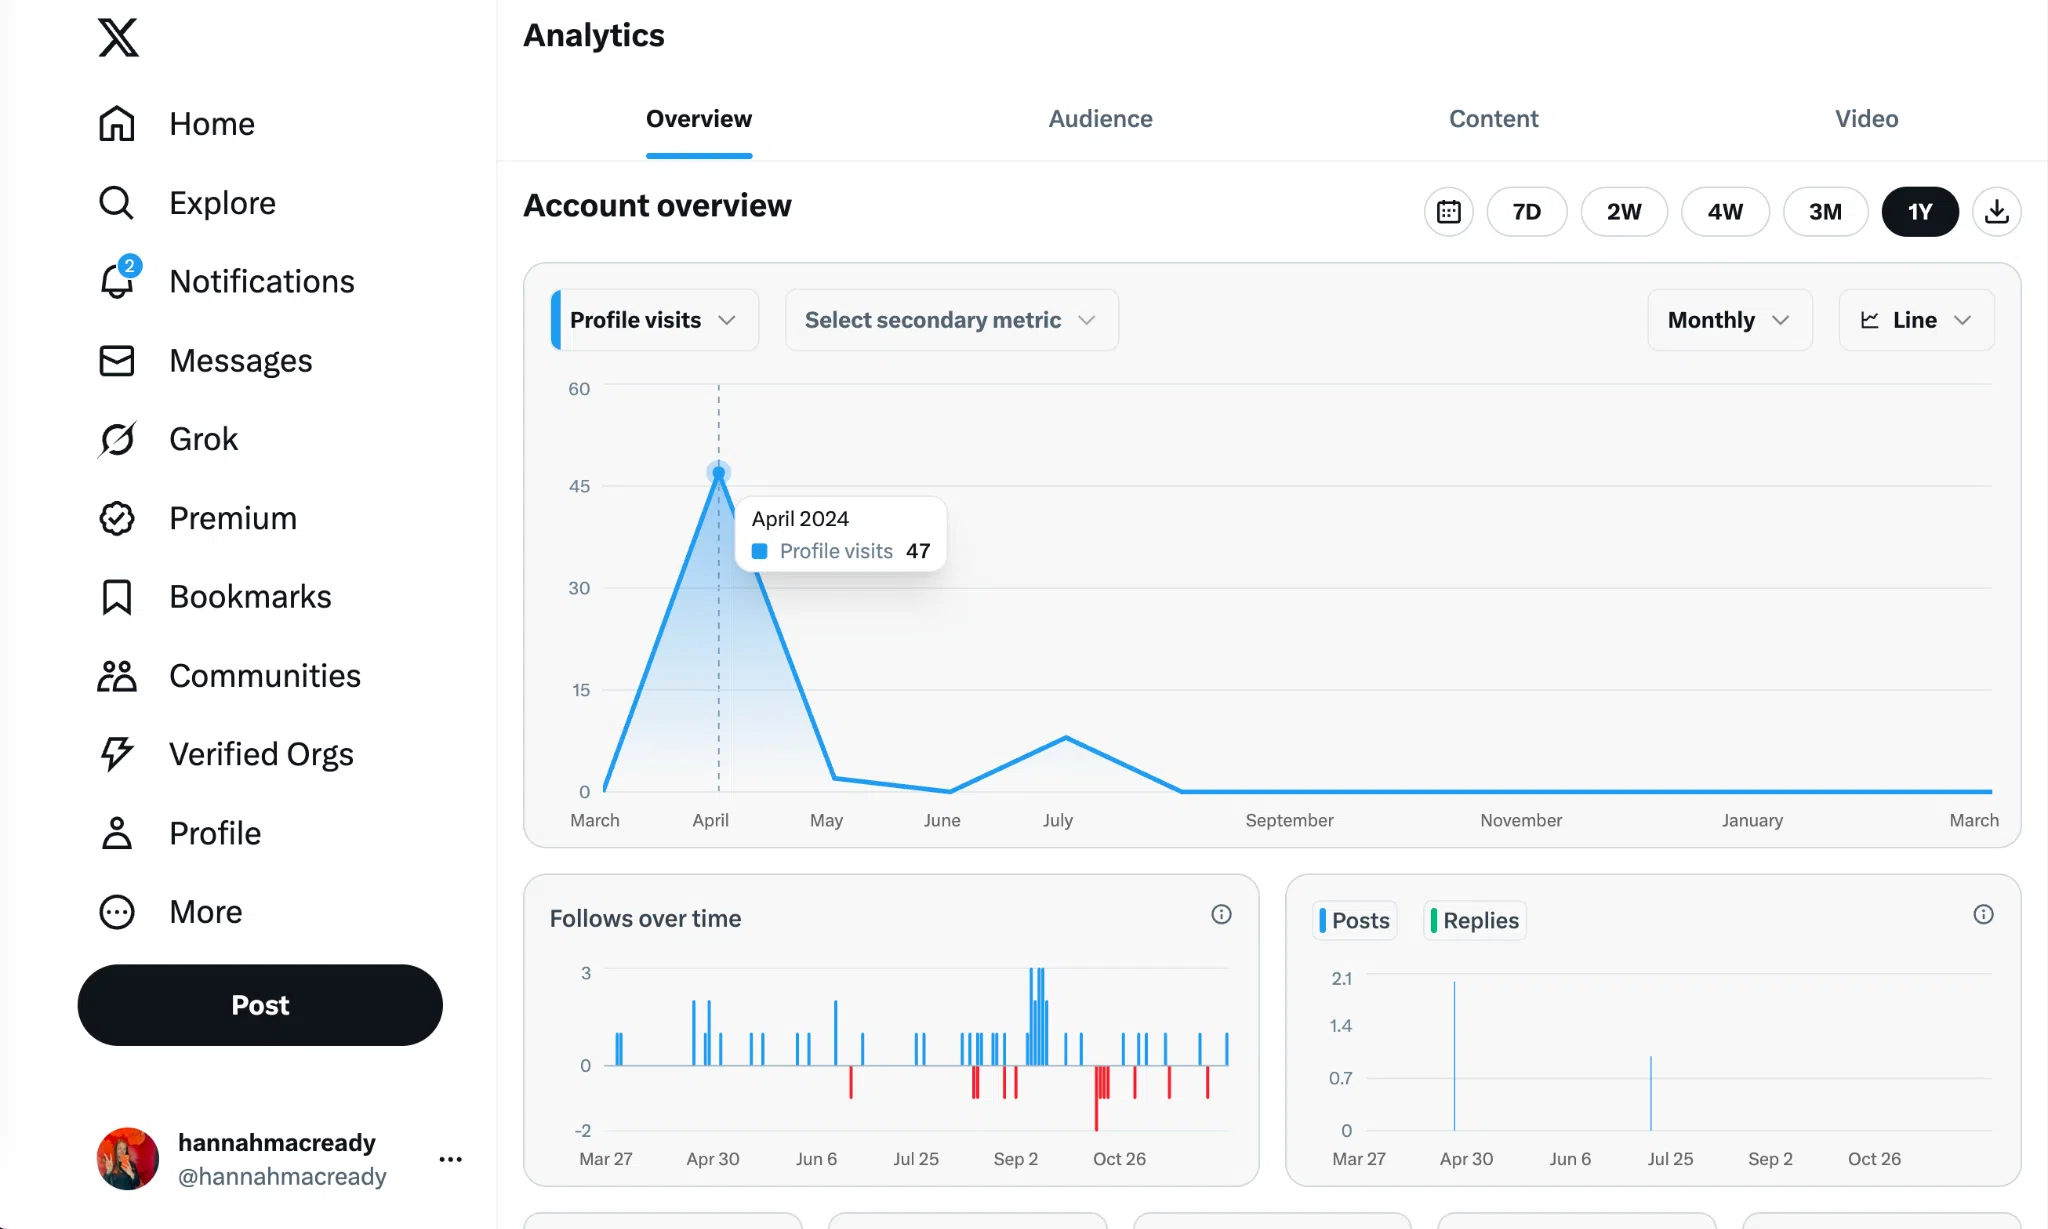
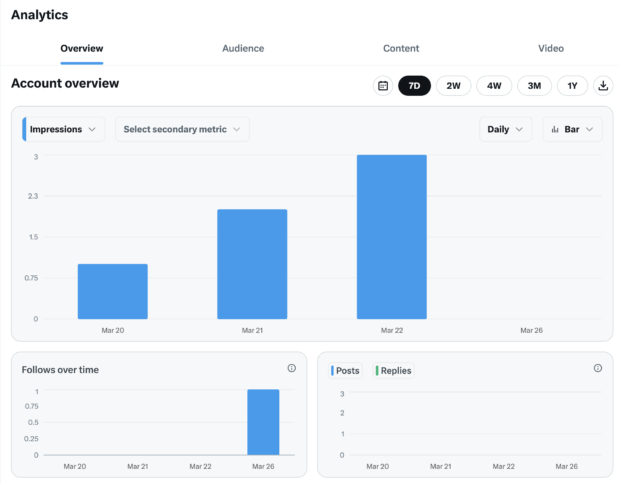
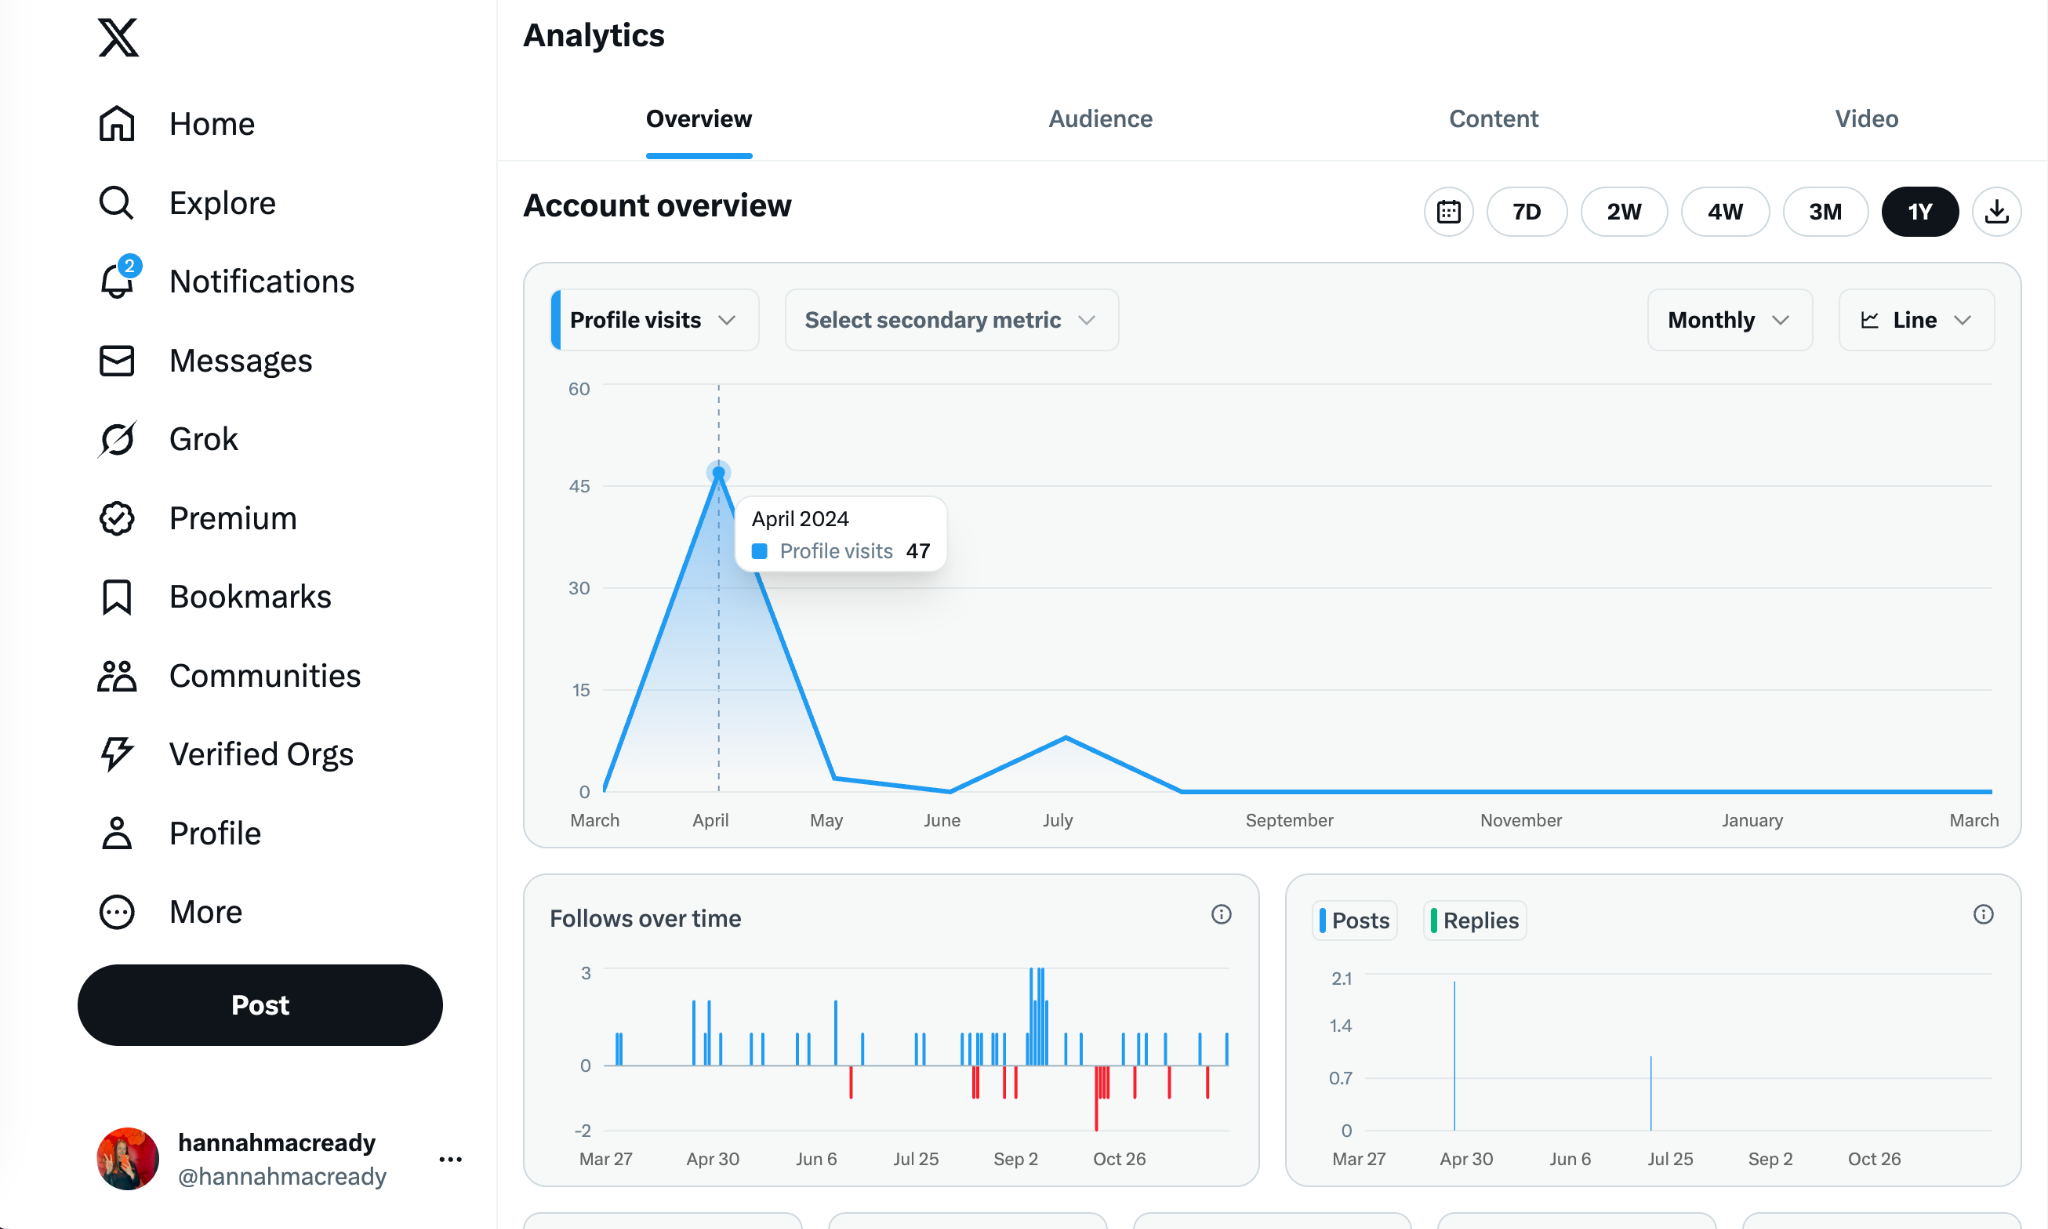
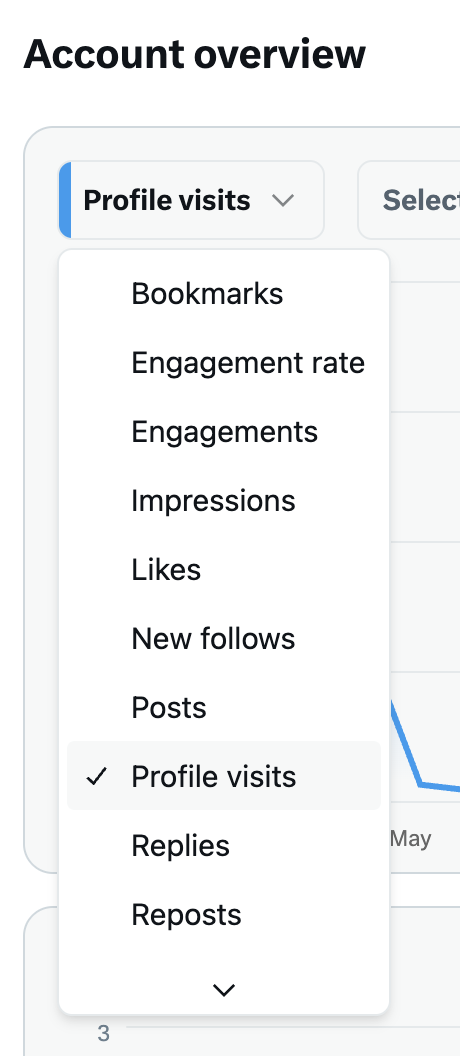
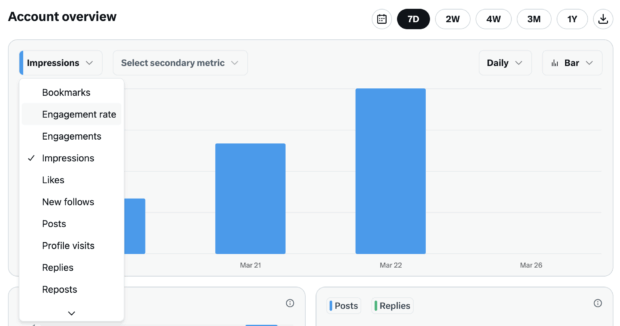
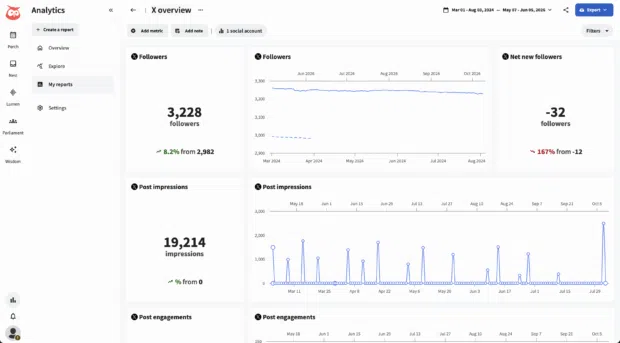
For those subscribed to X Premium (or X verified accounts), the full analytics dashboard remains accessible via desktop. This comprehensive portal, found at x.com/i/account_analytics or through the "Creator Studio > Analytics" menu, provides an overview of account performance, including daily, weekly, monthly, or custom period data for impressions, engagement rate, profile visits, and new followers. Users can toggle between various metrics such as replies, reposts, likes, and bookmarks, visualizing trends through line or bar graphs. A dedicated "Content" tab further allows for the analysis of individual post performance within this premium interface. This level of detail is crucial for in-depth strategic reviews and identifying long-term trends.
2. X Mobile App (Free, Post-Level Data Only):
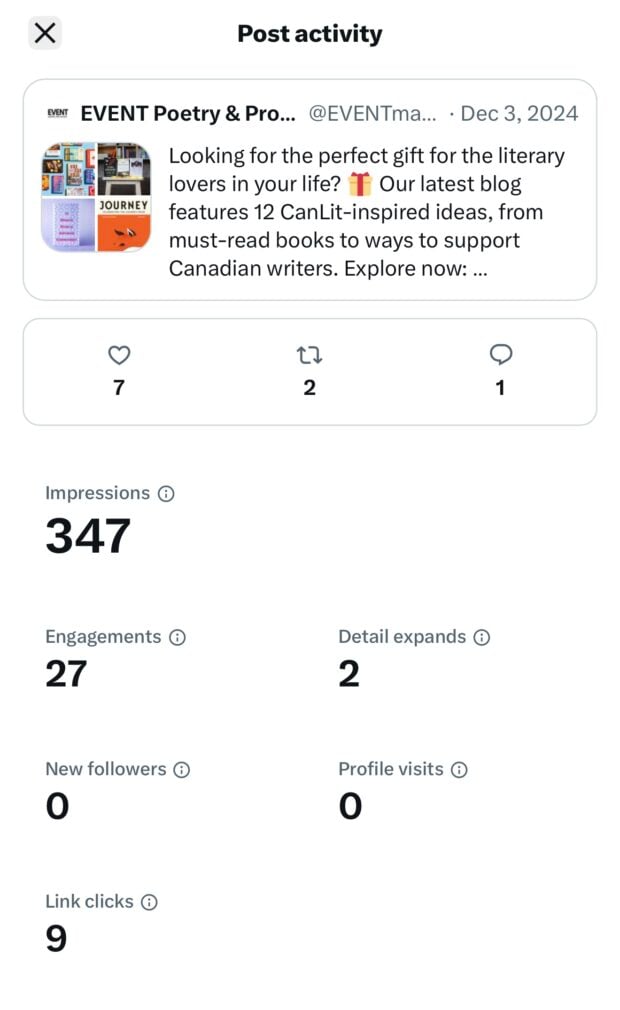
Even without an X Premium subscription, users can still access basic analytics for individual posts directly from the mobile app. This "hack" involves tapping on any of your published Tweets, then selecting the three dots in the top right corner, and choosing "View analytics." This provides a quick breakdown of impressions, engagement, and interactions for that specific post. While useful for immediate feedback on individual content pieces, it lacks the aggregated account-level reporting, historical data, and comparative insights essential for a holistic strategy. It serves as a rudimentary tool for quick performance checks rather than comprehensive analysis.

3. Third-Party Analytics Tools (Enhanced Capabilities and Cross-Platform Integration):
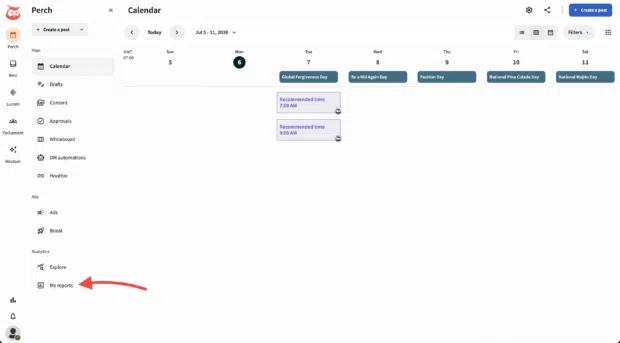
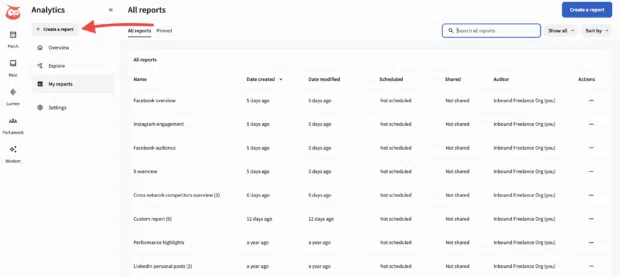
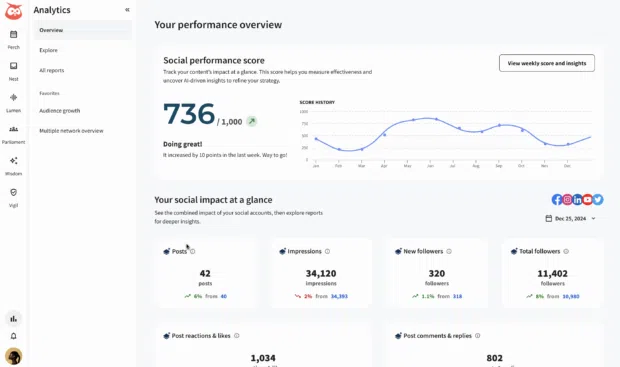
For marketers managing multiple social media channels or requiring more customizable reporting and deeper insights beyond X’s native offerings, third-party tools have become indispensable. Platforms like Perch by Hootsuite offer account-level reporting without requiring an X Premium subscription, alongside capabilities for competitor tracking, social listening, and cross-platform performance comparisons. These tools often integrate X analytics with data from other networks, providing a unified dashboard for a holistic view of social media presence. This approach is particularly beneficial for enterprise brands and agencies seeking robust, flexible, and export-ready reports.

Dissecting Performance: Essential X Metrics for Strategic Insight
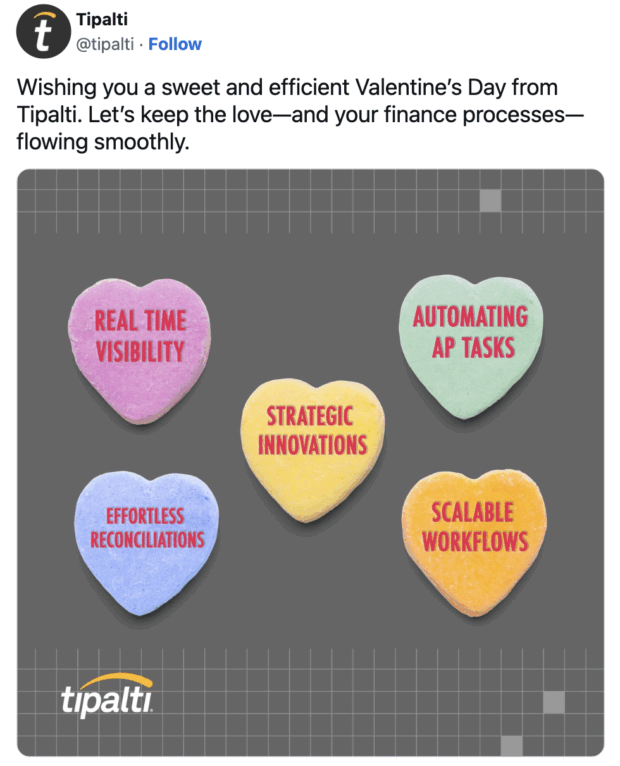
Effective utilization of X analytics hinges on understanding which metrics align with specific marketing objectives. Drowning in data without a clear purpose can be counterproductive. Industry experts, like Nick Martin, Social Media Marketing Manager at Tipalti, emphasize the importance of tracking metrics that directly map to core goals such as awareness, engagement, traffic, or audience growth.
Here are the key metrics to track, along with their significance and actionable interpretations:
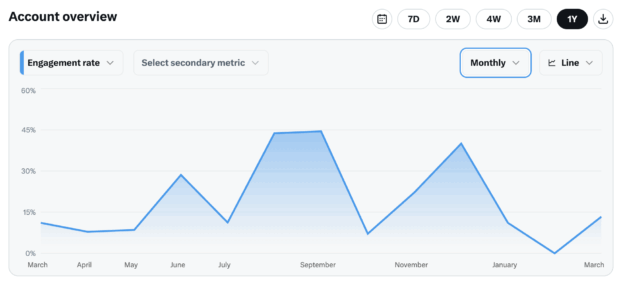
1. Engagement Rate:
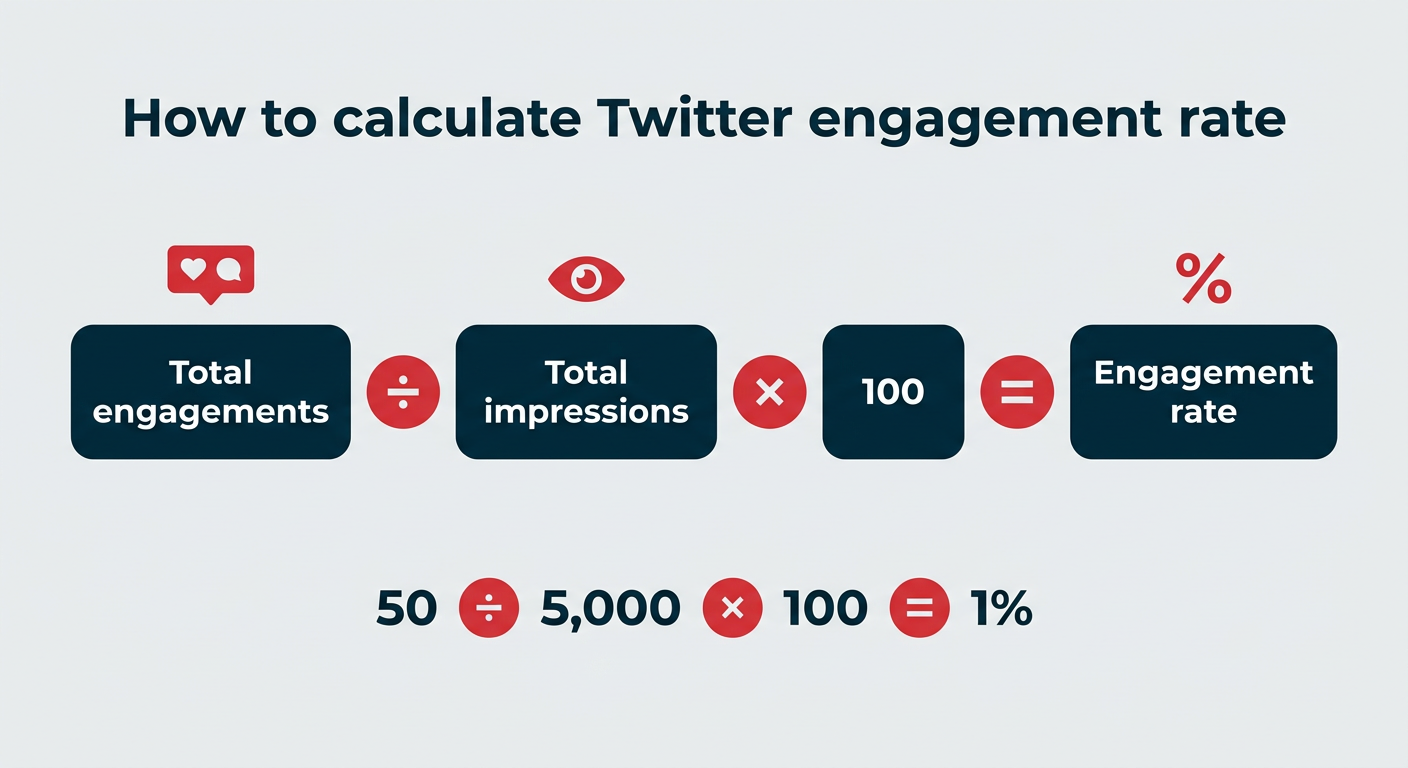
- Definition: The percentage of people who interacted with your content (clicks, likes, replies, reposts, etc.) after seeing it. Calculated as (Total Engagements / Total Impressions) x 100.
- Why it Matters: A quick barometer for content resonance. High engagement signals audience interest and can positively influence the algorithm’s distribution of your content.
- If Engagement is Low: Re-evaluate your content hook, topic relevance, or format. Experiment with videos, multi-image posts, polls, or stronger calls to action to provoke interaction.
- Where to Find It: X Premium dashboard (Account Overview dropdown), or comprehensively in third-party tools like Perch, which allows sorting posts by engagement rate and cross-platform comparison.
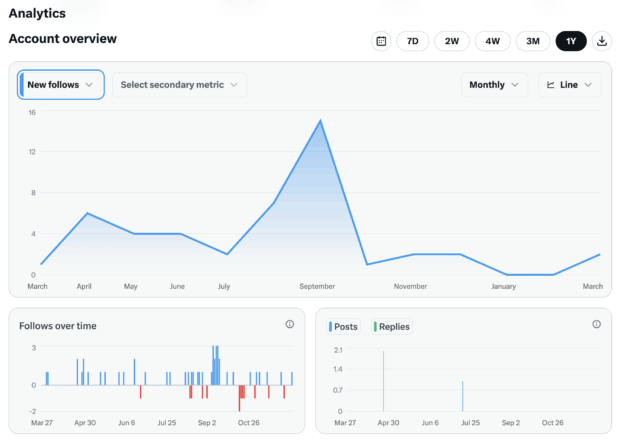
2. Follower Growth:
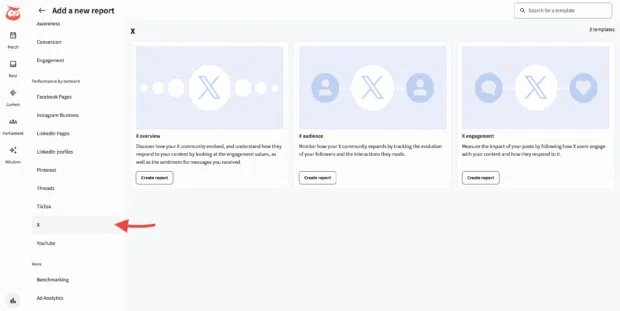
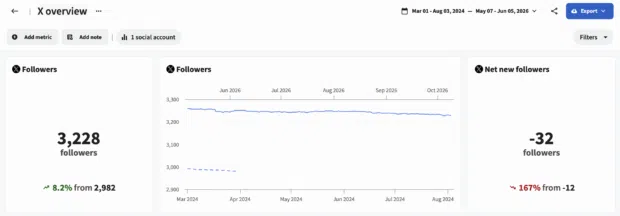
- Definition: The net change in your audience size over a specific period, reflecting new followers minus unfollows.
- Why it Matters: Indicates the effectiveness of your content in attracting and retaining an audience. Significant spikes or dips offer immediate feedback on content strategy.
- If Follower Growth is Low: Content might be engaging in the moment but not compelling enough for a long-term follow. Consider tone shifts, topic adjustments, or inconsistent posting. Analyze recent content for patterns that might deter new follows.
- Where to Find It: X Premium dashboard (New Follows, Follows over time), or integrated with post data in tools like Perch for contextual analysis.
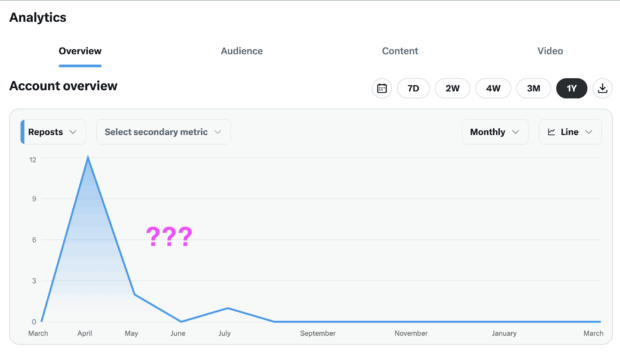
3. Reposts (formerly Retweets):
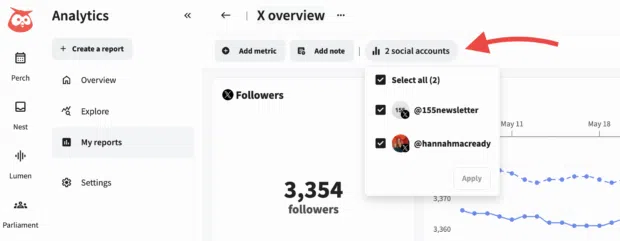
- Definition: The number of times your post has been shared by others with their own audience, either directly or with a quote.
- Why it Matters: A strong indicator of content value and virality potential. Reposts extend your content’s reach into new networks, amplifying visibility and brand awareness.
- If Reposts are Low: Content may lack a compelling shareable element. Focus on sparking opinion, solving problems, evoking emotion, or delivering genuinely insightful/humorous content. Trending topics or clear calls to action can encourage sharing.
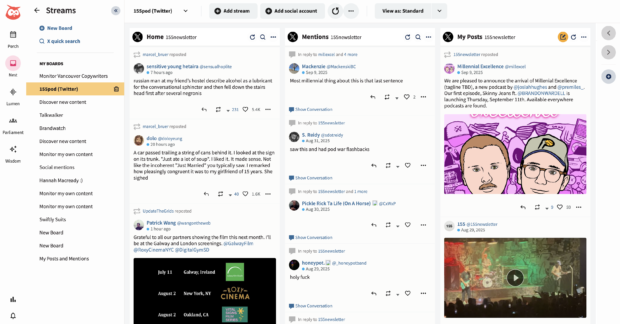
- Where to Find It: X Premium dashboard (Account Overview dropdown for total count), or in Hootsuite Streams for real-time tracking, responder identification, and engagement opportunities.
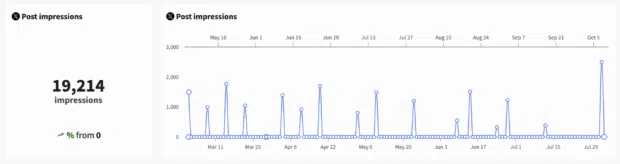
4. Impressions:
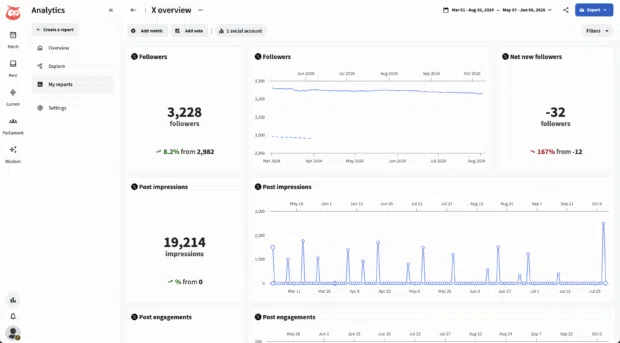
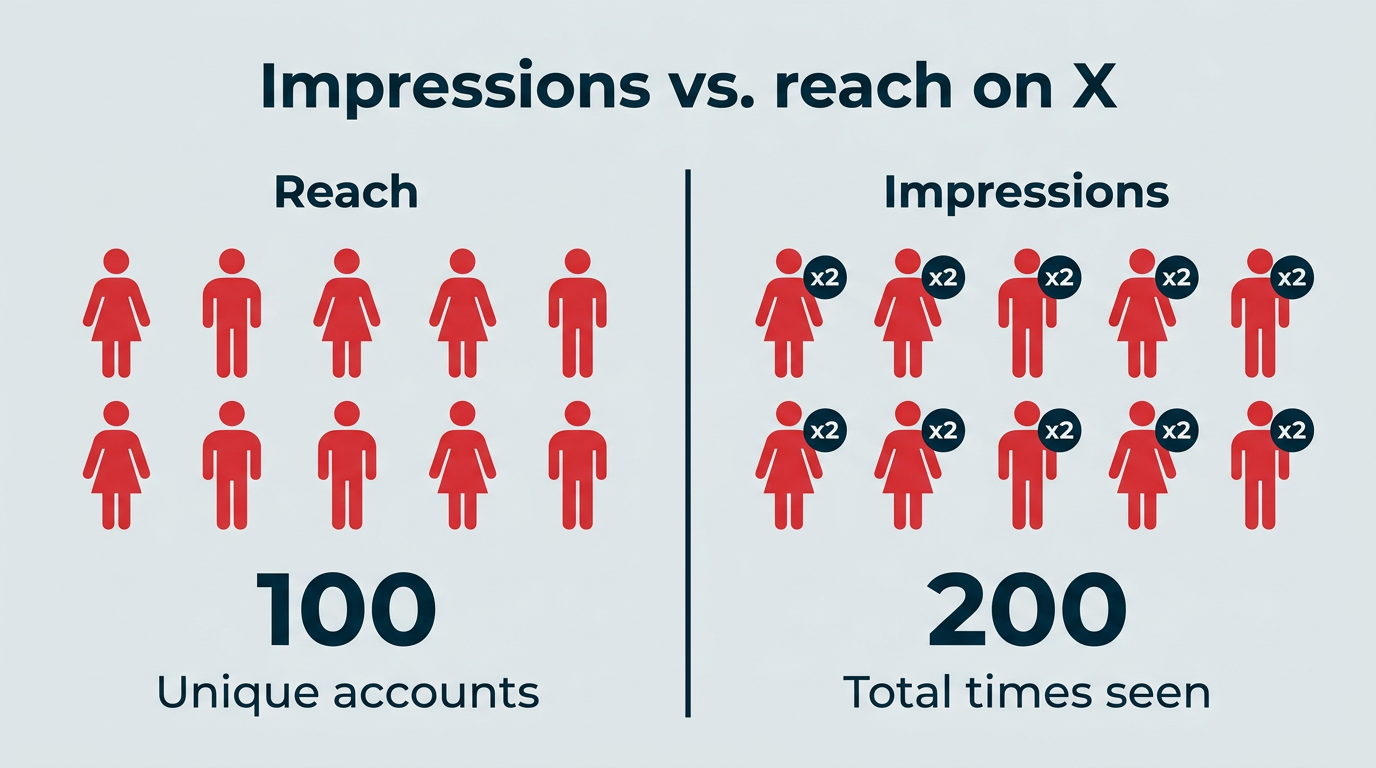
- Definition: The total number of times your content was displayed in users’ feeds. One user can generate multiple impressions.
- Why it Matters: A fundamental measure of content visibility and distribution. Tracking impressions over time, especially in light of the 5% year-over-year fall in average impressions observed in 2025, helps gauge content reach and algorithmic favorability.
- If Impressions are Low: Your content might not be breaking out of your existing follower base. Experiment with trending hashtags, participation in popular conversations, or formats (like video) that often receive greater algorithmic push.
- Where to Find It: X Premium dashboard (daily, weekly, monthly, yearly, or "pay period" views), or aggregated across platforms in Perch for big-picture trend analysis.
5. Reach:
- Definition: The number of unique accounts that saw your post.
- Why it Matters: Crucial for awareness goals, as it quantifies the actual size of your unique audience. It differentiates between repeatedly showing content to the same users (impressions) and expanding your audience. X’s native dashboard prioritizes impressions, making third-party tools valuable for this metric.
- If Reach is Low: Your content is likely not breaking through to new audiences. Strategize for reposts, engagement from influential accounts, and active participation in broader X conversations.
- Where to Find It: Primarily through third-party analytics tools like Perch, as X’s native dashboard does not readily surface unique organic reach.
6. Link Clicks:
- Definition: The number of times users clicked on a link within your post, leading them off-platform (e.g., to a website, blog, or product page).
- Why it Matters: A direct measure of user interest in exploring your offerings further. Essential for goals related to website traffic, lead generation, and conversions. It indicates the effectiveness of your calls to action and content’s ability to drive off-platform action.
- If Link Clicks are Low: Your post may lack sufficient curiosity or urgency. Strengthen your CTA, test different hooks, optimize link previews, add compelling visuals, and consider posting during peak engagement times.
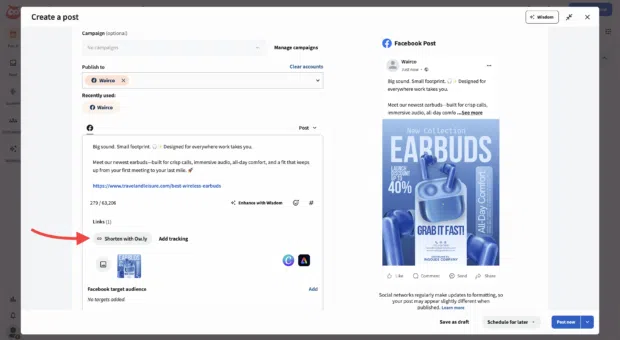
- Where to Find It: Individual post analytics on the X mobile app. More comprehensively tracked in third-party tools like Perch, especially when utilizing URL shorteners like Ow.ly for detailed tracking into Google Analytics.
7. Likes:
- Definition: The number of times users tapped the heart icon on your post.
- Why it Matters: A low-effort form of engagement, indicating passive approval or agreement. While not as strong as replies or clicks, it helps identify popular content themes and test new ideas. The average X post earned about 33 likes in 2025, providing a general benchmark.
- If Likes are Low (relative to other engagement): While a high-like count can feel good, assess if it translates to deeper engagement (replies, clicks, profile visits). A post with fewer likes but more meaningful interactions might be more valuable.
- Where to Find It: X Premium dashboard (Account Overview dropdown), or alongside other key metrics in Perch for contextual analysis.
8. Replies:
- Definition: The number of direct responses to your post or replies made while quoting it.
- Why it Matters: Central to conversation and community building. Replies signify deeper engagement and open opportunities for direct interaction, fostering stronger connections with your audience.
- If Replies are Low: Content might not be prompting conversation. Try asking open-ended questions, inviting opinions (e.g., Domino’s playful "pineapple on pizza" debate), sharing moderate "hot takes," and responding quickly to existing comments.
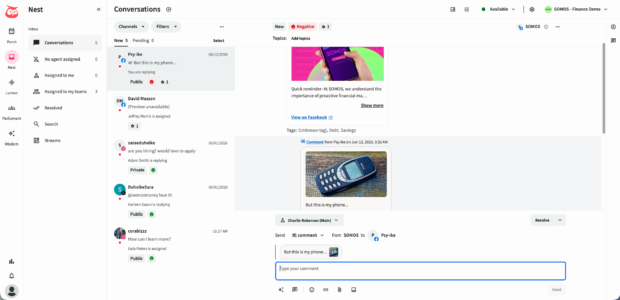
- Where to Find It: X Premium dashboard, or in Nest by Hootsuite for real-time monitoring and rapid response to keep conversations flowing.
9. Mentions:
- Definition: How often your @handle is tagged in posts, replies, or organic conversations across X.
- Why it Matters: Indicates brand visibility, word-of-mouth spread, and direct audience interaction. More mentions often correlate with increased reach and brand buzz.
- If Mentions are Low: Increase interactive content. Actively engage in trending conversations (as exemplified by McDonald’s witty replies), run user-generated content (UGC) campaigns that encourage tagging, and consistently reply to existing mentions to foster a responsive brand image.
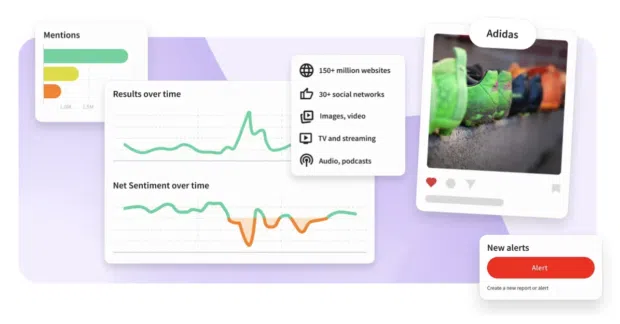
- Where to Find It: X Premium dashboard (under engagement metrics), Notifications tab for direct mentions. For untagged mentions, sentiment analysis, and competitor share of voice, tools like Perch or Lumen by Talkwalker are essential.
10. Profile Visits:
- Definition: The number of times users clicked on your name or handle to view your X profile.
- Why it Matters: A clear signal of user interest, often preceding a follow or deeper exploration of your brand. It indicates that your content has piqued enough curiosity for users to learn more.
- If Profile Visits are Low: Optimize your profile. Pin a high-performing Tweet, craft a compelling bio with a strong CTA, and ensure your profile highlights relevant content. For paid campaigns, consider retargeting users who visited your profile but didn’t convert.
- Where to Find It: X Premium dashboard. Hootsuite’s free AI social media bio generator can assist in optimizing your profile.
11. Video Views and Completion Rate:
- Definition: Video views count how many times a video was played for a set number of seconds. Completion rate measures the percentage of viewers who watched the video to its end.
- Why it Matters: X’s algorithm increasingly favors video content, making watch time a key signal for distribution. Completion rate is a more meaningful metric than raw views, indicating whether your video’s hook, pacing, and length are effective in retaining viewer attention.
- If Video Completion Rate is Low: Viewers are disengaging early. Focus on tightening the first 3-5 seconds, eliminating unnecessary intros, and shortening overall clip length. Ensure captions are available, as many users watch without sound.
- Where to Find It: X Media Studio, X Premium dashboard, or third-party tools like Perch for comprehensive video performance insights.
Strategic Application: Turning Data into Action
Leveraging X analytics effectively moves beyond mere data collection; it’s about translating insights into strategic improvements. Nick Martin of Tipalti shares five key tips for this process:
1. Integrate Post-Level Data with Broader Trends: It’s crucial not to view individual post performance in isolation. While immediate feedback (likes, replies, impressions) on a single Tweet provides tactical insights for quick adjustments, regularly "zooming out" to analyze weekly, monthly, and quarterly profile performance reveals macro trends. This dual perspective allows for continuous content refinement while building a long-term understanding of what consistently resonates with the target audience. Underperforming posts should be treated as learning opportunities, prompting experimentation with formats (images, videos, threads), length, or messaging.
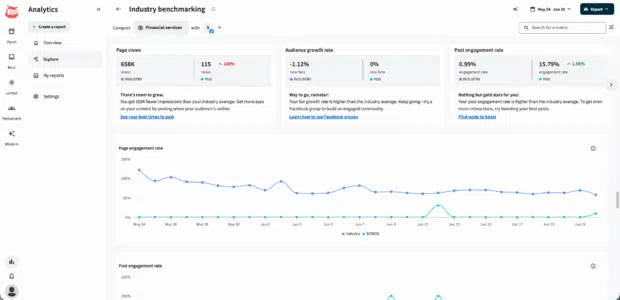
2. Establish Clear Benchmarks for Performance Assessment: Without a baseline, identifying a spike or slump is impossible. Businesses should establish their average performance metrics—impressions, engagement rate, and clicks—for typical posts. A Twitter performance calculator can aid this. For instance, knowing the average X post earned about 33 likes and 7 retweets in 2025 provides an industry context, but your own historical average is the most reliable benchmark. Tools like Perch automate benchmark tracking, allowing for easy comparison against previous periods or industry averages without manual data compilation.
3. Prioritize Metrics Aligned with Marketing Goals: The X analytics dashboard presents a wealth of numbers, but not all are equally relevant to every strategy. As Martin notes, if the primary social media strategy is brand awareness, metrics like impressions, engagements, and clicks take precedence. Metrics such as sentiment score or support requests, while valuable, might be de-emphasized if they don’t directly support the team’s core objectives. The key is to identify and prioritize the signals that directly contribute to your specific business outcomes.

4. Leverage Competitor Activity for Strategic Insights: While direct access to competitors’ analytics is impossible, monitoring their activity and audience response offers invaluable strategic intelligence. Setting up private X lists of competitor accounts and utilizing social listening tools allows brands to observe successful content formats, trending topics, and audience engagement patterns within their niche. If a particular content type performs well for a peer brand, it warrants testing within your own content mix. Tools like Nest by Hootsuite facilitate building private streams to track competitor posts and mentions, offering comparative performance insights.
5. Disseminate Insights Beyond the Social Media Team: The value of X analytics extends far beyond the social media department. Sharing top-performing content and audience feedback with product, sales, and creative teams can foster cross-functional synergy. Customer feedback gleaned from replies and mentions can inform product development decisions. Competitive intelligence data can equip sales teams with market insights. Identifying high-performing creative assets can inspire broader design choices across marketing campaigns. By telling a larger story with analytics, social media teams can demonstrate tangible business impact and contribute to smarter organizational decision-making.

The Toolkit: Best Analytics Solutions for 2026
Given the evolving nature of X’s native analytics, many organizations are turning to third-party tools for comprehensive, customizable, and integrated reporting.
1. Perch by Hootsuite:
- Best For: Teams and enterprise brands seeking custom reports and cross-platform comparisons.
- Key Strength: Offers a full view of X content performance alongside all other social platforms, with customizable dashboards, real-time monitoring (Hootsuite Streams), and integration with social listening tools like Lumen by Talkwalker for sentiment and share of voice analysis. Its built-in Ow.ly URL shortener provides invisible tracking for all shared links.
- Key Limitation: Pricing can be steep for solo creators or very small teams.
- Rating: 5/5
2. Buffer:
- Best For: Solo marketers and small teams who need simple, fast access to core post metrics.
- Key Strength: User-friendly interface, decent historical data (up to 2 years on paid plans), and best-time-to-post recommendations. Its straightforward approach makes it easy to track performance and maintain consistency.
- Key Limitation: Lacks social listening, competitor tracking, and the in-depth customizable reporting offered by more robust platforms.
- Rating: 4/5
3. Later:
- Best For: Creators who primarily schedule their X content through Later.
- Key Strength: Monitors follower growth, engagement metrics, and post performance specifically for content scheduled via the platform. Provides best-time-to-post recommendations and allows sorting Tweets by various engagement metrics.
- Key Limitation: Only tracks posts published through Later, and typically offers only three months of historical data, limiting long-term trend analysis.
- Rating: 3/5
Broader Implications and Future Outlook
The shift in X’s analytics strategy has significant implications for the broader digital marketing ecosystem. It underscores a growing trend of social media platforms monetizing features previously offered for free, compelling marketers to adapt. This environment necessitates a more strategic approach to tool selection and budget allocation, as reliable data now often comes at a cost. For businesses, this means potentially increased operational costs for analytics, but also an opportunity to invest in platforms that provide more integrated and actionable insights across their entire social media presence.

The competition among third-party analytics tools is likely to intensify, driving innovation in areas like AI-powered insights, predictive analytics, and enhanced cross-platform reporting. Marketers will increasingly rely on these tools not just for data collection, but for strategic guidance, competitive intelligence, and demonstrating tangible ROI to senior stakeholders. KPIs such as link clicks, traffic, leads, and conversions will remain paramount for proving business impact, complemented by engagement rate, share of voice, and sentiment to illustrate brand health and growth. Tracking X’s impact across the customer journey—from impressions (awareness) to replies and mentions (loyalty)—will become more sophisticated through the integration of social data with CRM systems.
Ultimately, while the accessibility of native X analytics has become more restricted, the fundamental need for data-driven social media strategy remains. The current environment challenges marketers to be more resourceful and strategic in their approach to understanding performance, ensuring that every post on X contributes meaningfully to overarching business objectives.


 Lina Hope
 Jia Lissa