
The determination of an A/B test’s duration is not merely a logistical detail but a foundational pillar of statistical validity in digital experimentation. While the industry often seeks a universal timeframe for running experiments, experts clarify that the "correct" duration is a variable output derived from four critical inputs: traffic volume, the Minimum Detectable Effect (MDE), statistical significance thresholds, and the desired statistical power. Without a rigorous pre-test calculation of these factors, organizations risk making high-stakes business decisions based on "noise" rather than stable consumer behavior signals.
The Strategic Role of Test Duration in Conversion Rate Optimization
Test duration is defined as the total elapsed time from the moment traffic is first split between variants to the point at which a definitive conclusion is reached. In the context of professional experimentation, this timeframe serves as the ultimate feasibility study. Before a single line of code is deployed, a duration estimate acts as a filter for the experimentation backlog. If a proposed change to a low-traffic segment of a website requires 20 weeks to reach statistical significance, the duration calculation signals that the hypothesis is currently unviable. This allows growth teams to pivot toward high-impact, high-velocity tests that can yield actionable data within a reasonable business cycle.
Furthermore, duration directly dictates the velocity of an optimization program. Every experiment occupies a "slot" in the testing pipeline; longer tests naturally limit the number of hypotheses a team can validate within a fiscal quarter. For teams with limited traffic, the challenge is amplified, often forcing a strategic choice between running a few "bold" tests with high expected impact or multiple smaller tests that may never reach the requisite significance to justify implementation costs.

Core Statistical Concepts Governing Experiment Timelines
To accurately calculate how long a test must run, practitioners must first define several statistical parameters. These values collectively determine the "sample size," which is the total number of visitors required to confirm that a result is not due to random chance.
1. Minimum Detectable Effect (MDE)
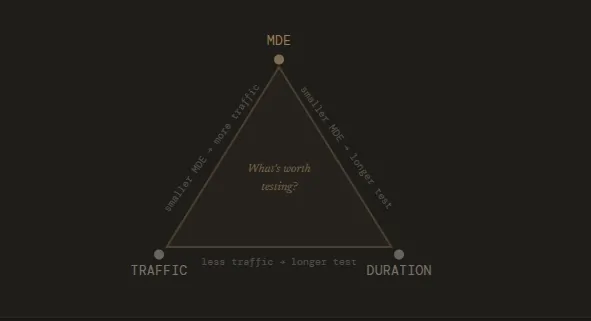
The MDE is the smallest change in conversion rate that a business deems worth detecting. There is an inverse relationship between the MDE and test duration: detecting a subtle 1% lift requires a significantly larger sample size—and thus more time—than detecting a 10% "game-changing" lift. Setting an MDE requires a balance between statistical sensitivity and business reality. If the cost of implementing a new feature is high, the MDE should be set at a level that justifies that investment.
2. Statistical Significance (Alpha)
Commonly set at 95%, this threshold represents the probability that the observed difference between variants is not a result of random variation. A 95% significance level implies a 5% risk of a "Type I error," or a false positive. Increasing the significance threshold to 99% provides more certainty but necessitates a longer duration to collect the additional data required to clear that higher bar.
3. Statistical Power (Beta)
Statistical power, usually set at 80%, is the probability that a test will correctly identify a winner if one actually exists. High power reduces the risk of "Type II errors," or false negatives, where a truly beneficial change is discarded because the test was too short to prove its efficacy.
4. Baseline Conversion Rate
The current performance of the page being tested serves as the starting point. High-performing pages generally require fewer additional conversions to prove a statistically significant uplift compared to low-performing pages, assuming traffic levels are constant.
Expert Methodologies for Calculating Duration
Modern experimentation leaders advocate for a move away from "gut feel" toward data-driven scheduling. Sadie Neve, Group Digital Experimentation Manager at Rubix, emphasizes the importance of mapping the "experimentation landscape" before launching individual tests. By analyzing traffic volumes and baseline performance across various site segments, teams can identify which areas are "experimentable." Neve utilizes a structured approach involving spreadsheets that ingest baseline data and daily traffic to generate a matrix of possible MDEs. This prevents the design of experiments that are mathematically destined to fail due to insufficient traffic.
Kateryna Berestneva, CRO Manager at SomebodyDigital, suggests a practical conversion threshold as a secondary safeguard. In her framework, a test should ideally reach a minimum of 100 conversions per variation alongside the 95% significance threshold. In practice, for many mid-to-high traffic sites, this typically translates to a duration of four to six weeks. This timeframe is often sufficient to capture the "natural behavioral cycles" of a consumer base.
Gerda Thomas, co-founder of Koalatative, argues for the total removal of guesswork through the use of pre-test duration calculators. By inputting weekly visitors and conversion counts, these tools provide a defensible, fixed-horizon timeframe. The consensus among these experts is clear: the duration must be calculated upfront, committed to, and respected regardless of early fluctuations in the data.
The Dangers of "Peeking" and Preemptive Termination
One of the most pervasive errors in A/B testing is the "peeking problem." This occurs when stakeholders monitor results daily and stop a test the moment a variant appears to be winning. Statistically, p-values are highly volatile in the early stages of a test. Random variance can easily create the illusion of a massive winner or a devastating loser within the first few days.
If a test is stopped early based on a "peek," the false positive rate inflates dramatically. This phenomenon, often referred to as "p-hacking," leads to the implementation of changes that do not actually improve the user experience. Over time, this erodes the credibility of the experimentation program, as "winning" tests fail to translate into actual revenue growth or long-term conversion improvements.
Sadie Neve warns that early stopping distorts the long-term roadmap. When experiments feed an iteration pipeline, inaccurate data leads to the prioritization of the wrong ideas and the abandonment of concepts that may have had potential if given the full time to mature. The damage is cumulative; a program built on false positives eventually loses the trust of executive leadership.
The Business Cycle Constraint: Why Tests Shouldn’t Run Forever
While stopping too early is a risk, running a test for too long introduces its own set of complications. Most experts recommend that an A/B test should not exceed one full business cycle, typically defined as 28 days or four weeks. There are several reasons for this limit:

- Sample Pollution: The longer a test runs, the higher the likelihood that external factors will interfere. This includes "cookie clearing" by users, which can cause a returning visitor to be reassigned to a different variant, or seasonal shifts (e.g., a holiday weekend) that alter baseline behavior.
- External Events: Major news cycles, algorithm updates by search engines, or competitor marketing campaigns can create "noise" that drowns out the signal of the A/B test.
- Opportunity Cost: A test that takes three months to reach significance is a test that is blocking other potentially more impactful experiments from running on that same page.
If a duration calculator suggests a test will take 12 weeks to reach significance, the strategic response is not to run the test for 12 weeks, but rather to rethink the experiment. This might involve targeting a larger audience, testing a more "radical" change with a higher expected MDE, or moving the test higher up the funnel where traffic is more abundant.
Exceptional Circumstances for Early Termination
While the standard rule is to never stop a test early, professional consultants like Ioana Iordache of Io Growth Lab identify three specific scenarios where an early halt is the responsible choice:
- Technical Malfunctions: If a variant is "broken" (e.g., the "Buy" button does not work on mobile devices), the test must be stopped immediately to prevent further revenue loss.
- Devastating Performance Drops: If a variant causes a statistically significant and massive drop in a primary business metric (e.g., a 50% crash in checkout completions), it is often halted to protect the business’s bottom line.
- The "Extreme Winner" (Rare): In very rare cases where a variant shows an astronomical, stable, and statistically significant lift that far exceeds the MDE within the first week, some teams may choose to stop early. However, this is still viewed with skepticism by statisticians due to the risk of novelty bias.
Implementation and Long-term Impact
To build a mature experimentation culture, organizations should adopt a standardized workflow for duration planning. This begins with the use of tools like the Convert Test Duration Calculator, which utilizes frequentist statistics to provide a fixed-horizon timeframe. By entering weekly traffic, conversion counts, and the number of variants, teams can obtain a clear "window of execution."
The broader impact of disciplined duration planning is a more reliable and predictable growth engine. When stakeholders understand that a test requires four weeks to produce a result, it manages expectations and reduces the pressure on analysts to "find a winner" prematurely. Ultimately, the goal of A/B testing is not just to find "lifts," but to generate high-quality insights that accurately reflect how users interact with a brand. By respecting the mathematics of test duration, companies ensure that their optimization efforts are built on a foundation of facts rather than fleeting statistical anomalies.