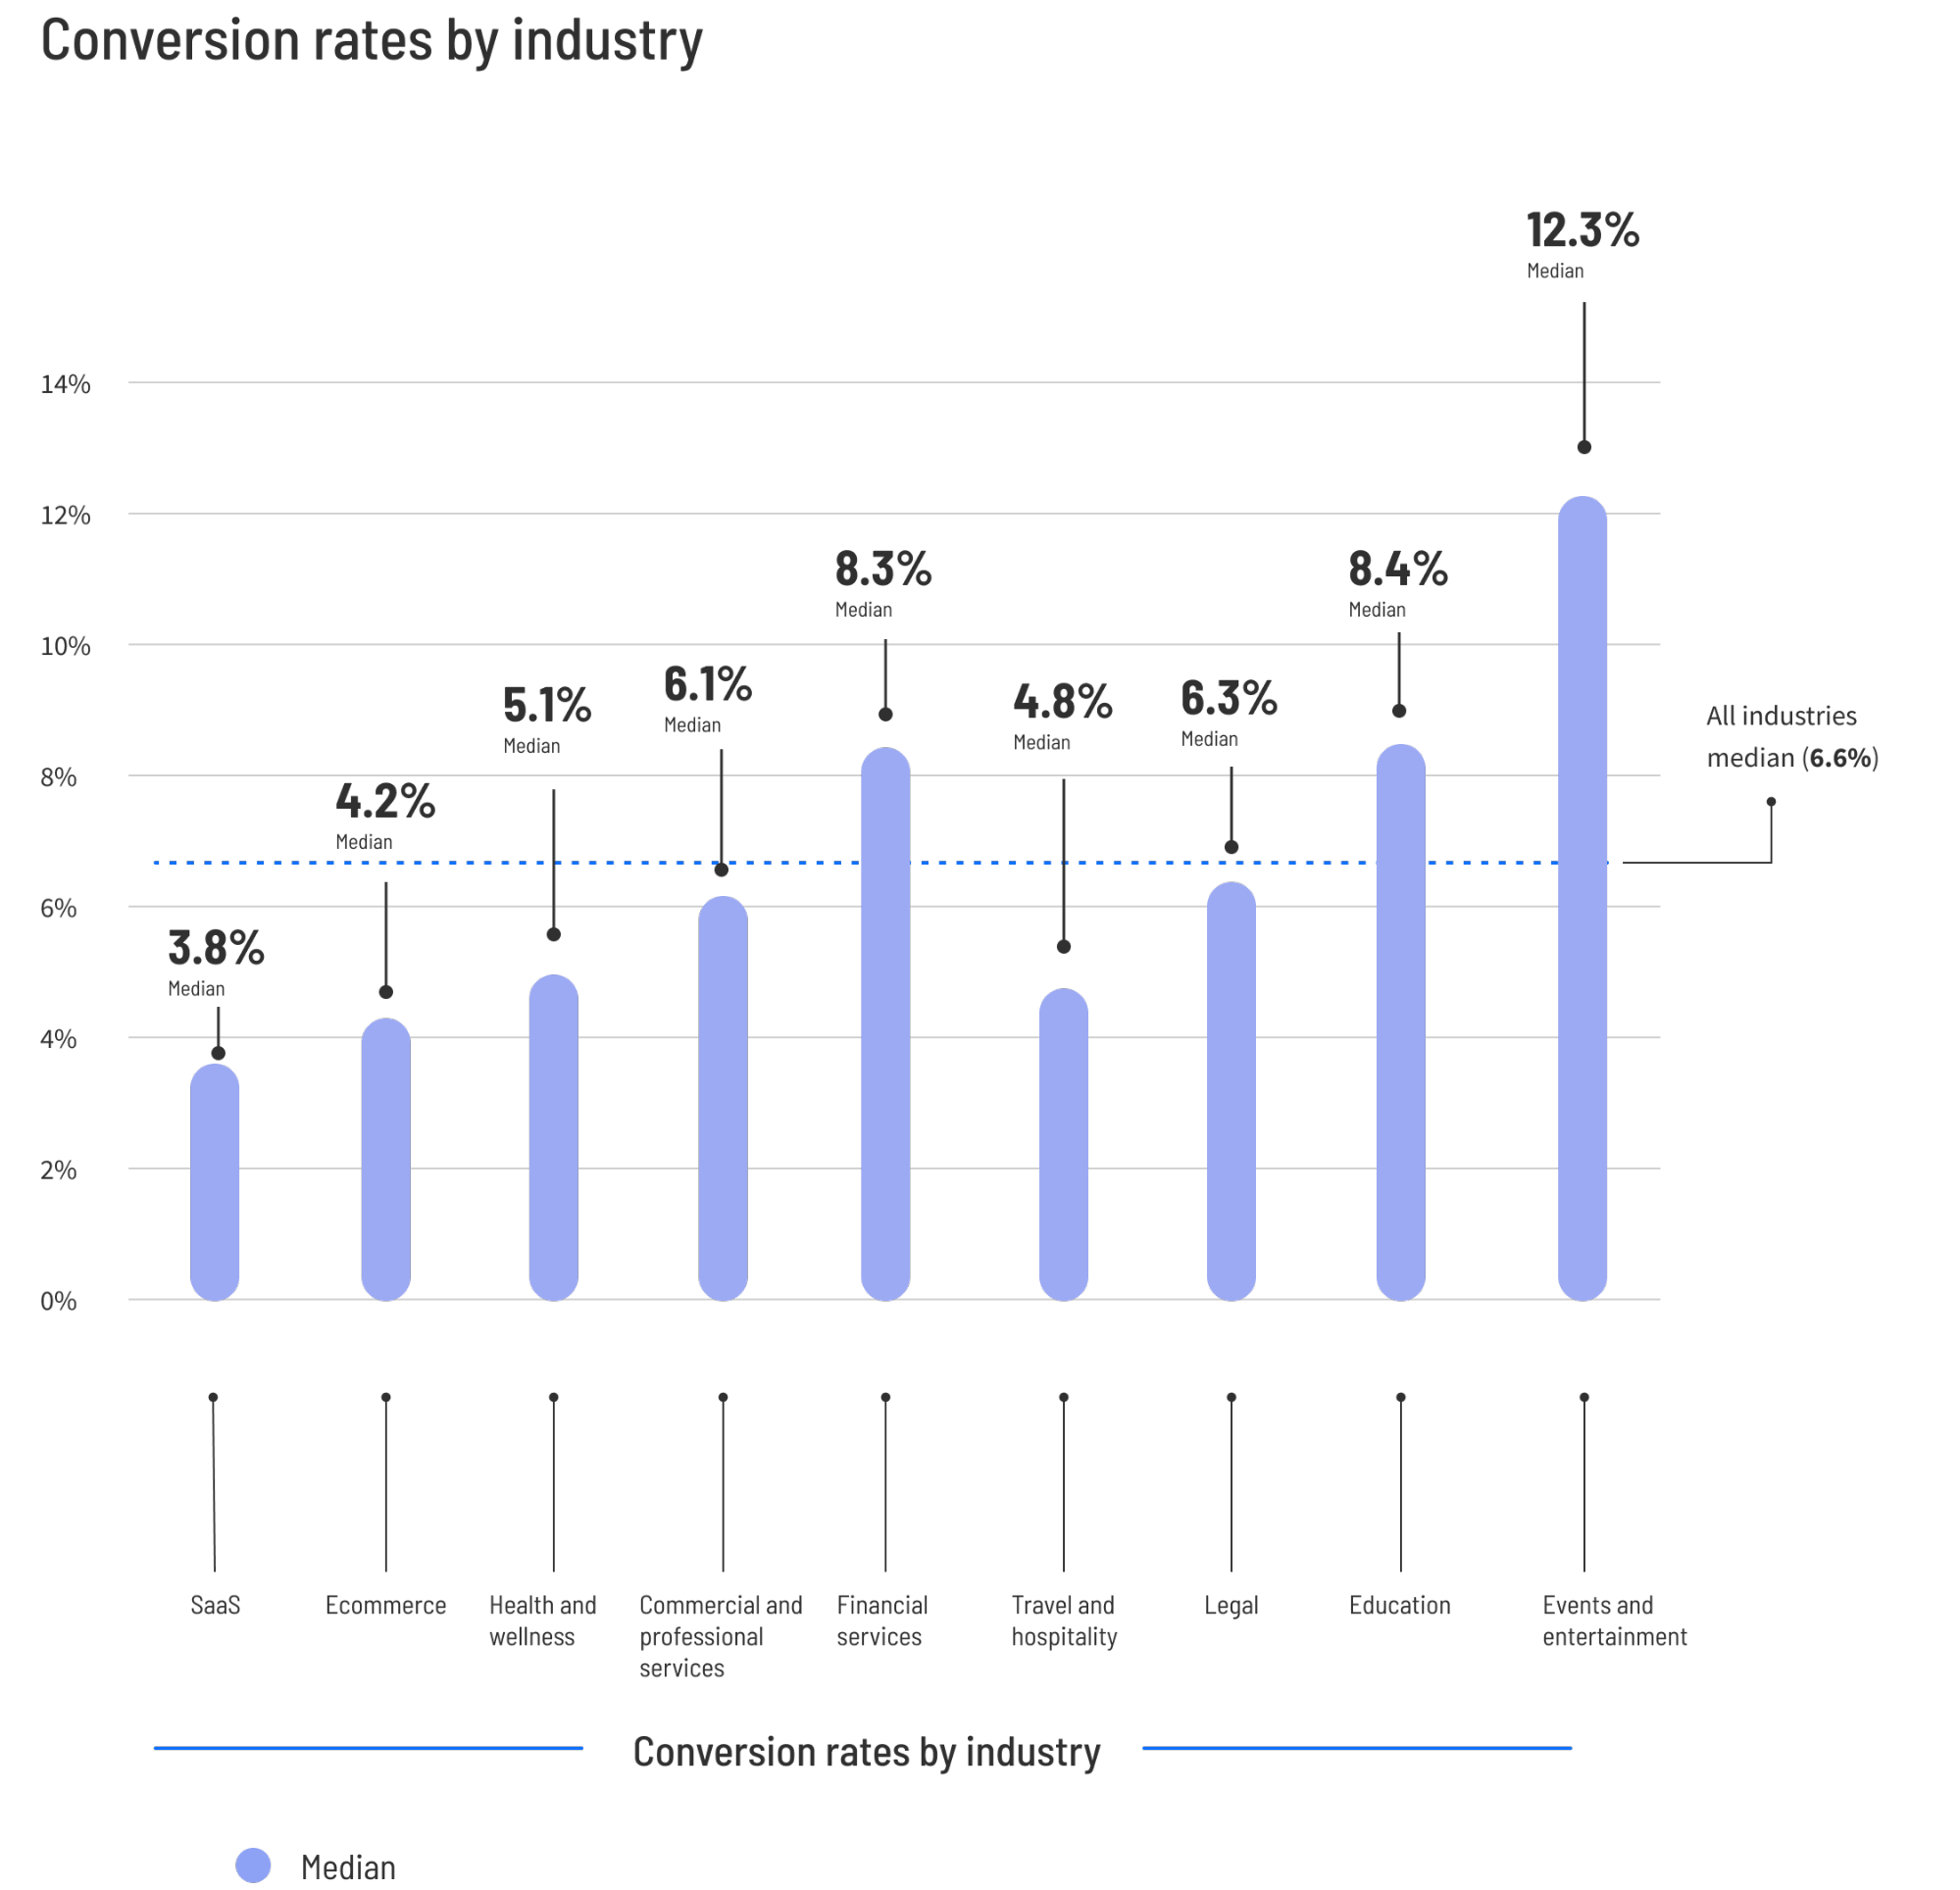
The global digital marketing sector has reached a critical inflection point in 2024, as evidenced by the release of comprehensive performance data indicating that the median conversion rate for landing pages now stands at 6.6% across all major industries. This figure, derived from the analysis of over 57 million conversions and 464 million pageviews across 41,000 distinct landing pages, serves as the definitive baseline for modern performance marketing. However, the data reveals a significant performance gap between average performers and the top 25% of marketers, who achieve conversion rates ranging from 11.4% to upwards of 40%, depending on the specific sector and campaign objectives.

Methodology and the Shift Toward Median Benchmarking
The 2024 Conversion Benchmark Report marks a departure from traditional "average-based" reporting, opting instead for median values to provide a more accurate representation of the market. In statistical analysis, the mean or average is frequently skewed by "unicorn" pages—those rare instances where a landing page might convert at 80% or 90% due to highly specific, warm traffic—as well as by failed campaigns that result in near-zero conversion. By utilizing the median, analysts have identified the true "middle-of-the-pack" performance, allowing businesses to compare their results against a realistic standard rather than an inflated average.
This methodological shift is essential for strategic planning. For instance, in an environment where a single high-earning outlier can distort the average, the median provides a grounded metric for return on ad spend (ROAS) projections. Marketing firms and internal growth teams are increasingly adopting this "75th percentile" target as the standard for "good" performance, implying that a page must outperform three-quarters of its competitors to be considered highly effective.

Sector-Specific Performance Data and Chronological Trends
The evolution of conversion rates over the last fiscal year demonstrates that user intent and industry-specific friction points remain the primary drivers of performance. The following breakdown illustrates the current state of the market across various verticals:
E-commerce and Retail
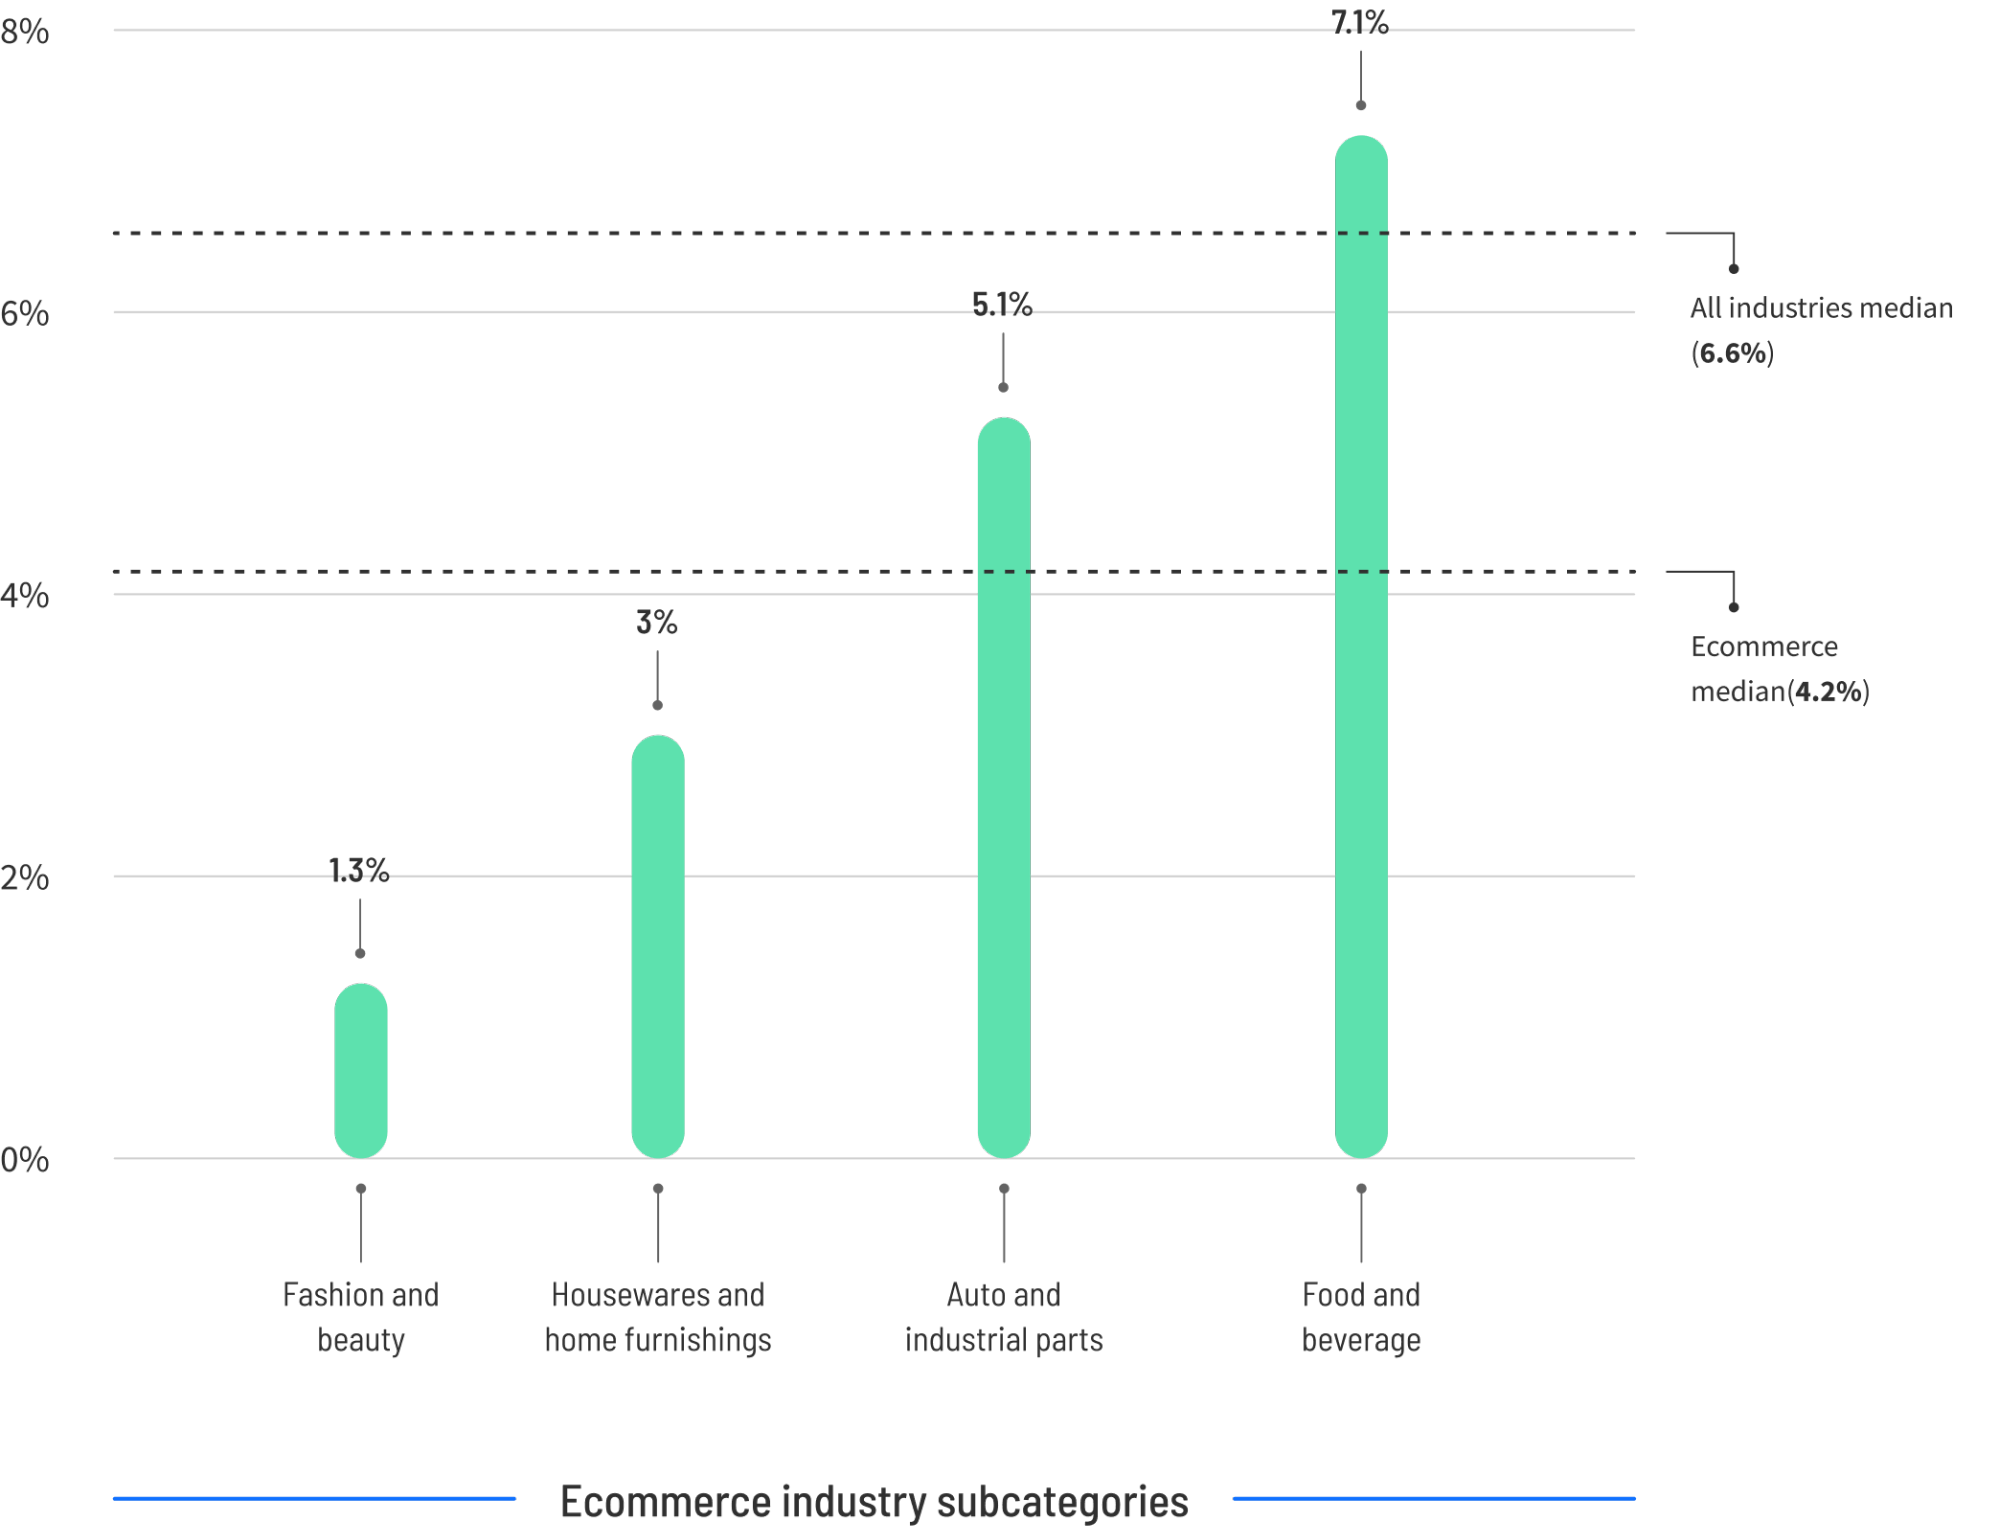
The median conversion rate for e-commerce landing pages is currently 4.2%. While this may appear lower than the cross-industry average, it reflects the high volume of "window shopping" and comparison behavior inherent in online retail. Within this sector, a "good" conversion rate—representative of the top 25%—starts at 11.4%.
Data suggests a significant divergence within sub-sectors. Food and beverage landing pages typically see a median conversion of 7.1%, driven by lower price points and high-frequency purchasing habits. Conversely, fashion and beauty sectors struggle with a 1.3% median, as these categories often require higher levels of visual brand affinity and involve more complex return-policy considerations.
Software as a Service (SaaS)
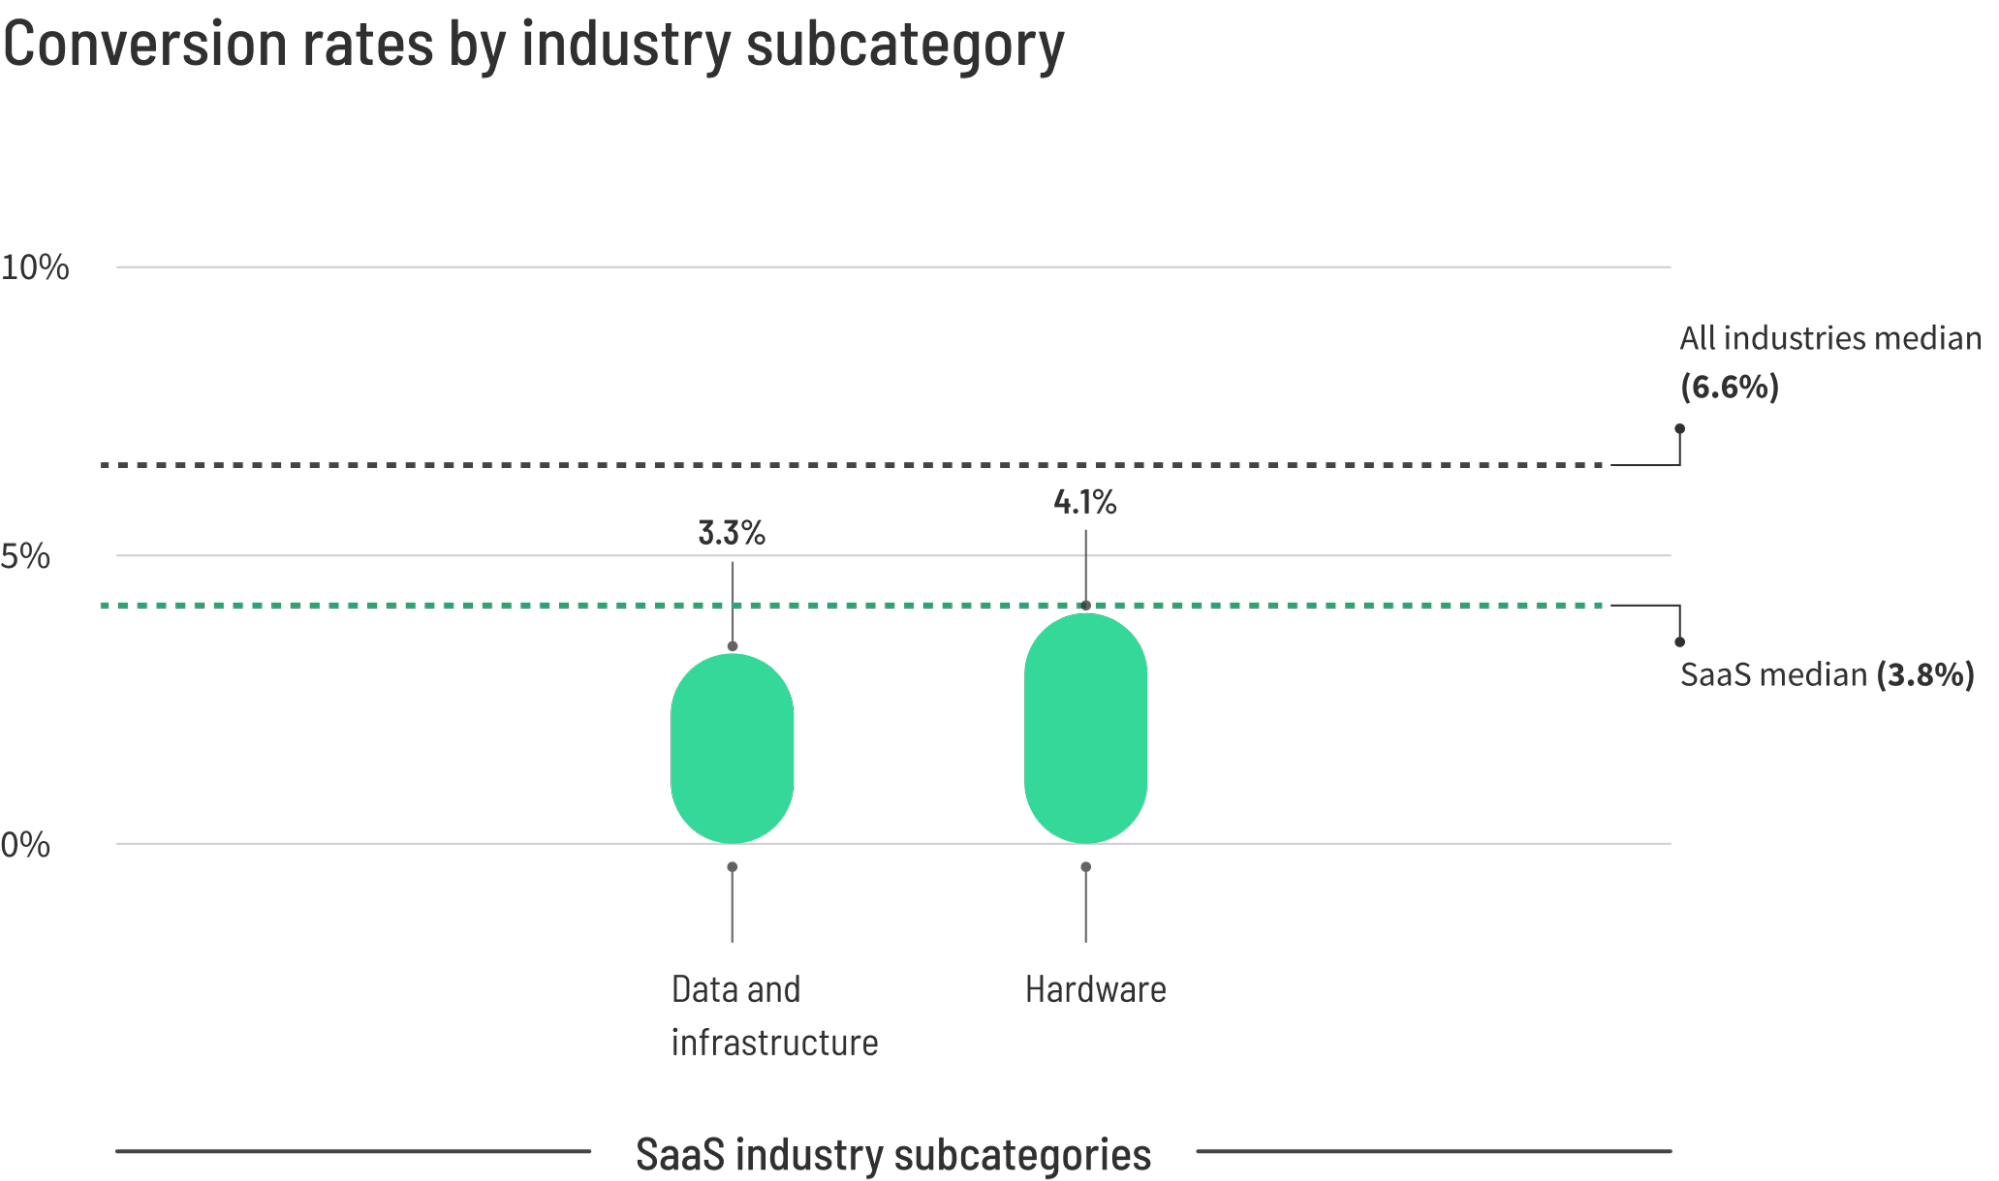
The SaaS sector continues to face unique challenges, with a median conversion rate of 3.8%. This lower-than-average figure is attributed to longer sales cycles, the necessity of multi-stakeholder approval in B2B environments, and the complexity of the products being sold. Top-tier SaaS performers, however, are reaching 11.6% by utilizing "freemium" models or low-friction trial sign-ups. Infrastructure and data-focused SaaS solutions see even tighter margins, with a 3.3% median, whereas hardware-integrated software solutions perform slightly better at 4.1%.
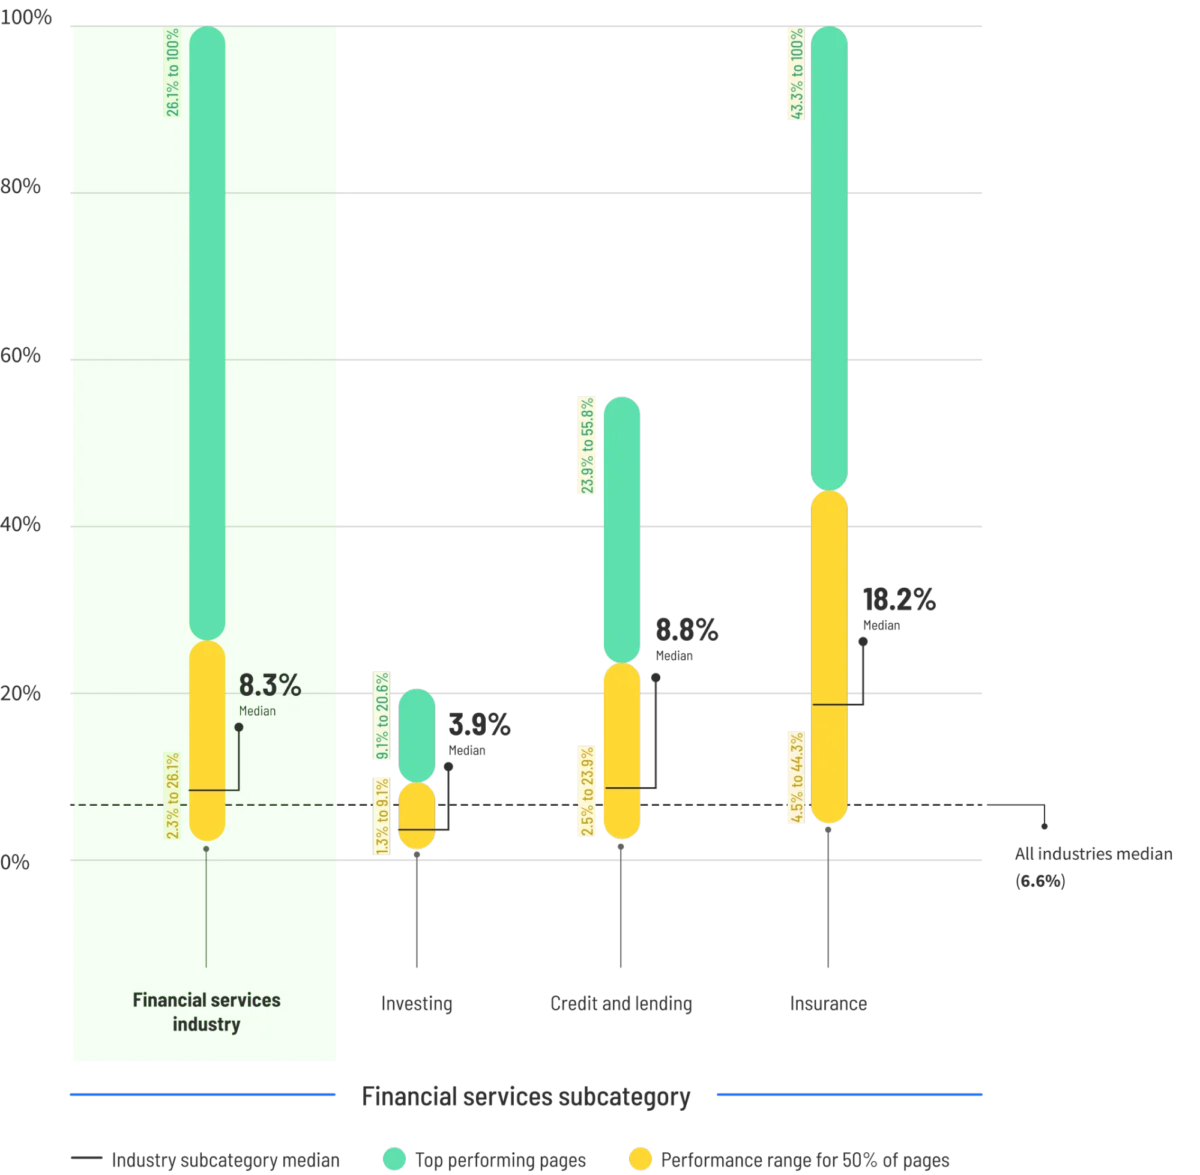
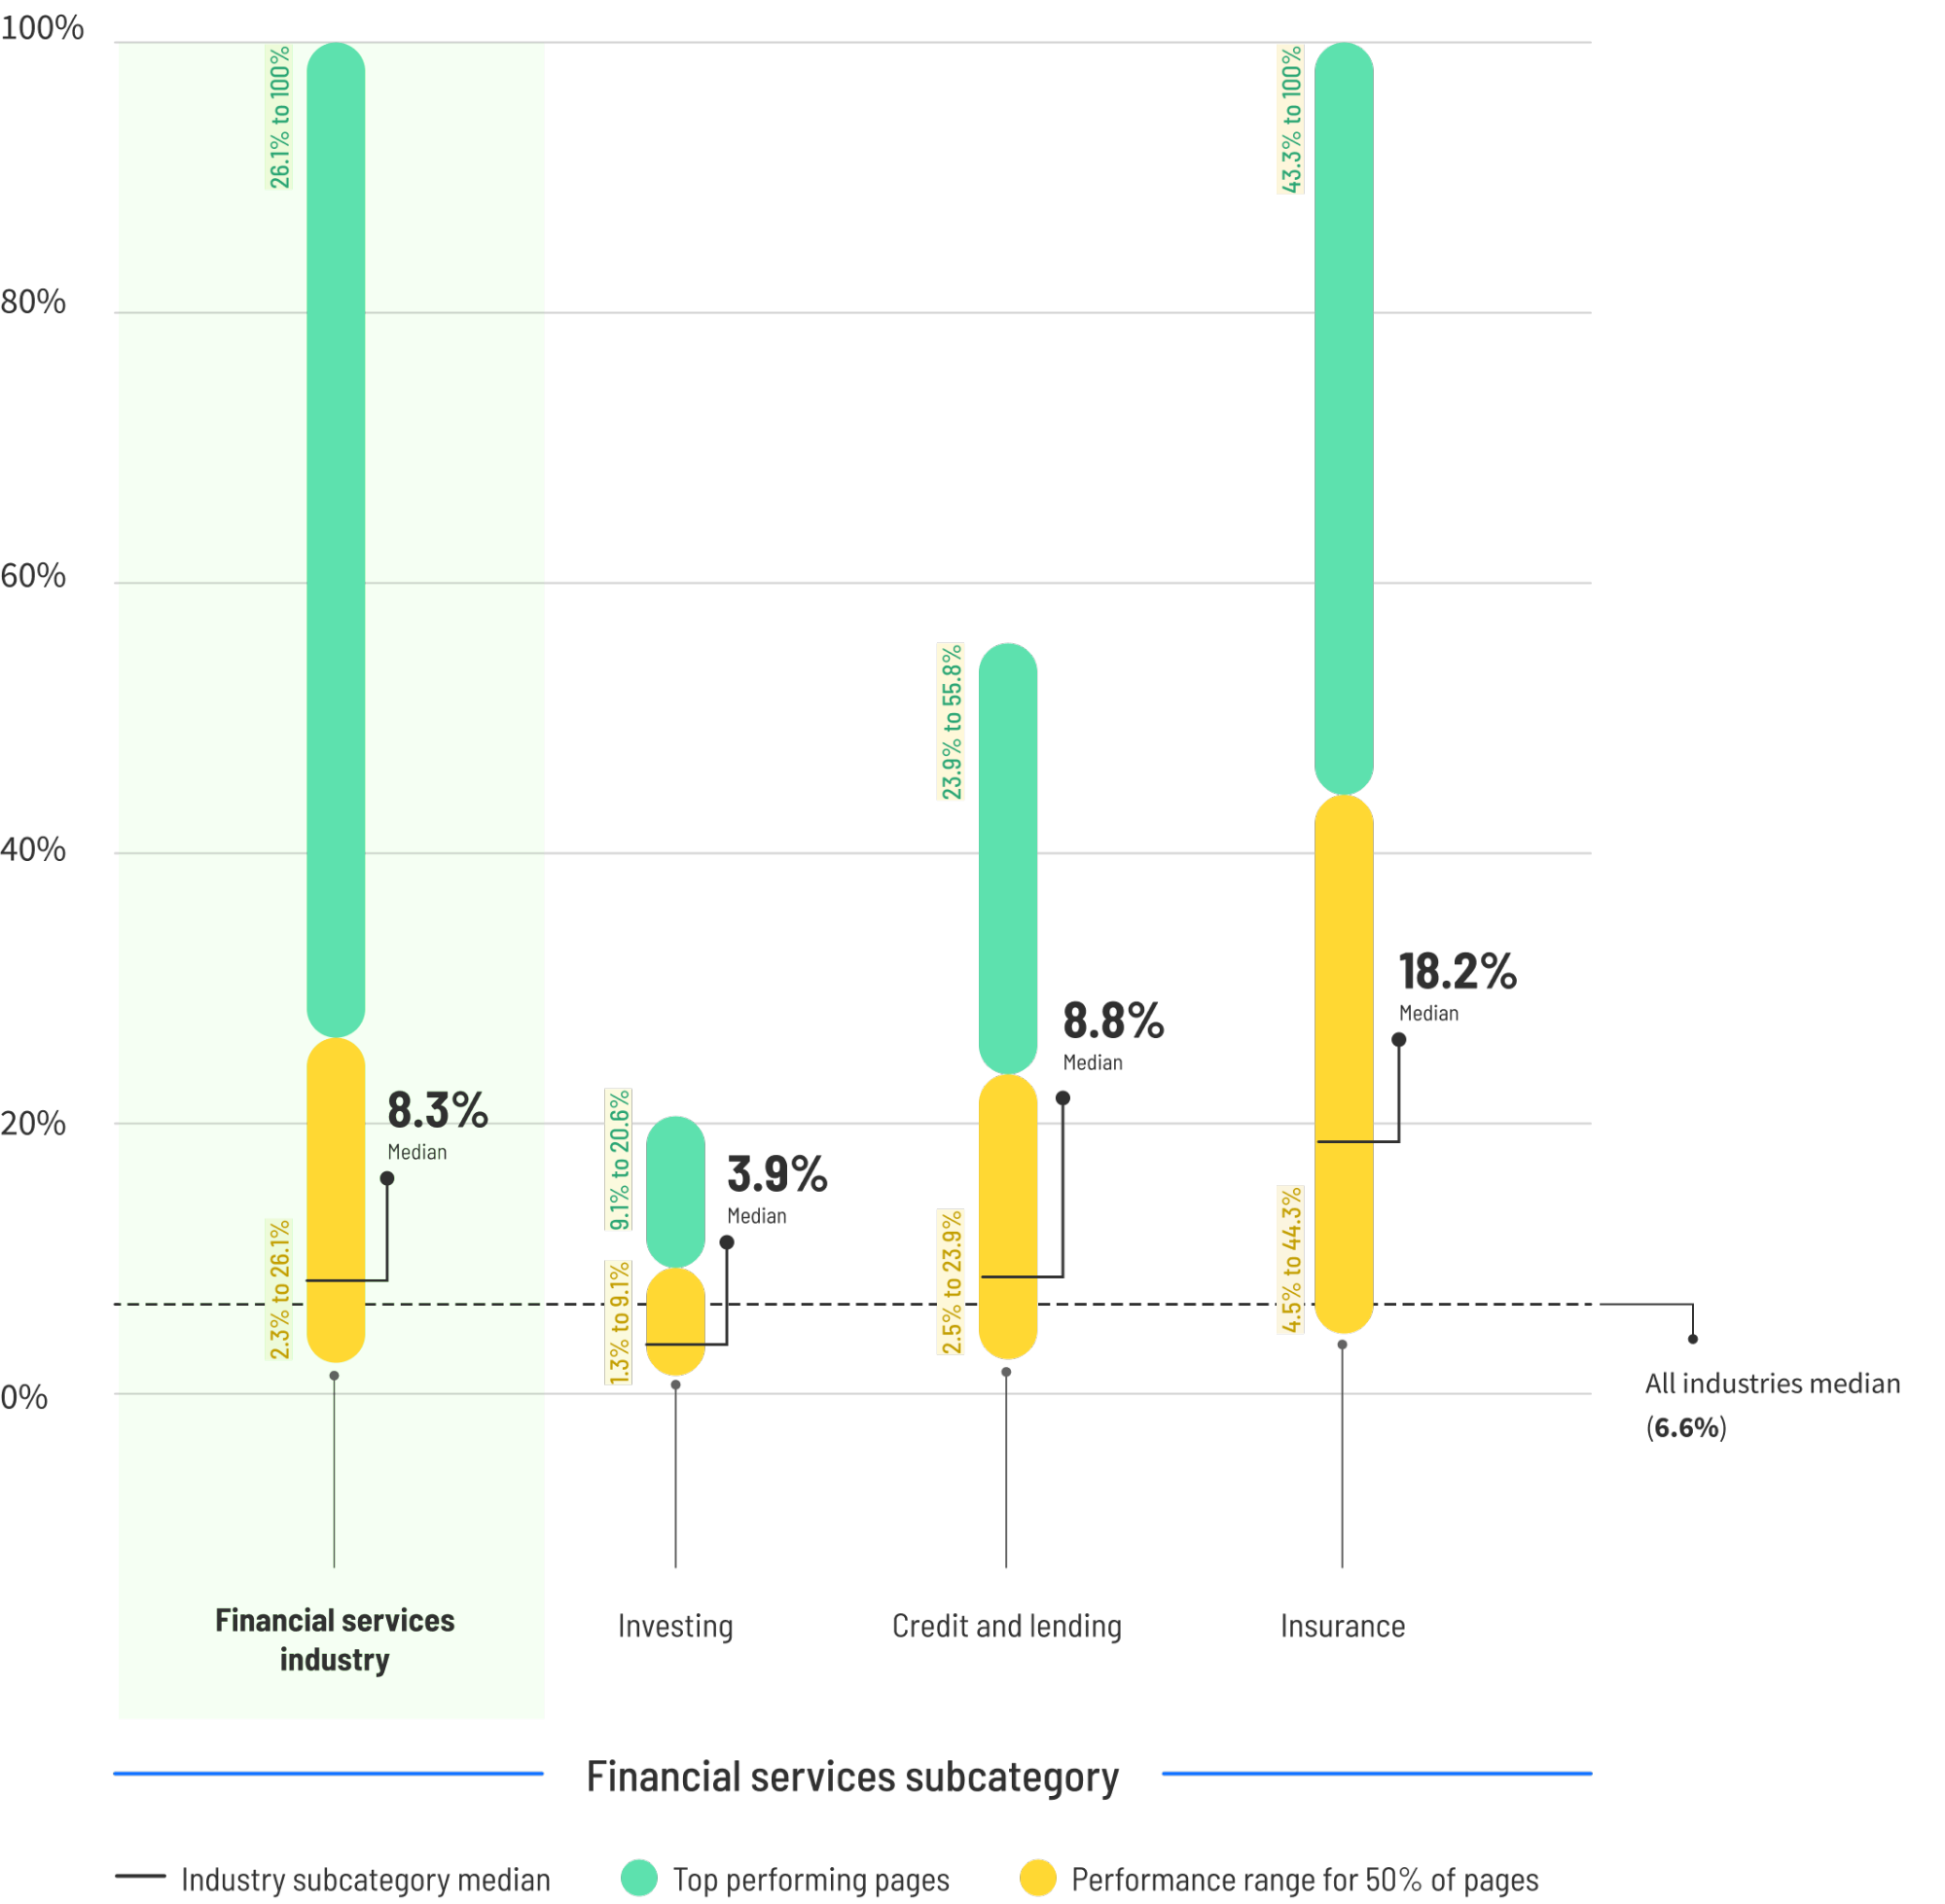
Financial and Insurance Services
Financial services exhibit a robust median conversion rate of 8.3%. This is largely due to the "high-intent" nature of the traffic; consumers searching for insurance or investment options are typically further along in the decision-making funnel. Notably, insurance-specific pages are outperforming the broader category with an 18.2% median. A unique trend identified in 2024 is the dominance of mobile in this sector, where mobile traffic converts 27.8% better than desktop, suggesting that consumers are increasingly managing urgent financial needs via handheld devices.
Professional and Legal Services
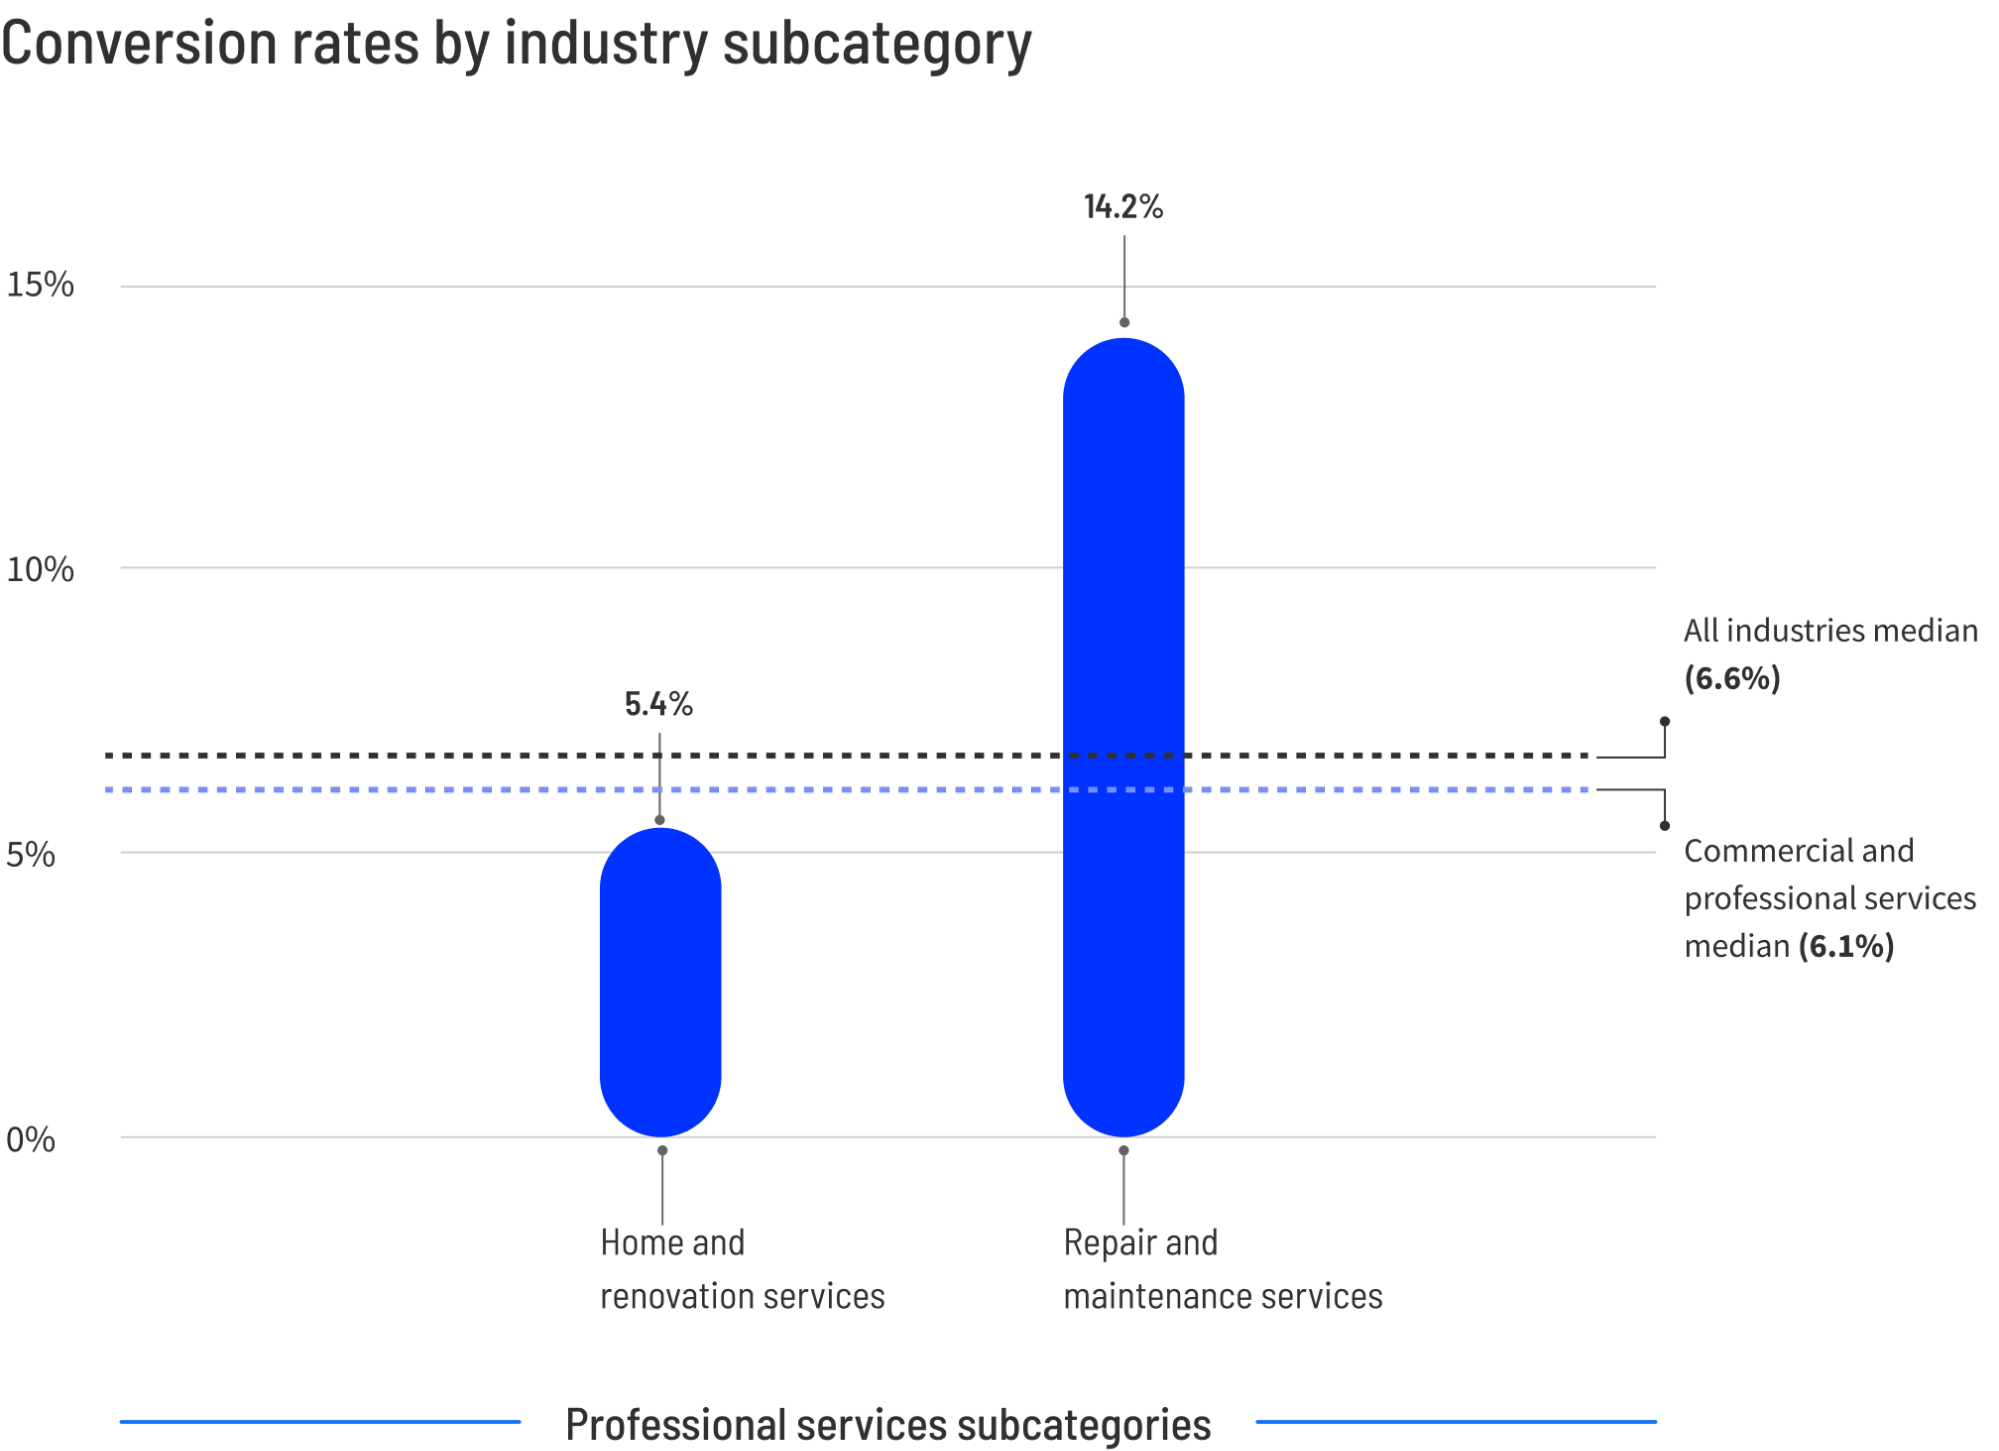
Professional services, including consulting and home maintenance, maintain a 6.1% median. The legal sector follows closely at 6.3%, but with a distinct characteristic: urgency. Legal landing pages see a 21% conversion rate on mobile compared to 15.9% on desktop. This suggests that the "emergency" nature of legal needs—such as accidents or urgent filings—drives immediate action on mobile devices. For legal practitioners, paid search traffic remains the most effective channel, converting at nearly double the rate of any other source.
The Role of Traffic Channels and Device Optimization
The 2024 data highlights a persistent disparity between desktop and mobile performance across most industries, with the notable exception of the legal and financial sectors. Despite mobile devices accounting for approximately 83% of all landing page visits, desktop often retains a higher conversion efficiency in high-consideration industries like travel and SaaS.
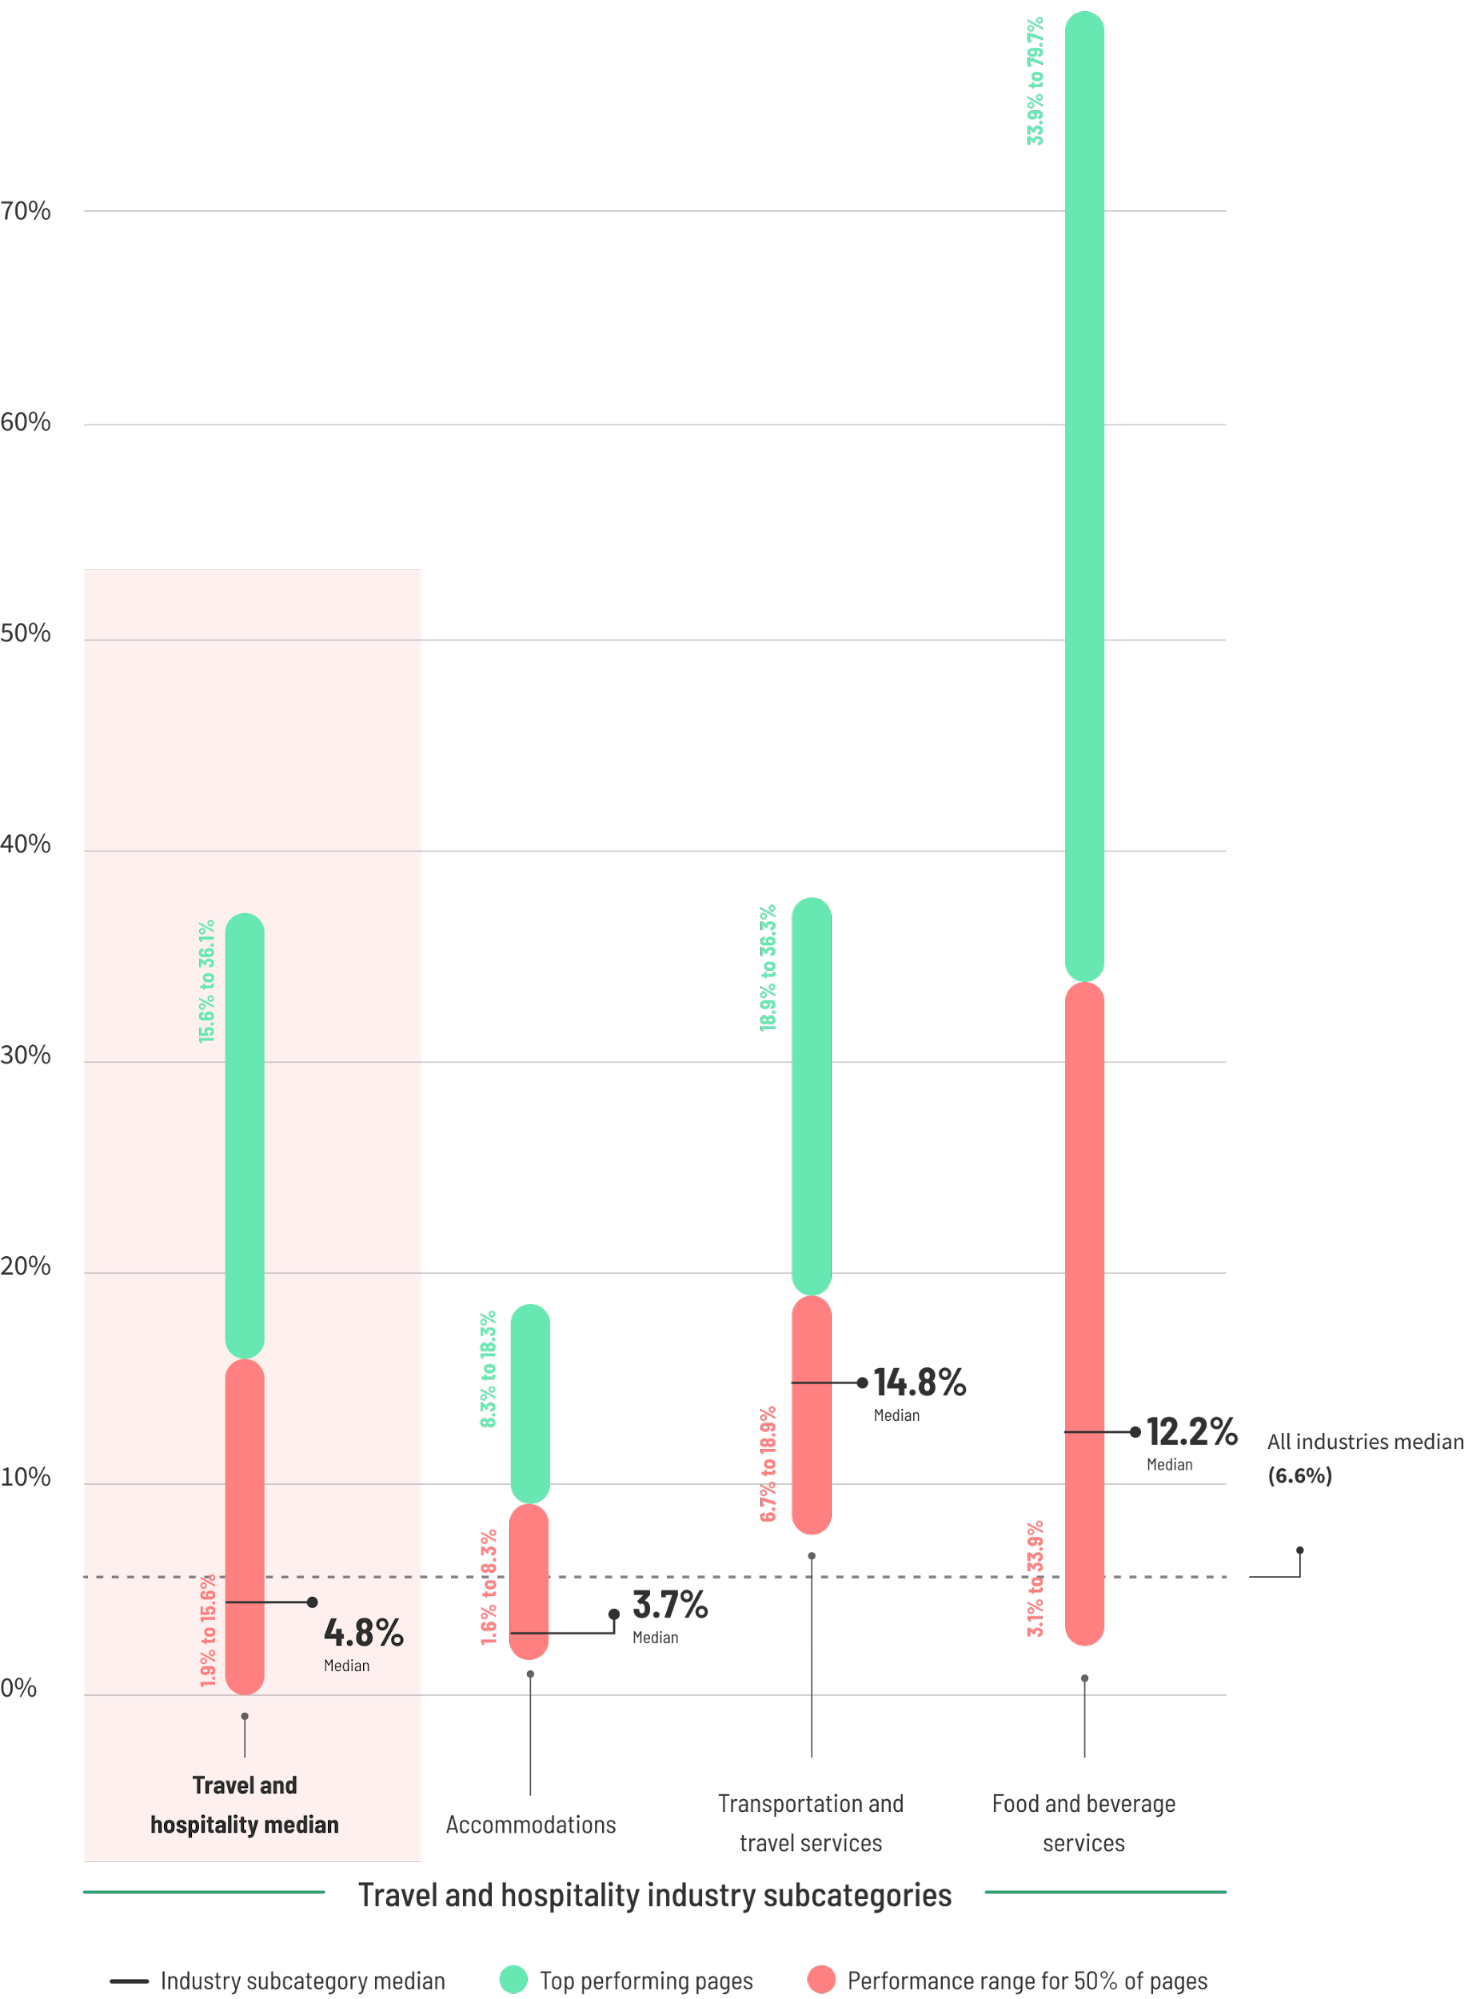
In the travel and hospitality industry, which sees a median conversion rate of 4.8%, desktop traffic outperforms mobile by 10.4%. This indicates a "multi-device journey" where consumers perform initial discovery on mobile but return to desktop to complete high-value bookings that require detailed itinerary reviews and secure payment entries.
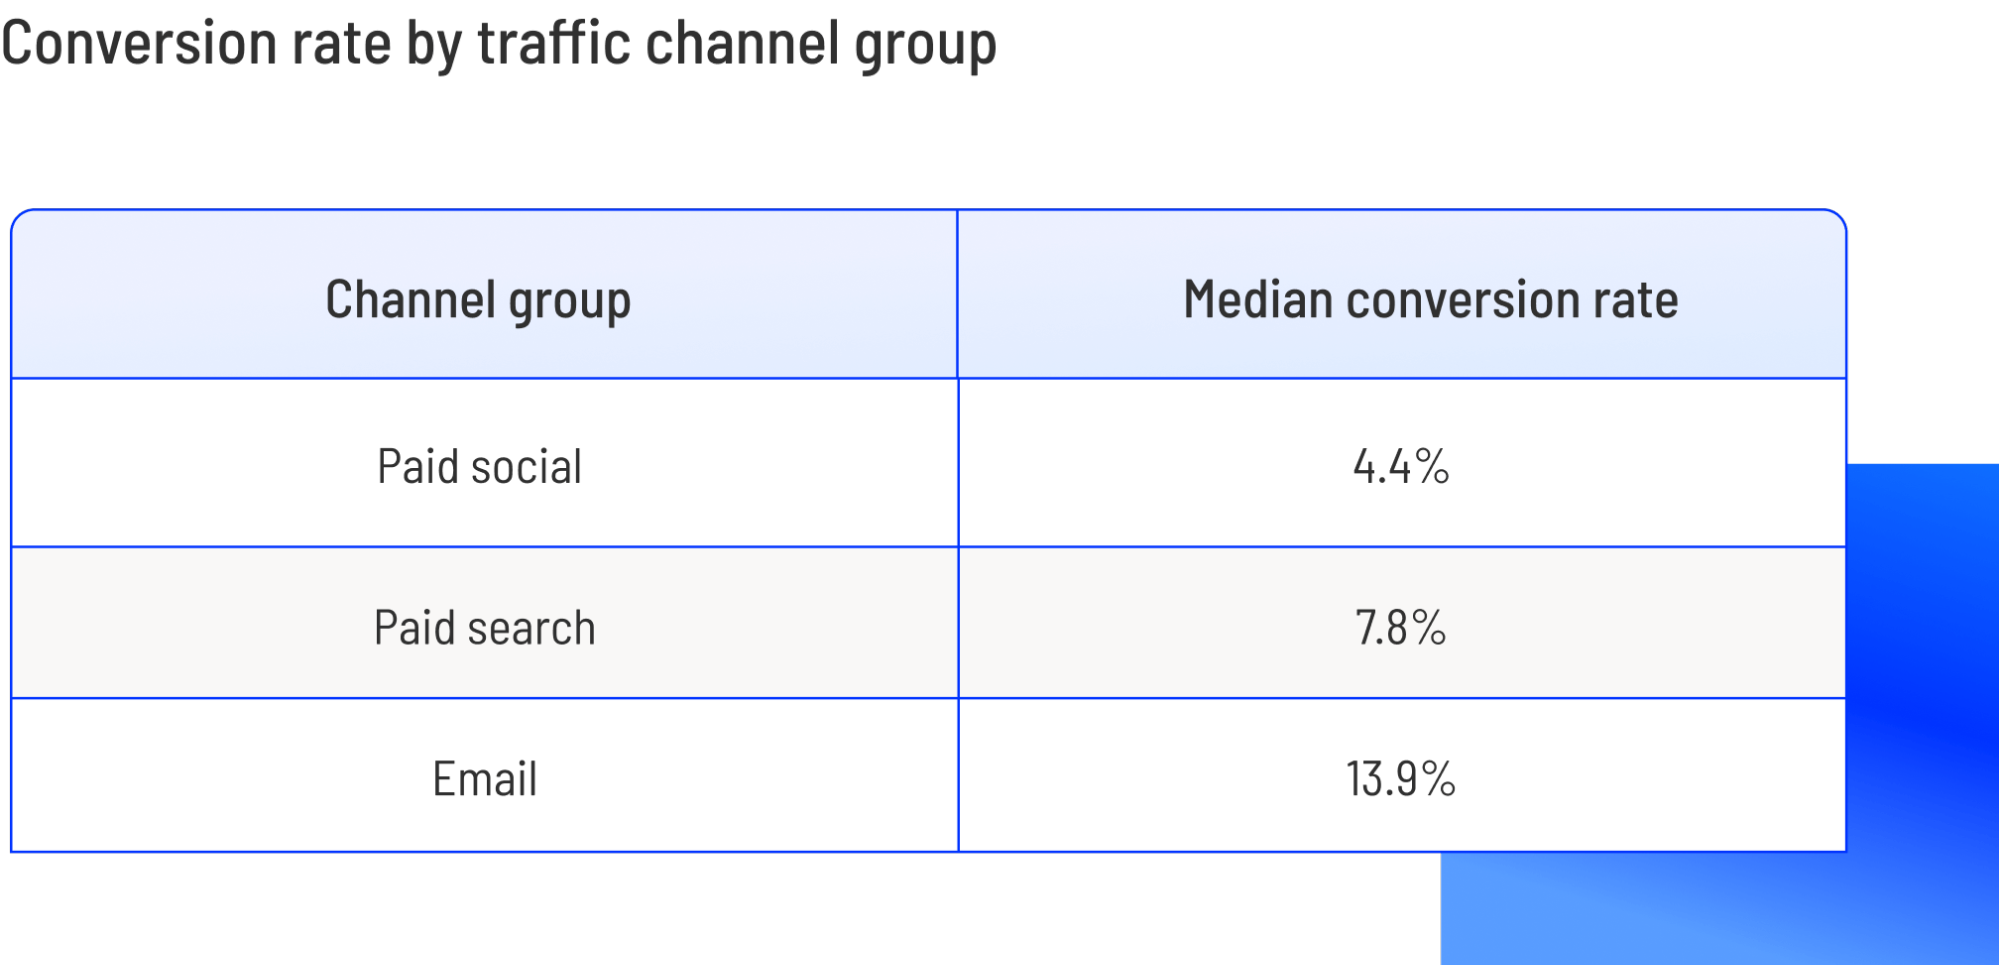
Traffic source also plays a pivotal role in determining success. Email marketing continues to be the highest-converting channel for professional services and education, often yielding double the conversion rates of paid social media. In the education sector, where the median conversion is 13.5%, email traffic reaches 14.1%, whereas paid search sits at 7.3%. This reinforces the importance of lead nurturing and "warm" traffic over cold acquisition.
Strategic Implications and Official Industry Reactions
Industry experts and marketing technologists have reacted to these findings by emphasizing the need for "cognitive ease" in digital design. The analysis of top-performing pages reveals a direct correlation between reading level and conversion success. Pages written at a 5th-to-7th-grade reading level convert at a median of 11.1%, while those utilizing "professional" or jargon-heavy language (9th grade and above) see conversion rates drop by more than 50%.
Marketers are being urged to move away from "vanity metrics" and focus on the alignment of visitor intent with the offer. The high conversion rates seen in the entertainment sector—specifically sweepstakes pages, which boast a 47.5% median—demonstrate that when the friction is low and the "ask" is simple (e.g., an email address for a prize), conversion potential is maximized. However, for SaaS and E-commerce, the focus is shifting toward "Trust Signals" and social proof.
Five Core Pillars of Modern Conversion Rate Optimization (CRO)
Based on the 2024 benchmarks, analysts have identified five actionable strategies for businesses seeking to move from the median to the top quartile of performance:
- Radical Simplification of Copy: Reducing the complexity of the value proposition to ensure it is digestible within seconds. By targeting a middle-school reading level, brands can lower the "cognitive load" on the visitor, leading to faster decision-making.
- Aggressive A/B Testing of Form Friction: Data shows that every additional form field can negatively impact conversion. Top performers are increasingly using multi-step forms or "social sign-on" to reduce the physical effort required to convert.
- Strategic Placement of Social Proof: Testimonials and trust badges are most effective when placed in close proximity to the Call to Action (CTA), rather than relegated to the footer. This provides a final "nudge" of confidence at the moment of decision.
- Mobile-First Technical Audits: Given that the vast majority of traffic is mobile, pages must be optimized for "thumb-friendly" navigation and rapid load times. A delay of even one second in mobile load time can result in a 7% reduction in conversions.
- Elimination of Navigation Leaks: High-converting landing pages act as a "cul-de-sac" with only one way out: the conversion. Removing top-level navigation menus and external links prevents "leakage" where users wander away from the primary goal.
Broader Economic Impact and Future Outlook
The implications of these benchmarks extend beyond individual marketing departments to the broader digital economy. As the cost per click (CPC) on major advertising platforms continues to rise, the ability to increase conversion rates from 4% to 6% can represent the difference between a profitable venture and a failed business model.
In the e-commerce sector alone, moving a page from the median (4.2%) to the 75th percentile (11.4%) for a site with 10,000 monthly visitors can result in hundreds of thousands of dollars in additional annual revenue without increasing the advertising budget. As artificial intelligence begins to play a larger role in dynamic landing page optimization—automatically adjusting copy and layout based on individual user profiles—the gap between those who utilize data-driven benchmarks and those who rely on intuition is expected to widen.
The 2024 Conversion Benchmark Report confirms that while the digital space is more crowded than ever, the opportunity for growth remains substantial for those who prioritize user experience, channel-specific strategy, and constant iterative testing. For the remainder of the year and into 2025, the focus for global marketers will remain on bridging the gap between average performance and the high-efficiency standards set by the industry’s top performers.