


The practice of forecasting the impact of conversion rate optimization (CRO) experiments on future revenue remains one of the most debated topics within the digital marketing and data science communities. While the promise of a "10% lift" suggests a straightforward correlation to a 10% increase in monthly recurring revenue, practitioners often find that these laboratory-style results do not always translate perfectly into real-world financial gains. This discrepancy stems from a multitude of variables ranging from statistical noise and external market shifts to the inherent limitations of predictive modeling. To bridge this gap, organizations must adopt a more rigorous, conservative, and statistically sound approach to revenue projection, treating it not as a definitive prophecy but as a sophisticated business model.

The Statistical Foundation of Causality
A credible revenue forecast begins with the integrity of the data being fed into the model. In the realm of experimentation, randomized controlled trials—commonly known as A/B testing—are considered the gold standard for proving causality. By isolating a single variable and comparing a variant against a control group, businesses can determine whether a change in user behavior is the direct result of an optimization or merely a coincidence.
However, the transition from a statistically significant test result to a revenue projection requires a robust understanding of statistical power. Many organizations fall into the trap of "peeking" at results early or ending tests before they have reached an adequate sample size, leading to Type I errors (false positives). To ensure a forecast is reliable, an experiment must reach a predetermined level of significance—typically 95%—and possess enough statistical power to detect the minimum detectable effect (MDE). Without these safeguards, any revenue projection built upon the results is essentially speculative.

The Pre/Post Comparison Pitfall
One of the primary reasons A/B testing is favored over longitudinal or "pre/post" analysis is the volatility of the digital environment. In a pre/post scenario, a marketer might implement a change in February and compare the revenue to January. If revenue increases by 10%, the change is credited. However, this method fails to account for external factors: a competitor may have shuttered their business, the ad budget might have doubled, or a seasonal holiday could have driven a natural spike in traffic.
Conversely, if performance drops by 10% due to an economic downturn but the implemented change actually improved the conversion rate by 10%, a pre/post analysis would show a flat result, leading the team to believe the experiment failed. A/B testing eliminates these variables by ensuring that both the control and the variant are subjected to the same external conditions simultaneously.
The Necessity of Conservative Forecasting
In the high-stakes environment of corporate reporting, there is a natural temptation to present the most optimistic figures. Case studies frequently claim that a single minor tweak—such as changing a button color or a headline—resulted in millions of dollars in additional annual revenue. While these "home run" scenarios exist, they are rarely sustainable or representative of the average optimization program.
Professional analysts argue for a "conservative" approach to prevent the erosion of trust between the optimization team and executive stakeholders. There are three primary technical reasons why a raw lift percentage should not be applied directly to annual revenue:
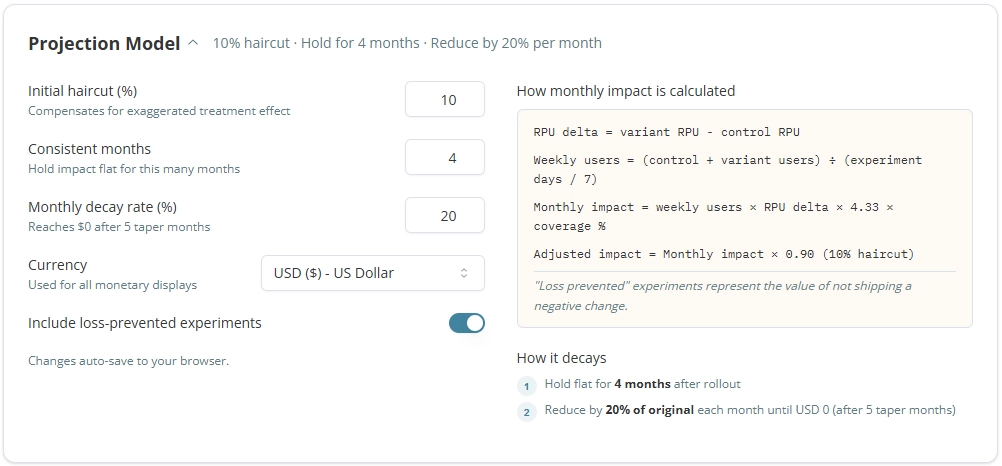
- The "Haircut" (Regression to the Mean): Test results often show an exaggerated lift due to the specific conditions of the test period. Applying a "haircut"—a standard reduction of the observed lift (often by 10% to 20%)—accounts for the likelihood that the long-term effect will be slightly lower than the initial peak.
- The Exposure Factor: Not every user who visits a site will be exposed to the change. If an experiment is conducted on the checkout page, but only 20% of site visitors reach that page, the 10% lift applies only to that 20% segment, not the total site traffic.
- The Decay Rate: The impact of a winning experiment is rarely permanent. Consumer preferences shift, competitors react, and the "novelty effect" wears off. A realistic model must account for the gradual decline of an experiment’s effectiveness over time, often modeled as a monthly percentage reduction.
Political Implications and Executive Expectations
Beyond the mathematics, revenue forecasting is a tool for internal communication. For CRO practitioners, the goal is to demonstrate value without overpromising. If a team forecasts $5 million in gains and the company only sees $1 million, the entire testing program may be viewed as a failure, regardless of the actual progress made.
By utilizing conservative estimates, teams can "under-promise and over-deliver." This strategy builds long-term credibility with CFOs and CEOs who are accustomed to seeing marketing departments present inflated "vanity metrics." When the projected revenue is grounded in a transparent model with explicit assumptions, it becomes a defensible business case rather than a marketing claim.
A Step-by-Step Methodology for Revenue Calculation
To move from an experiment result to a formal revenue projection, analysts follow a structured calculation process. This ensures that every "win" is quantified using the same logic.
First, the analyst determines the "Lift per User." This is calculated by taking the Revenue Per User (RPU) of the variant and subtracting the RPU of the control. For example, if the control RPU is $5.00 and the variant RPU is $5.50, the lift is $0.50 per user.

Second, the lift is multiplied by the number of monthly users expected to be exposed to the change. If the change is implemented sitewide, this might be the total monthly traffic. If it is restricted to a specific category, only that category’s traffic is used.
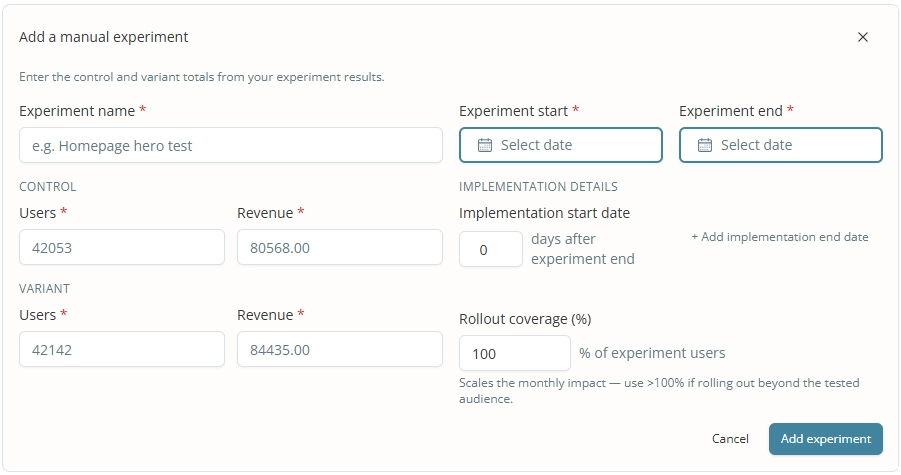
Third, the "Rollout Coverage" is applied. This factor adjusts for the scale of implementation. If a test was run on a single product page but the winning change will be applied to all 500 product pages, the coverage factor would increase significantly. Conversely, if the change is only rolled out to a specific segment of users, the coverage is reduced.
Finally, the cumulative impact is modeled over a set duration, such as 12 months, incorporating a "steady state" period followed by a "decay" period. This provides a total projected dollar value that can be tracked against actual performance.
Integrating ROI: The Cost of Experimentation
Revenue projections only represent one side of the ledger. To provide a true picture of a CRO program’s health, these gains must be weighed against the cost of investment. This includes:
- Labor Costs: The salaries of developers, data scientists, and UX designers dedicated to the program.
- Tooling: Subscription costs for A/B testing platforms (such as Convert or Optimizely), analytics suites, and heatmapping tools.
- Engineering Opportunity Cost: The time spent building and implementing experiments is time not spent on other features.
By comparing the projected revenue gains against these costs, organizations can calculate the Return on Investment (ROI). A healthy program typically aims for a 3:1 or 5:1 ratio, ensuring that for every dollar spent on experimentation, the company realizes several dollars in incremental revenue.
The Role of Specialized Analytics Tools
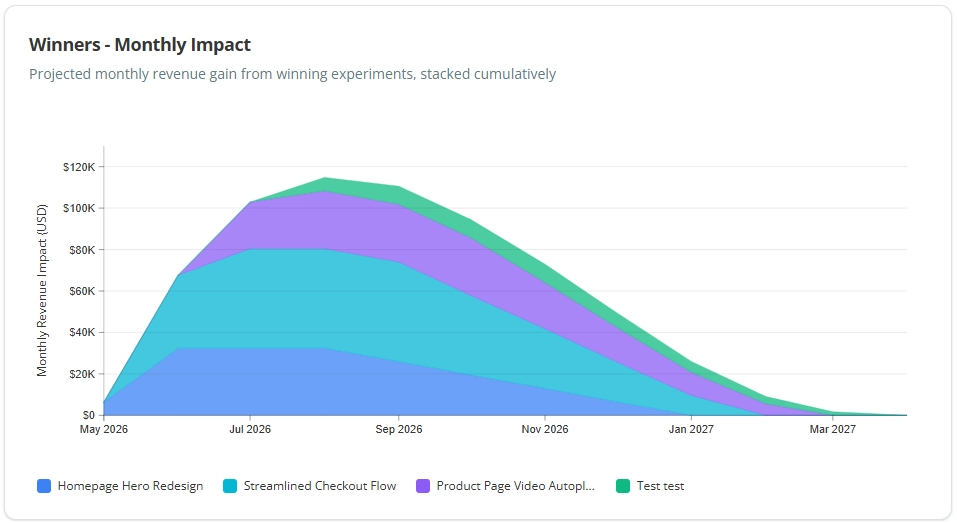
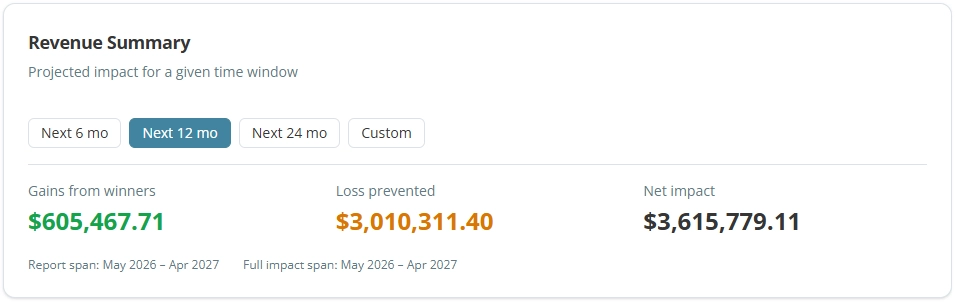
As the complexity of these models grows, many organizations are moving away from manual spreadsheets in favor of specialized experimentation analytics tools like Katsed. these platforms automate the stacking of results, allowing teams to see how multiple winning experiments contribute to revenue cumulatively.
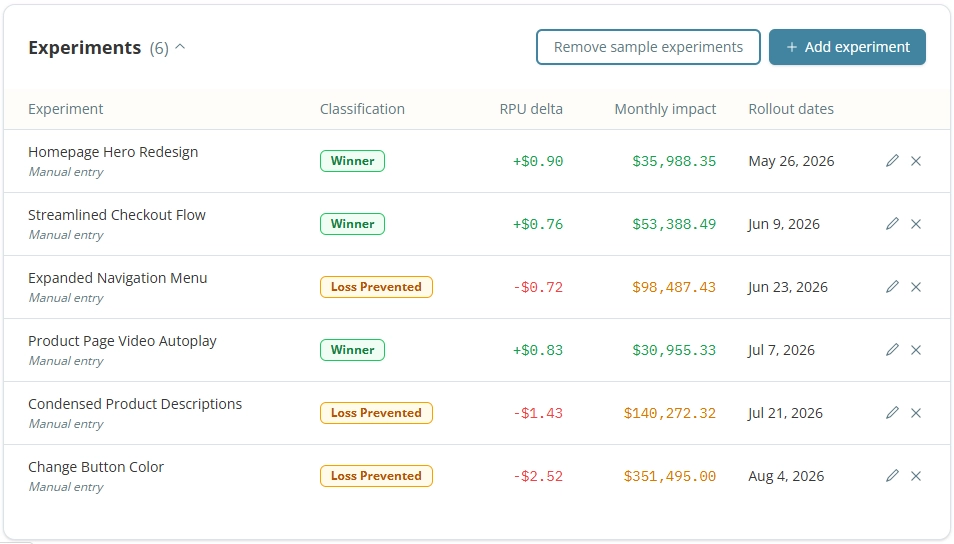
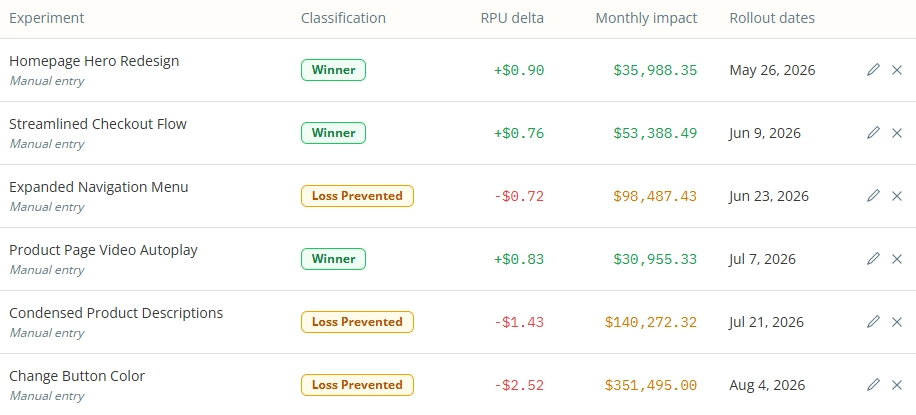
These tools also allow for "Loss Prevention" reporting. In cases where an experiment shows a negative result, the "win" is the revenue saved by not implementing a change that would have hurt the bottom line. While harder to explain to some executives, loss prevention is a critical component of a program’s total economic impact.
Conclusion: Embracing the Model, Acknowledging the Uncertainty
Forecasting revenue from CRO is not an exact science, but it is an essential discipline for the modern data-driven enterprise. The primary value of a revenue forecast lies not in its ability to predict the future with 100% accuracy, but in its ability to provide a consistent framework for decision-making.

When practitioners accept that these projections are models—and that all models are simplifications of reality—they can focus on the quality of the inputs. By maintaining statistical rigor, applying conservative "haircuts," and accounting for the natural decay of results, the CRO industry can provide the C-suite with the financial clarity required to justify continued investment in experimentation. Ultimately, a well-constructed forecast transforms CRO from a series of isolated tests into a strategic engine for sustainable business growth.







