In the dynamic and ever-evolving landscape of digital marketing, discerning the true value of social media performance metrics, such as a seemingly modest count of 100 likes, necessitates a robust framework for comparison. This is precisely where social media benchmarks become indispensable. These industry standards provide critical context, illustrating what constitutes typical performance for key metrics like engagement rates, audience growth, and content reach within specific sectors. By aligning individual brand results against these established benchmarks, organizations can move beyond isolated data points to gain a comprehensive understanding of their standing relative to competitors and broader industry trends.
Social media benchmarks serve as a vital compass for strategic planning, offering a data-driven perspective on performance that mere internal tracking cannot fully provide. While monitoring a brand’s own social trajectory over time is valuable, external benchmarks reveal how effectively a brand is leveraging its social presence compared to its peers. This contextualization is crucial for identifying areas of strength, pinpointing opportunities for improvement, and validating the efficacy of ongoing social media initiatives. Furthermore, benchmarks are instrumental in setting realistic and ambitious goals, acknowledging that performance expectations can vary significantly across diverse industries. For instance, entertainment brands typically experience higher engagement rates than healthcare organizations due to inherent differences in content and audience interaction patterns. Understanding these industry-specific nuances allows social media teams to define achievable targets, preventing burnout from unrealistic expectations while still striving for optimal results.
Navigating the Benchmarking Landscape with Advanced Analytics
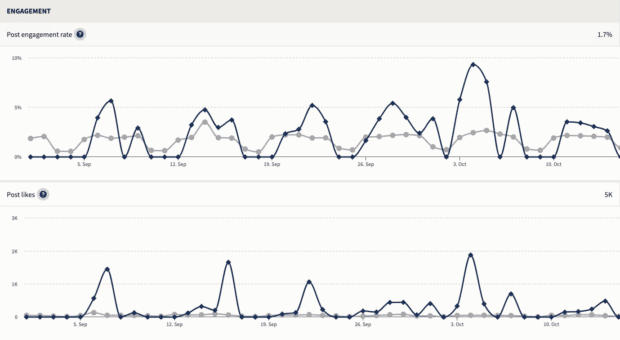
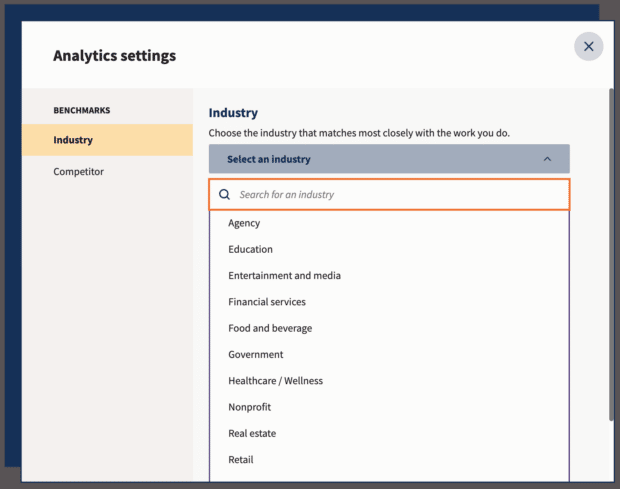
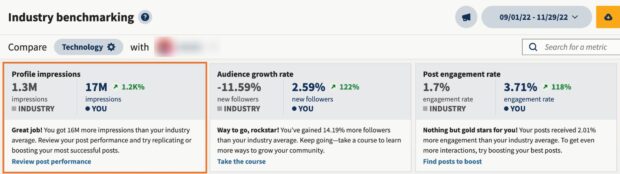
The process of manually collecting and analyzing reliable social media benchmarks can be both time-consuming and prone to inconsistencies. Recognizing this challenge, leading social media management platforms have integrated sophisticated benchmarking tools to streamline the process. Hootsuite Analytics, for example, offers a built-in feature that allows users to effortlessly compare their social media performance against industry averages. Within the platform’s "Analytics" section, users can select "Benchmarking" and then choose their relevant industry category. This provides immediate access to comparative data across a spectrum of crucial metrics, including engagement rates, reach, follower growth, clicks, shares, and video views. The tool further enhances its utility by allowing customization of timeframes and enabling comparisons across major social media platforms such, as Instagram, Facebook, X (formerly Twitter), LinkedIn, and TikTok. Beyond mere data presentation, Hootsuite Analytics offers actionable recommendations to improve performance based on these comparative insights, and reports can be easily exported as PDFs for stakeholder presentations, ensuring transparent and data-backed communication of social media ROI.
Industry-Specific Performance Insights
A detailed analysis of recent social media benchmarks reveals distinct patterns and optimal strategies across various sectors:
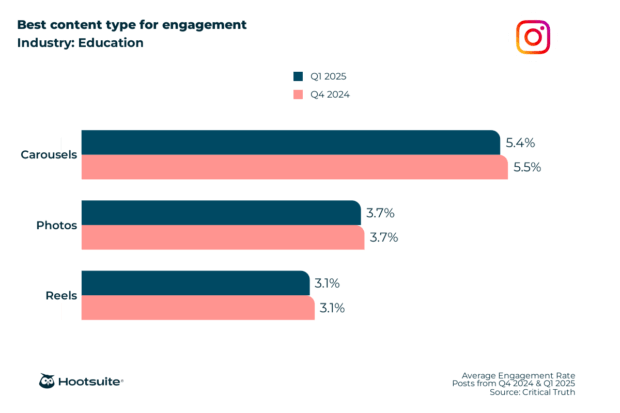
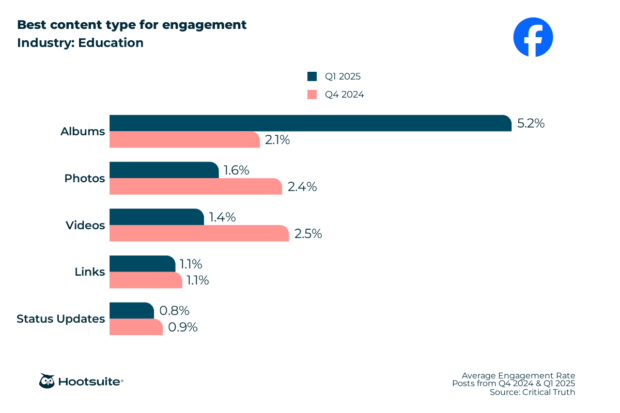
Education Industry Benchmarks:
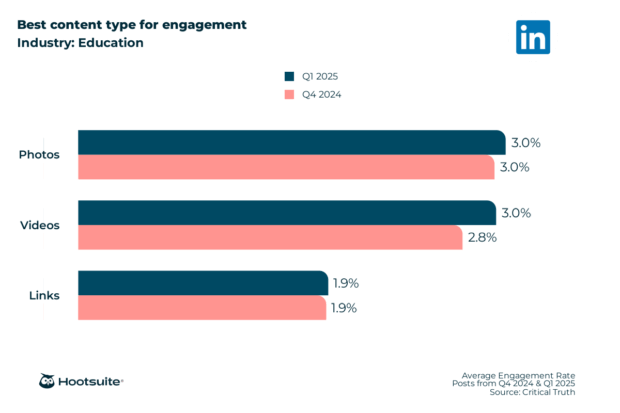
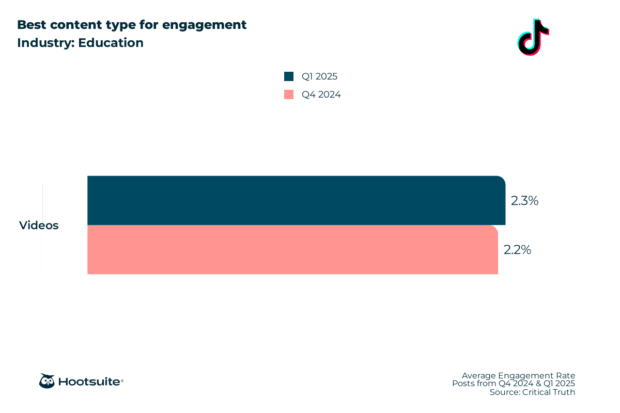
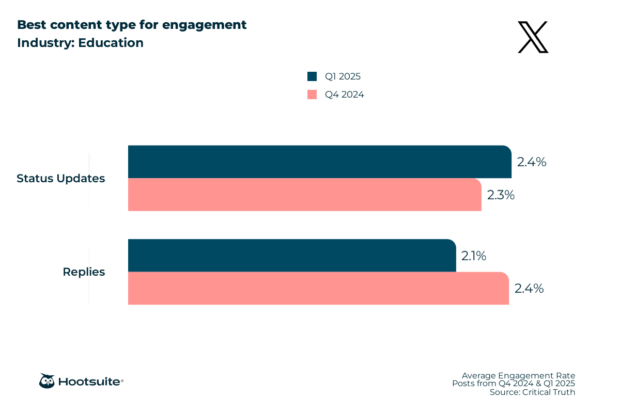
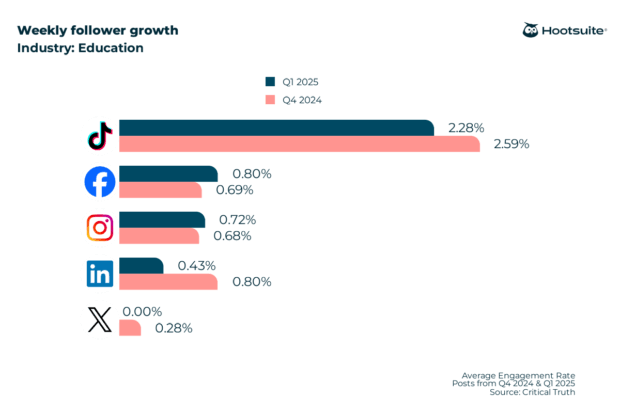
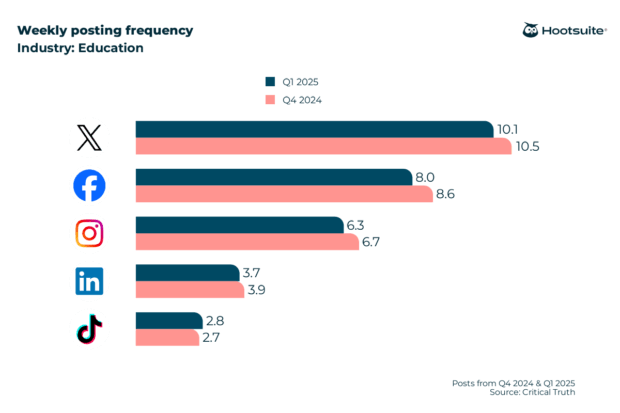
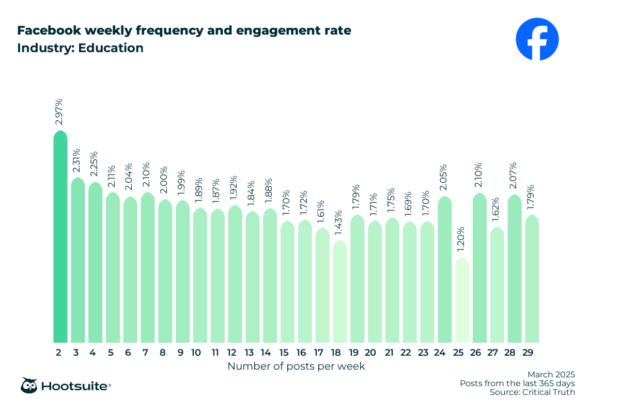
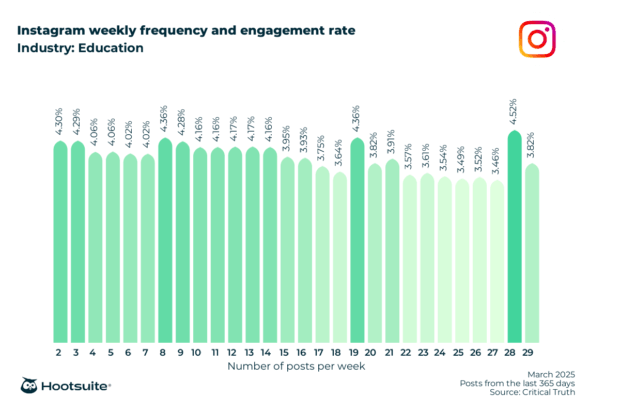
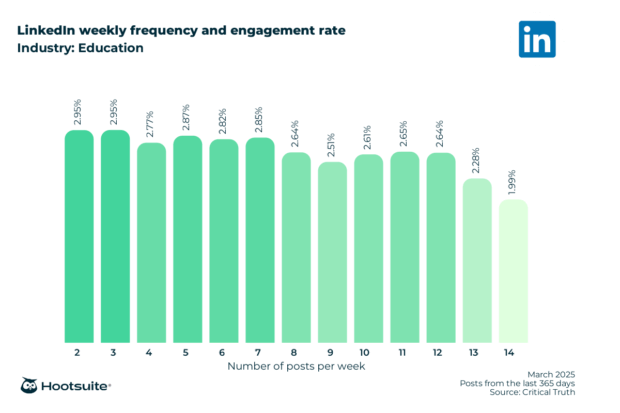
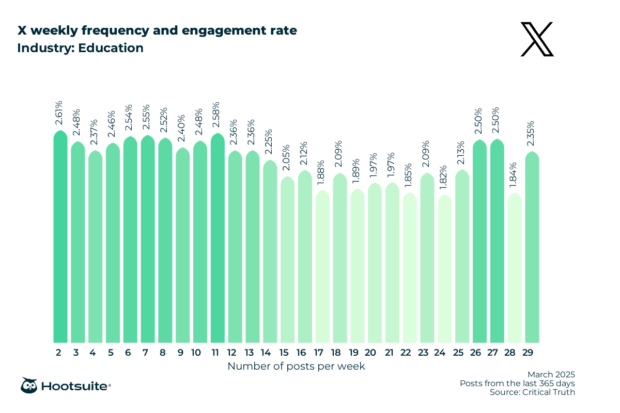
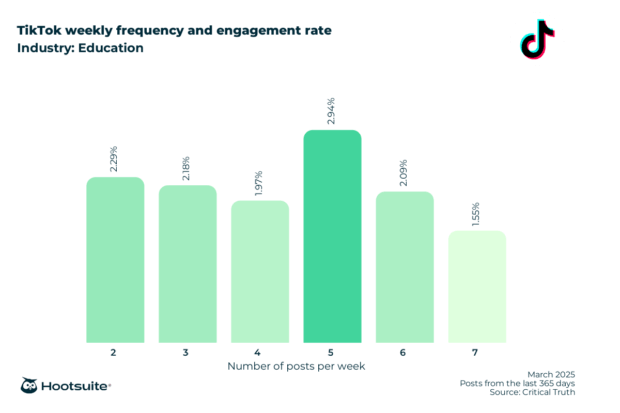
Educational institutions demonstrate strong engagement with visual content. On Facebook, photo albums lead with a 5.2% engagement rate, indicating that multi-image posts resonate well. Instagram carousels, offering an interactive and visually rich format, are the top performers with a 5.4% engagement rate. LinkedIn sees equal success for photos and videos at 3.0%, underscoring the platform’s professional visual appeal. TikTok, predictably, is dominated by videos, achieving a 2.3% engagement rate. For X (Twitter), concise status updates are most effective at 2.4%. In terms of growth, TikTok leads significantly with an average weekly follower growth of 2.28%, highlighting its potential for expanding educational reach among younger demographics. While the industry averages 10.1 posts per week on X (Twitter), optimal engagement on Facebook is achieved with just two posts per week (2.97%). Instagram thrives on higher frequency, with 28 posts per week yielding a 4.52% engagement rate. LinkedIn performs best with 2-3 posts weekly (2.95% engagement), X (Twitter) with two posts (2.61%), and TikTok with five posts weekly (2.94%). These findings suggest that educational brands should prioritize visual storytelling and tailor posting frequency to each platform’s unique audience behavior.
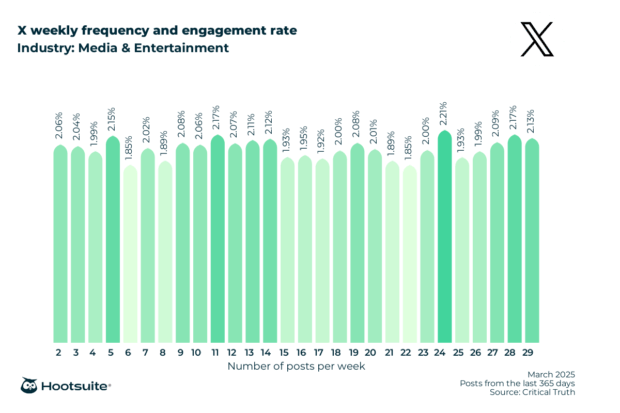
Entertainment and Media Industry Benchmarks:
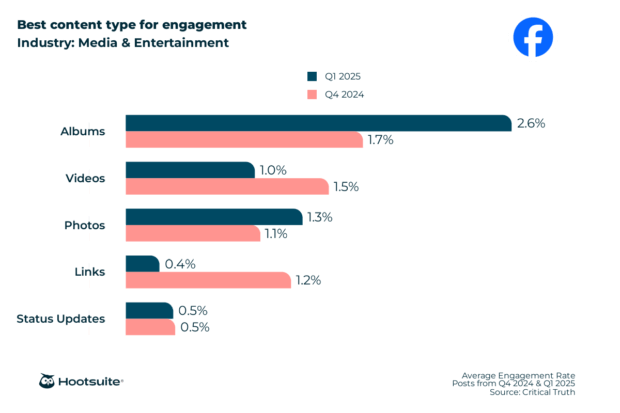
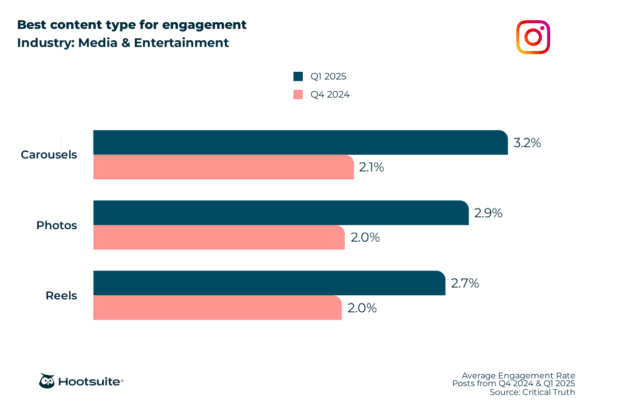
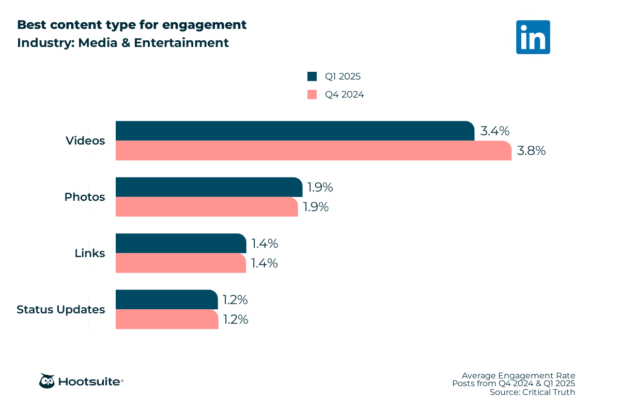
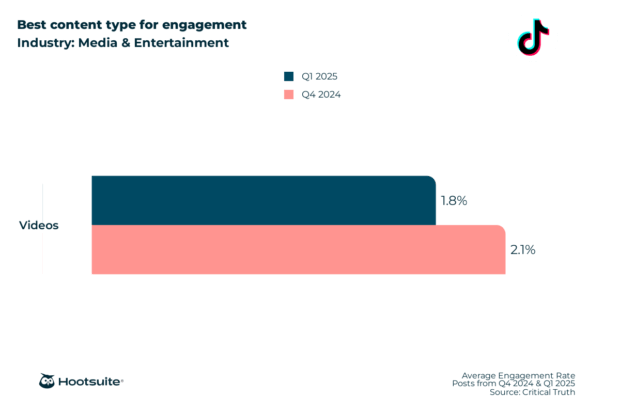
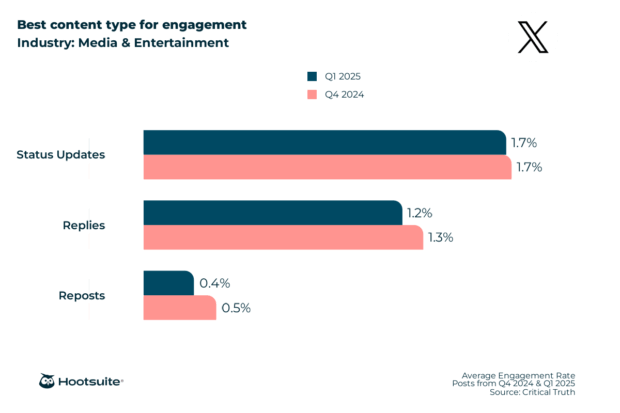
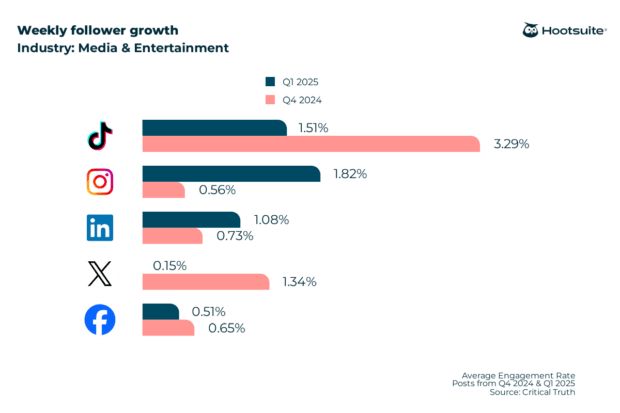
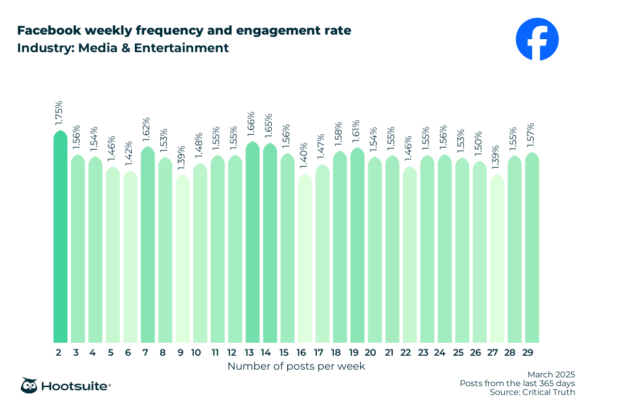
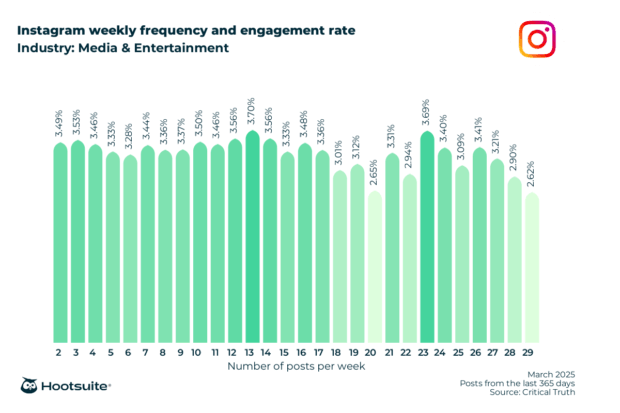
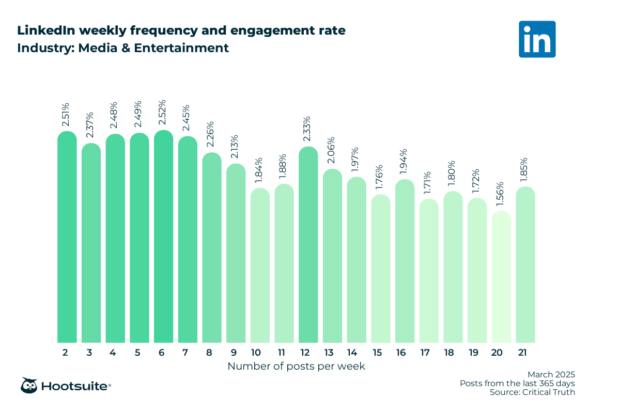
This sector naturally leans into dynamic content. Facebook albums perform best with a 2.6% engagement rate. Instagram carousels lead at 3.2%, with Reels closely following at 2.7%, emphasizing the platform’s visual and short-form video dominance. Videos are the most engaging content type on LinkedIn (3.4%) and TikTok (1.8%), reflecting audience preference for multimedia experiences. On X (Twitter), status updates garner the highest engagement at 1.7%. Instagram exhibits the highest weekly follower growth at 1.82%, making it a prime platform for audience expansion. The industry posts most frequently on Facebook, averaging 10.8 times weekly. Optimal engagement on Facebook is achieved with two posts per week (1.75%), while Instagram benefits from a higher frequency of 13 posts (3.70%). LinkedIn also sees peak engagement with two posts per week (2.51%). X (Twitter) commands a very high posting frequency for optimal engagement, with 24 posts per week yielding 2.21%. TikTok achieves its best engagement with 10 posts weekly (1.81%).
Financial Services Industry Benchmarks:
The financial services sector, often perceived as conservative, still finds success with visual and informative content. Facebook albums secure the highest engagement at 2.4%. Instagram carousels excel with a 4.1% engagement rate, potentially due to their ability to convey complex information in digestible, multi-slide formats. On LinkedIn, both photos and videos perform equally well at 3.3%, indicating a professional audience receptive to diverse visual content. Instagram boasts the highest weekly follower growth at 2.26%, making it a valuable platform for brand building. Financial services brands post most frequently on Facebook, averaging 5.9 times per week. For highest engagement, Facebook posts twice weekly (2.12%), Instagram 26 times weekly (4.64%), LinkedIn twice weekly (3.44%), X (Twitter) twice weekly (2.06%), and TikTok four times weekly (1.58%). This suggests a need for balanced content that is both informative and visually appealing, coupled with strategic posting frequencies.
Dining, Hospitality, and Tourism Industry Benchmarks:
Visual appeal and experiential content are paramount here. Facebook albums perform best at 2.4%. Instagram carousels, ideal for showcasing multiple aspects of a destination or dining experience, achieve the highest engagement at 3.7%. Videos are dominant on LinkedIn (4.5%) and TikTok (1.3%). On X (Twitter), both replies and status updates are equally effective at 2.0%. TikTok leads significantly in weekly follower growth at 18.75%, underscoring its immense potential for viral marketing in this industry. Brands in this sector post frequently on Facebook (9.9 times weekly) and Instagram (11.9 times weekly). Highest engagement on Facebook is achieved with 17 posts weekly (1.58%), while Instagram surprisingly performs best with only two posts weekly (3.52%). X (Twitter) sees peak engagement with 8 or 10 posts weekly (2.14%), and TikTok with two posts weekly (1.36%). These benchmarks emphasize the importance of high-quality visual content and understanding platform-specific engagement drivers.
Government-Related Services Industry Benchmarks:
For government entities, clear and accessible information is key. Facebook albums yield the highest engagement at 3.6%. Instagram carousels lead at 5.0%, suggesting an effective way to communicate multi-faceted public information. Photos are the best performing content type on LinkedIn (2.8%). Videos lead on TikTok (1.6%), and status updates are most effective on X (Twitter) at 1.8%. Instagram registers the highest weekly follower growth at 2.17%. This sector posts most frequently on Facebook, averaging 16.1 times weekly. Optimal engagement on Facebook is achieved with two posts weekly (2.32%), LinkedIn with three posts weekly (2.80%), and X (Twitter) with two posts weekly (2.03%). These findings suggest that public sector organizations can foster greater citizen engagement through strategic visual communication and consistent, yet not overwhelming, posting.
Healthcare Industry Benchmarks:
The healthcare sector benefits from informative and trustworthy content. Facebook albums show the highest engagement at 3.8%. Instagram carousels lead at 4.5%, proving effective for conveying health tips or multi-step information. Photos are most engaging on LinkedIn (3.4%). Videos perform best on TikTok (1.0%). Status updates are most effective on X (Twitter) at 2.3%. Facebook boasts an impressive weekly follower growth of 10.11%, indicating its strong role in community engagement and information dissemination for healthcare. Healthcare brands post most frequently on Facebook, averaging 11.4 times weekly. For optimal engagement, Facebook performs best with two posts weekly (2.22%), Instagram with two posts weekly (3.89%), LinkedIn with 20 posts weekly (3.61%), X (Twitter) with 28 posts weekly (2.65%), and TikTok with seven posts weekly (1.03%).
Real Estate, Legal, and Professional Industries Benchmarks:
These professional services benefit from showcasing expertise and visual property/client success stories. Facebook albums lead with a 2.9% engagement rate. Instagram carousels are most effective at 4.1%, ideal for showcasing property listings or client testimonials. Videos are the top performers on LinkedIn at 4.0%. TikTok shows the highest weekly follower growth at 1.62%, indicating an emerging platform for these industries. Professional industries post most frequently on Facebook (11.6 times weekly) and X (Twitter) (10.2 times weekly). Optimal engagement on Facebook is achieved with two posts weekly (2.09%), Instagram with two posts weekly (4.23%), LinkedIn with two posts weekly (3.36%), X (Twitter) with three posts weekly (1.88%), and TikTok with three posts weekly (0.95%).
Retail Industry Benchmarks:
The retail sector thrives on product visibility and trend showcasing. Facebook albums garner the highest engagement at 1.9%. Instagram carousels lead at 3.6%, perfect for displaying product ranges or outfit ideas. Videos are most engaging on LinkedIn (4.3%) and TikTok (1.6%). Status updates are most effective on X (Twitter) at 1.7%. Facebook shows the highest weekly follower growth at 2.43%, emphasizing its role in customer loyalty and community building. Retail brands post most frequently on Facebook, averaging 9.0 times weekly. Optimal engagement on Facebook is achieved with 18 posts weekly (1.54%), Instagram with 25 posts weekly (3.66%), LinkedIn with 15 posts weekly (4.15%), X (Twitter) with eight posts weekly (1.88%), and TikTok with 4-5 posts weekly (1.74%).
Construction, Mining, and Manufacturing Industry Benchmarks:
For heavy industries, visual proof of work and project updates are crucial. Facebook albums lead with 2.8% engagement. Instagram carousels are highly effective at 5.2%, allowing for detailed visual storytelling of projects. Videos and photos perform equally well on LinkedIn at 4.0%. Videos are also the top performers on TikTok at 2.6%. Status updates are most effective on X (Twitter) at 2.4%. TikTok and Instagram share the highest weekly follower growth rate at 1.71%, highlighting the growing visual demand for these industries. This sector posts most frequently on Facebook, averaging 7.9 times weekly. Optimal engagement on Facebook is achieved with two posts weekly (2.31%), Instagram with 28 posts weekly (5.02%), LinkedIn with 2 or 20 posts weekly (4.13%), X (Twitter) with two posts weekly (2.58%), and TikTok with three posts weekly (2.60%).
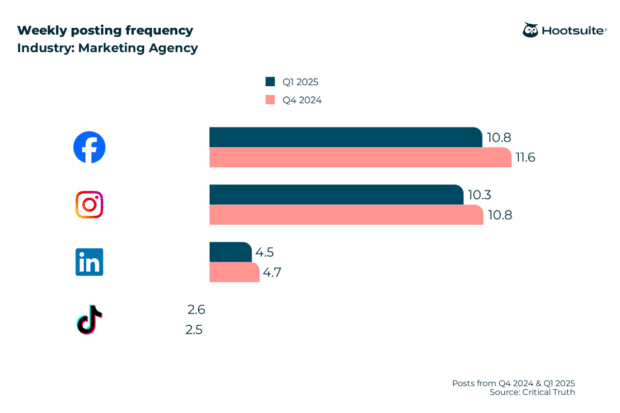
Marketing Agencies Industry Benchmarks:
Marketing agencies, by nature, should exhibit strong social media acumen. Facebook albums perform best at 2.2%. Instagram carousels lead at 3.7%, ideal for showcasing case studies or multi-tip content. Videos are most effective on LinkedIn at 4.7% and TikTok at 0.7%. Status updates lead on X (Twitter) at 1.7%. While follower growth rates are generally positive across platforms, marketing agencies post frequently on Facebook (10.8 times weekly) and Instagram (10.3 times weekly). For peak engagement, Facebook performs best with two posts weekly (2.08%), Instagram with two posts weekly (4.00%), LinkedIn with 19 posts weekly (4.02%), X (Twitter) with nine posts weekly (2.09%), and TikTok with six posts weekly (0.88%).
Nonprofit Industry Benchmarks:
Nonprofits rely on emotional connection and community building. Facebook albums achieve the highest engagement at 3.0%. Instagram carousels are highly effective at 5.5%, suitable for sharing stories, impact reports, or campaign details. Photos lead on LinkedIn at 3.4%. Videos perform best on TikTok at 1.3%. Replies are most effective on X (Twitter) at 2.4%. TikTok shows the highest weekly follower growth at 2.15%, indicating its power for reaching new audiences and driving awareness. Nonprofits post most frequently on Facebook, averaging 9.5 times weekly. Optimal engagement on Facebook is achieved with two posts weekly (2.36%), Instagram with 25 posts weekly (4.95%), LinkedIn with two posts weekly (3.58%), X (Twitter) with 2 or 24 posts weekly (2.44%), and TikTok with three posts weekly (1.67%).
Technology Industry Benchmarks:
The tech sector often leverages innovation and product showcases. Facebook albums perform best at 1.8%. Instagram carousels lead at 4.2%, useful for demonstrating product features or sharing industry insights. Videos are most engaging on LinkedIn at 3.9% and TikTok at 0.7%. Replies are most effective on X (Twitter) at 2.5%. Facebook shows an exceptionally high weekly follower growth rate of 199.09%, highlighting its potential for rapid audience expansion in this sector. The technology industry posts most frequently on Instagram, averaging 12.1 times weekly. For optimal engagement, Facebook performs best with 25 posts weekly (1.67%), Instagram with 18 posts weekly (3.57%), LinkedIn with two posts weekly (3.72%), X (Twitter) with 19 posts weekly (2.59%), and TikTok with three posts weekly (0.74%).
Utilities and Energy Industry Benchmarks:
This sector often focuses on public service announcements and corporate responsibility. Facebook albums lead with 3.2% engagement. Instagram carousels are most effective at 5.5%, potentially for explaining complex services or safety information visually. Videos and photos perform equally well on LinkedIn at 3.4%. Status updates are most effective on X (Twitter) at 2.4%. LinkedIn records the highest weekly follower growth at 1.12%, suggesting its importance for professional networking and corporate communications. This industry posts most frequently on Facebook, averaging 4.8 times weekly. Optimal engagement on Facebook is achieved with two posts weekly (2.24%), Instagram with two posts weekly (3.95%), LinkedIn with 10 posts weekly (3.74%), X (Twitter) with 10 posts weekly (2.60%), and TikTok with five posts weekly (0.85%).
Overall Social Media Trends:
Across all industries, key patterns emerge. Photo albums generally perform best on Facebook (2.9% average engagement), indicating that multi-image posts continue to capture audience attention. Instagram carousels consistently lead with an average engagement rate of 4.2%, demonstrating their versatility for various content types. On LinkedIn, videos are the top content type, achieving an average engagement of 3.9%, underscoring the platform’s professional multimedia consumption. TikTok is overwhelmingly a video-first platform, with videos driving 1.5% average engagement. For X (Twitter), status updates, including short text and single images, are the most effective, averaging 1.8% engagement.
Regarding follower growth, TikTok stands out dramatically with an overall average weekly follower growth rate of 197.37%, positioning it as the premier platform for rapid audience expansion. Facebook also shows strong growth potential, especially in certain sectors like technology. In terms of posting frequency, X (Twitter) sees the highest overall average, with industries posting an average of 18.1 times per week. However, this high frequency doesn’t always correlate with optimal engagement. Across platforms, the data suggests that lower, more strategic posting frequencies often yield higher engagement rates. For instance, two posts per week on Facebook (2.08% engagement), two posts on Instagram (4.04%), two posts on LinkedIn (3.56%), and two posts on X (Twitter) (2.21%) frequently lead to peak engagement. TikTok, however, appears to benefit from a slightly higher frequency, with 14 posts per week resulting in 1.71% engagement. This highlights a critical insight: quality and strategic timing often trump sheer quantity in driving meaningful interaction.
Strategic Implications for Brands
Social media benchmarks are far more than mere reporting figures; they are powerful tools for making informed decisions and refining digital strategies.
-
Understanding Performance Context: Tracking internal metrics in isolation provides a limited view. Benchmarks offer crucial industry context, revealing whether a brand’s growth rate, for instance, is lagging behind or exceeding competitors. This external validation is vital when communicating performance to stakeholders, justifying resource allocation, or advocating for new strategies. It also equips social media managers with factual data to counter unrealistic expectations, such as the often-heard request for a "viral video."
-
Setting Realistic and Attainable Goals: By understanding typical industry performance, brands can set goals that are both ambitious and achievable. This aligns with the SMART (Specific, Measurable, Achievable, Relevant, Time-bound) goal framework, ensuring targets are grounded in market realities and industry norms, rather than arbitrary aspirations.
-
Replicating Winning Strategies: Benchmarking allows brands to identify industry leaders and influential voices who consistently outperform averages. By analyzing their content types, posting frequencies, and engagement patterns—a process often facilitated by social listening tools—brands can reverse-engineer successful strategies. This involves adapting proven tactics to their own brand voice and audience, fostering innovation while minimizing trial-and-error.
-
Spotting Early Opportunities and Adapting to Trends: Benchmarks act as an early warning system. If data indicates a plateau or decline in audience growth on a specific platform across an industry, it might signal a need to reallocate resources or explore emerging channels. Conversely, a platform showing exponential growth within an industry, like TikTok’s strong performance in dining/hospitality/tourism, highlights a significant opportunity for market penetration. While benchmarks provide a guiding framework, continuous testing, experimentation, and strategic bets remain essential for staying ahead in the dynamic social media landscape.
In conclusion, leveraging social media benchmarks transforms raw data into actionable intelligence. By consistently measuring performance against industry standards and adapting strategies based on these insights, brands can optimize their social presence, achieve sustainable growth, and ultimately, demonstrate tangible value in their digital marketing efforts. The platforms and content types that drive success are not static, underscoring the need for ongoing analysis and strategic agility.