

In the competitive landscape of digital commerce, Conversion Rate Optimization (CRO) has evolved from a secondary marketing tactic into a core business strategy. CRO Key Performance Indicators (KPIs) serve as the vital quantitative benchmarks that organizations track to determine whether modifications to their digital infrastructure—ranging from headline adjustments to complete checkout overhauls—are yielding tangible business results. Without a rigorous focus on these specific figures, businesses risk operating on intuition rather than data, often leading to wasted resources and missed revenue opportunities.
The distinction between a general metric and a high-level KPI is fundamental to modern digital strategy. While a website generates an abundance of data points, including bounce rates, scroll depths, and page views, these are often categorized as "vanity metrics" or diagnostic tools. In contrast, a KPI is a metric that directly correlates with organizational objectives, such as revenue growth, lead quality, or customer retention. As digital environments transition toward privacy-first tracking and more sophisticated user journeys, the ability to align CRO goals with broader business outcomes has become the hallmark of successful digital enterprises.
The Evolution of Conversion Metrics: A Brief Chronology
The methodology for measuring website success has undergone significant transformations over the last three decades. In the late 1990s and early 2000s, "hits" and "page views" were the primary metrics of success, reflecting a nascent internet focused on reach rather than interaction. By the mid-2010s, the focus shifted toward "Conversion Rate" as the primary yardstick, facilitated by the ubiquity of Universal Analytics.
However, as the digital economy matured, organizations realized that a high conversion rate did not always equate to high profitability. This realization ushered in the current era of "Value-Based CRO," where KPIs such as Revenue Per Visitor (RPV) and Customer Lifetime Value (CLV) take precedence. With the recent industry-wide migration to Google Analytics 4 (GA4), the focus has further shifted toward "Key Events" and cross-platform user journeys, requiring marketers to be more precise in how they define and track success.
Core KPIs for Measuring Revenue and Direct Conversions
The most critical KPIs are those that reside closest to the final business outcome. These metrics provide an immediate pulse on the financial health of a digital platform.
1. Conversion Rate (CR)
The conversion rate remains the foundational KPI for most optimization programs. It is defined as the percentage of total visitors who complete a primary desired action, such as a purchase or a demo booking. The formula is straightforward: (Total Conversions / Total Visitors) x 100. According to recent industry benchmarks, the average e-commerce conversion rate fluctuates between 2% and 3%, though top-tier performers often achieve rates exceeding 5%.
2. Revenue Per Visitor (RPV)
RPV is often considered a more holistic KPI than conversion rate because it accounts for both the frequency of sales and the value of those sales. It is calculated by dividing total revenue by the total number of visitors during a specific period. This KPI is essential for understanding the true value of traffic; for instance, a site with a lower conversion rate but a much higher RPV may be more profitable than a high-conversion site selling low-margin items.
3. Average Order Value (AOV)
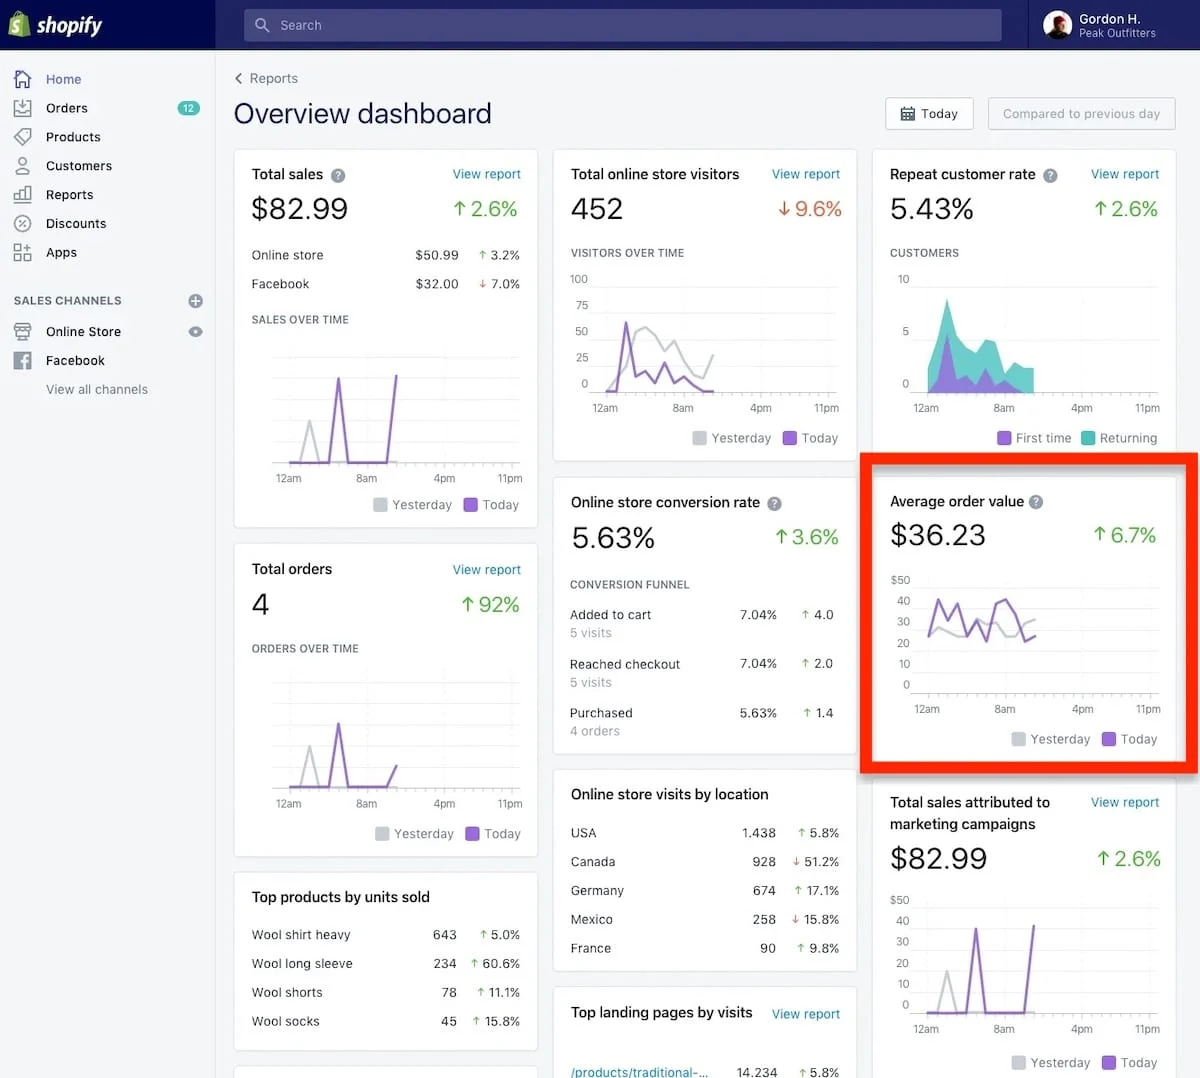
AOV measures the average dollar amount spent each time a customer places an order. This KPI is particularly sensitive to changes in pricing strategy, product bundling, and cross-selling tactics. By monitoring AOV, businesses can determine if their optimization efforts are successfully encouraging customers to purchase higher-value items or add more products to their carts.
4. Lead and Trial Conversion Rates
For B2B and SaaS organizations, the primary goal is often not an immediate sale but the generation of a qualified lead or a trial signup. Tracking the "Demo Booking Rate" or "Trial Signup Rate" allows these companies to evaluate the effectiveness of their top-of-funnel messaging. Because the final sale in these sectors often occurs offline or after a lengthy trial period, these micro-conversions serve as the leading indicators for future revenue.
Funnel Progression KPIs: Identifying and Eliminating Friction
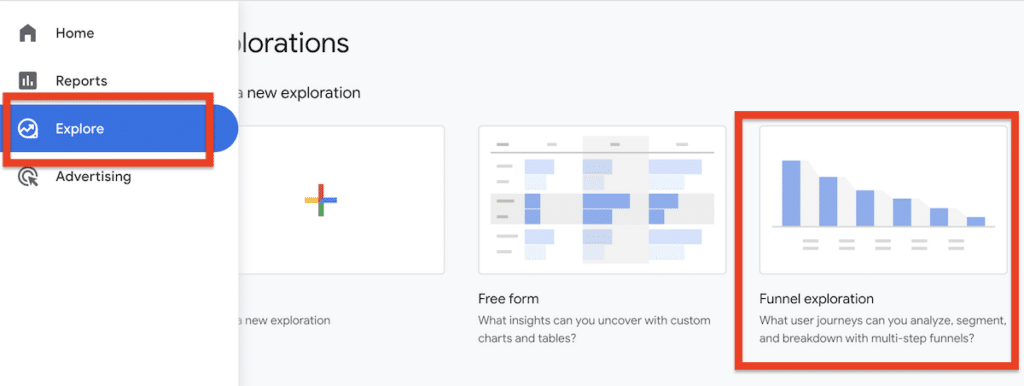
To improve the primary conversion rate, teams must look deeper into the user journey to identify where potential customers are dropping off. These diagnostic KPIs help pinpoint specific technical or psychological barriers.
5. Add-to-Cart Rate
This KPI measures the percentage of product page visitors who take the first step toward a purchase. A low add-to-cart rate typically suggests issues with the product page itself, such as poor-quality imagery, lack of social proof (reviews), or unclear pricing.
6. Cart-to-Checkout Rate
The transition from the cart to the checkout page is a high-friction moment. If users are adding items to their carts but failing to initiate the checkout process, it often indicates "sticker shock" from unexpected shipping costs or a lack of trust in the site’s security.
7. Checkout Completion Rate
Once a user begins the checkout process, the goal is to minimize distractions and technical hurdles. The checkout completion rate—calculated by dividing total purchases by checkout starts—is the ultimate measure of checkout efficiency. High abandonment at this stage is frequently linked to forced account creation, overly long forms, or a lack of preferred payment methods.
8. Form Completion Rate
In lead generation, the form is the final gatekeeper. By tracking the percentage of users who submit a form after starting it, businesses can identify "form friction." Data suggests that reducing the number of fields in a form can increase completion rates by up to 20%, though this must be balanced against the need for lead quality.
Advanced Metrics for Lead Quality and Long-term Impact
As CRO programs mature, they must move beyond volume and focus on the quality of the actions taken.
9. Qualified Lead Rate
Total lead volume can be a misleading metric if the leads do not result in sales. The Qualified Lead Rate measures the percentage of leads that meet specific criteria (Marketing Qualified Leads or Sales Qualified Leads). This ensures that the CRO team is optimizing for revenue-generating visitors rather than just "noise."
10. Customer Acquisition Cost (CAC)
While often viewed as a marketing metric, CAC is a vital guardrail for CRO. If optimization efforts increase conversion rates but significantly raise the cost of acquiring each customer (for example, through aggressive discounting), the long-term viability of the strategy may be compromised.
11. Customer Lifetime Value (CLV)
The most sophisticated CRO programs track how website changes impact the long-term value of a customer. A change that increases immediate conversion but leads to higher churn or lower repeat purchase rates is ultimately a failure. CLV provides the necessary perspective to ensure that short-term wins do not come at the expense of long-term growth.
Strategic Framework for Selecting KPIs
Selecting the right KPI for a specific test or initiative requires a structured approach. Experts suggest a four-tier framework to ensure comprehensive measurement:
- Primary KPI: The single most important number that defines the success of the test (e.g., Purchase Conversion Rate).
- Diagnostic KPIs: 2–4 metrics that help explain the "why" behind the primary KPI’s movement (e.g., Add-to-Cart Rate).
- Guardrail KPIs: 1–3 metrics used to ensure the change isn’t causing unintended damage elsewhere (e.g., ensuring a new layout doesn’t spike the bounce rate or decrease AOV).
- Segmentation: Analyzing KPIs across different segments—such as mobile vs. desktop or new vs. returning visitors—to uncover hidden insights.
Industry Implications and Expert Perspectives
The shift toward data-driven CRO has profound implications for organizational structure. Historically, marketing and product teams often operated in silos, with marketing focusing on traffic and product focusing on features. The adoption of shared CRO KPIs forces these departments to align around a single version of the truth: user behavior and business impact.
Industry analysts note that the rise of Artificial Intelligence and machine learning is further complicating the KPI landscape. AI-driven personalization can create thousands of unique user experiences, making it harder to track success using traditional aggregate numbers. Consequently, there is a growing trend toward "Propensity Scoring"—using data to predict the likelihood of a user converting—as a modern KPI.
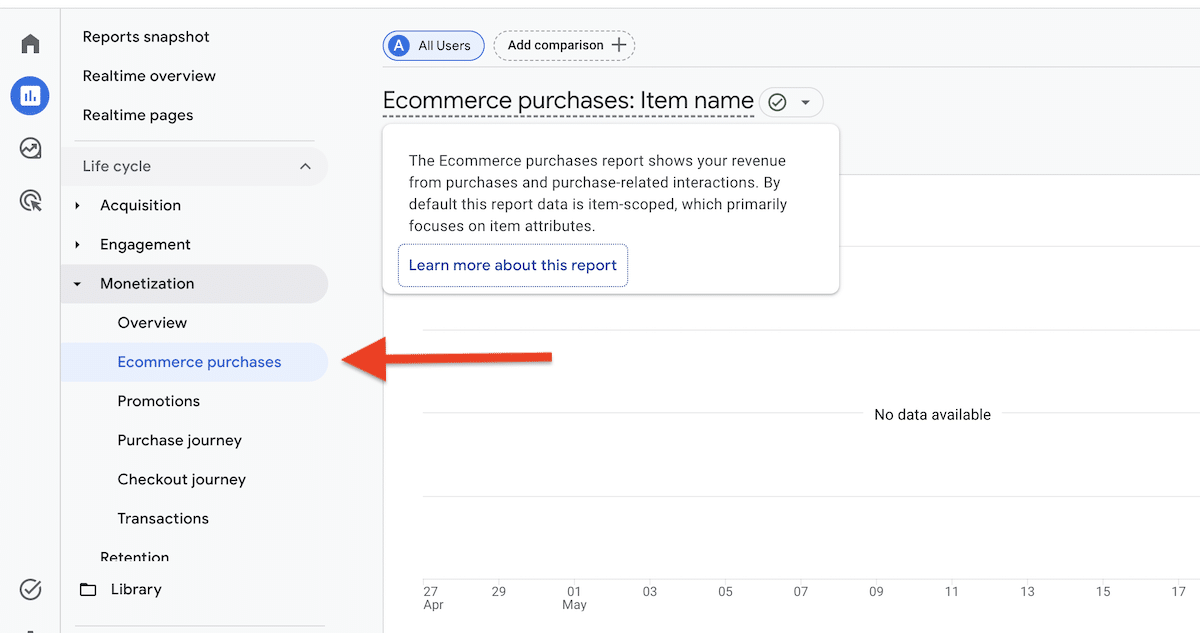
Furthermore, official responses from leading analytics platforms emphasize the importance of "Key Events." Google’s recent documentation on GA4 highlights that not every interaction should be treated equally. By marking specific events as "Key Events," businesses can focus their optimization efforts on the actions that truly drive value, rather than getting lost in a sea of irrelevant data.
Conclusion: Reporting for Stakeholder Impact
The final step in a successful CRO KPI strategy is effective reporting. To gain executive buy-in, CRO specialists must translate technical metrics into business language. When reporting to the C-suite, the focus should remain on "Outcome KPIs" like revenue growth and CAC. Conversely, when working with designers and developers, "Process KPIs" like form completion and page load speeds are more actionable.
Ultimately, CRO KPIs are more than just numbers on a dashboard; they are the roadmap for digital transformation. By meticulously selecting, tracking, and acting upon these indicators, businesses can move beyond guesswork and build a sustainable engine for growth in an increasingly volatile digital marketplace. The organizations that master this data-driven discipline will be the ones that thrive, while those relying on legacy metrics will likely find themselves left behind.







