Essential CRO KPIs: A Comprehensive Guide to Measuring Website Optimization Success are the foundational metrics that organizations utilize to determine whether iterative changes to a digital interface are yielding tangible business growth. In an era where customer acquisition costs (CAC) continue to escalate across search and social channels, Conversion Rate Optimization (CRO) has transitioned from a niche technical discipline to a core strategic imperative for modern enterprises. When a company modifies a product landing page, streamlines a multi-step form, or deploys a new checkout architecture, the success of these initiatives cannot be judged on aesthetic merit alone. Instead, stakeholders rely on specific Key Performance Indicators (KPIs) to verify if more visitors are purchasing products, if lead quality is improving, or if software-as-a-service (SaaS) trial signups are accelerating.
A robust CRO KPI must possess three distinct characteristics: it must be measurable through quantitative data, it must be directly influenced by changes made to the user experience, and it must align with high-level corporate objectives. Without these guardrails, organizations risk falling into the trap of “vanity metrics”—numbers that look impressive on a dashboard but fail to correlate with actual revenue or market share.
The Critical Distinction Between CRO Metrics and KPIs
To manage a successful optimization program, practitioners must distinguish between general metrics and specific KPIs. While all KPIs are metrics, not all metrics qualify as KPIs. General metrics, such as bounce rates, scroll depth, and individual button clicks, provide a granular view of user behavior. They are diagnostic tools that help developers and designers understand where friction exists on a page. For instance, a high drop-off rate at the “Shipping Information” stage of a checkout funnel indicates a specific UX problem that needs addressing.
In contrast, a KPI is a high-level outcome used to judge the ultimate effectiveness of a business goal. If a corporation’s primary objective for the fiscal year is to increase total annual recurring revenue (ARR), the relevant KPIs might include the purchase conversion rate or the average order value (AOV). While a metric like “time on page” might increase during an A/B test, it is only considered a success if it leads to a corresponding lift in a primary KPI.
| Category | CRO Metrics | CRO KPIs |
|---|---|---|
| Function | Behavioral tracking and problem diagnosis | Measuring business outcomes and ROI |
| Usage | Spotting where users click or drop off | Judging if a redesign or test was successful |
| Examples | Scroll depth, CTA clicks, form starts | Purchase rate, Revenue Per Visitor (RPV) |
| Stakeholders | UX Designers, Front-end Developers | Executives, Marketing Directors, Product Owners |
Primary KPIs for Revenue and Transactional Growth
For e-commerce and direct-to-consumer (DTC) brands, the most vital KPIs are those that sit closest to the point of transaction. These numbers provide the most immediate feedback on the health of the sales funnel.
1. Conversion Rate (CR)
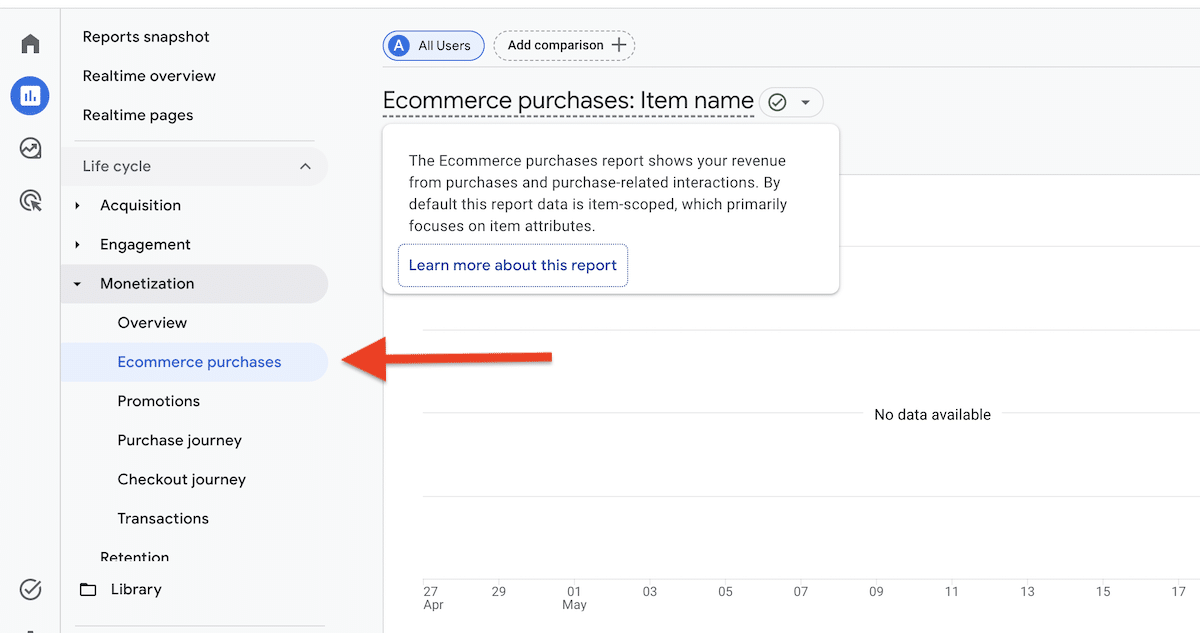
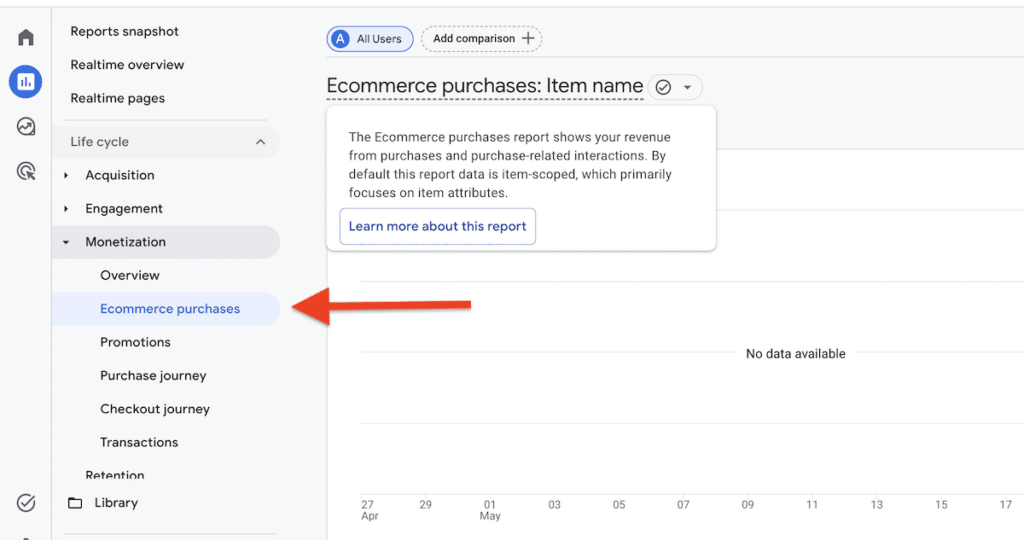
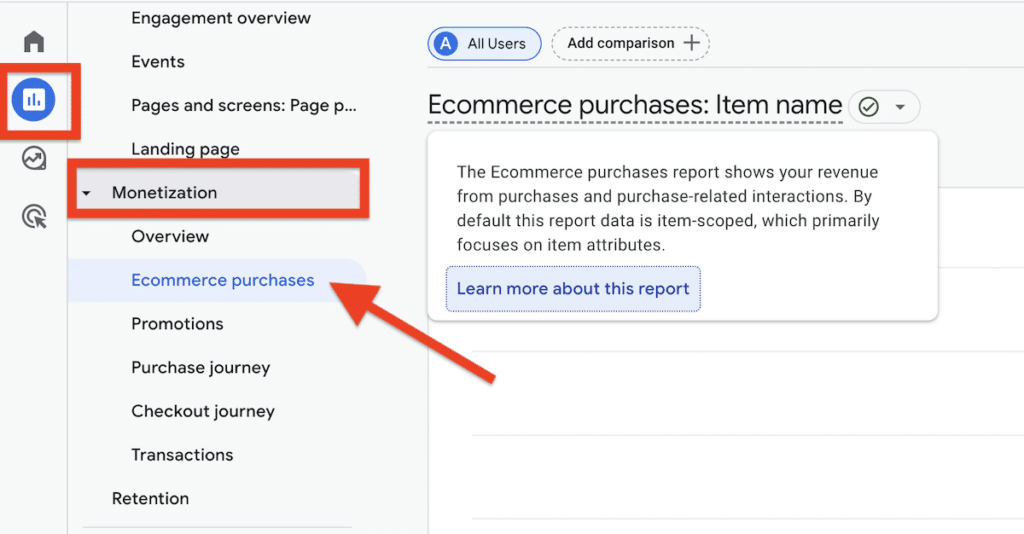
The conversion rate remains the most widely recognized KPI in the optimization industry. It represents the percentage of total visitors who complete a desired action. The formula is straightforward: (Conversions ÷ Total Visitors) × 100. According to industry benchmarks, average e-commerce conversion rates typically hover between 2% and 3%, though top-tier performers often achieve rates exceeding 5%. In modern analytics environments like Google Analytics 4 (GA4), this is tracked through “Key Events,” allowing teams to segment conversion rates by device type, traffic source, or geographic region.
2. Revenue Per Visitor (RPV)
While conversion rate measures the volume of successful actions, RPV measures the value of those actions relative to total traffic. This is calculated by dividing total revenue by total visitors. RPV is often considered a “purer” metric than conversion rate because it accounts for both the frequency of purchases and the amount spent. For example, a test might decrease the overall conversion rate but significantly increase the RPV if it encourages users to buy more expensive items.
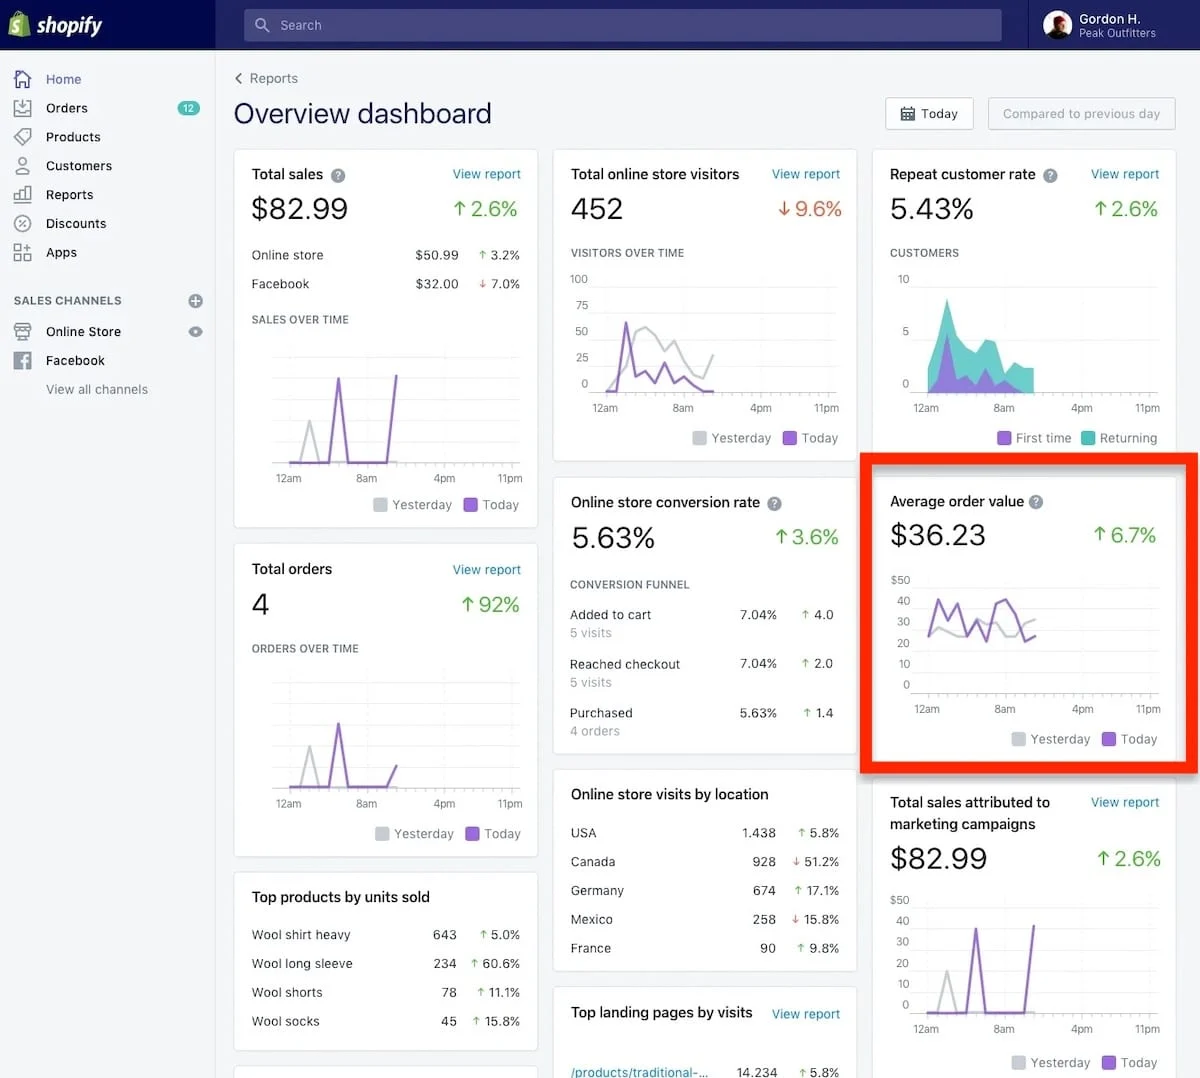
3. Average Order Value (AOV)
AOV tracks the average dollar amount spent each time a customer places an order. This KPI is essential when testing psychological triggers such as “Free Shipping” thresholds (e.g., “Spend $50 for free shipping”) or post-purchase upsells. Increasing AOV is often more cost-effective than acquiring new customers, as it maximizes the value of existing traffic.
Strategic KPIs for B2B and SaaS Lead Generation
In the B2B and SaaS sectors, the journey from visitor to customer is rarely linear. Because sales cycles can last months, purchase conversion rate is often an inadequate KPI for website optimization. Instead, teams focus on “micro-conversions” that indicate progress through the sales pipeline.
4. Lead Conversion and Demo Booking Rates
For a B2B enterprise, the website’s primary function is to generate qualified inquiries. Tracking the percentage of visitors who book a product demo or submit a “Contact Sales” form is critical. However, high-volume lead generation can be deceptive if the leads are of low quality. Consequently, sophisticated teams often integrate their website analytics with Customer Relationship Management (CRM) systems like Salesforce or HubSpot to track the “Qualified Lead Rate.”
5. Trial-to-Paid Conversion Rate
For SaaS companies offering a “freemium” or trial model, the ultimate measure of website and onboarding optimization is how many trial users transition into paying subscribers. This KPI helps product teams understand if the marketing site is attracting the right type of user and if the initial product experience delivers on the brand’s promise.

Guardrail Metrics: Protecting the Long-Term Brand
A common pitfall in CRO is “local maxima” optimization—making changes that improve a short-term KPI but damage the business in the long run. To prevent this, organizations must employ “guardrail metrics.”
One such metric is the Refund or Return Rate. A checkout optimization that uses “dark patterns” or aggressive upselling might increase AOV in the short term, but if it leads to a spike in returns or customer complaints, the net impact on the business is negative. Similarly, Unsubscribe Rates should be monitored when testing lead-capture pop-ups. If a new “spin-to-win” wheel increases email signups but leads to a 50% increase in immediate unsubscribes, the quality of the list is being compromised.
A Methodological Framework for Choosing KPIs
Selecting the right KPI for a specific experiment requires a structured approach. Industry experts recommend a four-tiered framework:
- Start with the Business Goal: If the company needs to clear out old inventory, the KPI should be “Units Per Transaction.” If the goal is brand awareness, it might be “Newsletter Signups.”
- Identify One Primary KPI: Every A/B test should have one “North Star” metric that determines the winner. This prevents “p-hacking” or searching for a winning result among dozens of different numbers.
- Assign Diagnostic KPIs: Include 2–4 secondary metrics to explain why the primary KPI moved. If conversion rates went up, did it happen because users spent more time on the page or because they clicked a specific new button?
- Monitor Guardrail KPIs: Ensure that the “win” on the primary KPI didn’t come at the expense of customer satisfaction or downstream retention.
Chronology of CRO Evolution and Industry Context
The practice of tracking CRO KPIs has evolved significantly over the last two decades. In the early 2000s, “webmasters” focused primarily on “hits” and “pageviews.” By the 2010s, the rise of tools like Optimizely and VWO (Visual Website Optimizer) popularized the A/B test, shifting focus to the conversion rate.
In 2024, the landscape has shifted again due to privacy regulations such as GDPR and the phase-out of third-party cookies. This has forced companies to move toward “server-side” tracking and first-party data. Modern CRO is no longer just about changing button colors; it is about data science and incremental gains. Industry leaders now emphasize “Velocity of Testing”—the number of experiments run per month—as a meta-KPI for the health of an organization’s innovation culture.
Implications and Future Outlook
The integration of Artificial Intelligence (AI) into analytics is expected to further refine how CRO KPIs are measured. Predictive analytics can now estimate the “Potential Revenue Lift” of a specific page change before a test is even launched. Furthermore, “segmentation” is becoming increasingly granular. Instead of looking at a global conversion rate, businesses are analyzing KPIs for specific cohorts, such as “Returning Visitors from Mobile Devices in North America.”
The broader implication for the business world is clear: companies that master the art of selecting and tracking the right CRO KPIs will achieve a significant competitive advantage. By focusing on outcomes rather than just activities, these organizations can ensure that every dollar spent on website development and digital marketing yields a measurable return on investment. As digital interfaces become the primary touchpoint for customer interaction, the ability to scientifically improve those interactions is no longer optional—it is a requirement for survival in the digital economy.