In an era where customer experience (CX) has superseded price and product as the primary brand differentiator, the ability to accurately quantify consumer sentiment has become a cornerstone of corporate strategy. Organizations globally are increasingly pivoting toward data-driven methodologies to understand their audience, yet a fundamental tension remains in the selection of appropriate Key Performance Indicators (KPIs). At the center of this discourse are two ubiquitous metrics: the Customer Satisfaction Score (CSAT) and the Net Promoter Score (NPS). While frequently used interchangeably by unseasoned marketing teams, these metrics serve distinct functions within the customer lifecycle, offering different vistas into the health of a business.
The fundamental divergence between CSAT and NPS is rooted in their scope and temporal focus. CSAT is essentially a "micro" metric, designed to capture immediate, transactional feedback following a specific interaction—such as a technical support call or a product purchase. Conversely, NPS is a "macro" metric, measuring long-term relational health and the likelihood of a customer becoming a brand advocate. Understanding the interplay between these two scores is no longer an academic exercise but a commercial necessity for firms aiming to reduce churn and catalyze organic growth.
The Historical Evolution of Feedback Systems
The methodology of measuring customer sentiment has evolved significantly over the last four decades. In the 1980s and 1990s, businesses relied heavily on exhaustive, multi-page surveys that often suffered from low response rates and "survey fatigue." During this period, the Customer Satisfaction Score (CSAT) emerged as a streamlined way to gauge the success of individual touchpoints. It provided managers with a "pulse check" on service delivery, allowing for rapid adjustments in frontline operations.
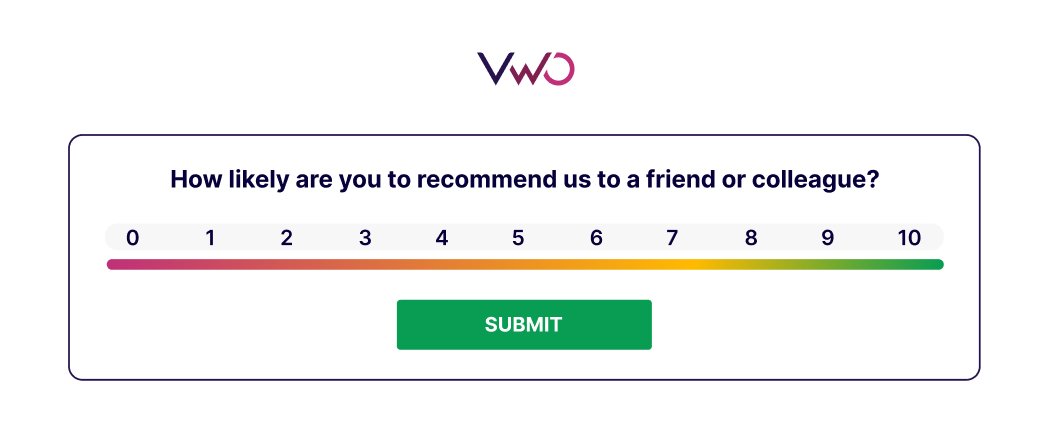
The landscape shifted dramatically in 2003 when Fred Reichheld, a partner at Bain & Company, introduced the Net Promoter Score in a Harvard Business Review article titled "The One Number You Need to Grow." Reichheld argued that traditional satisfaction surveys were too complex and failed to correlate strongly with actual business growth. He proposed a single question—"How likely is it that you would recommend our company/product/service to a friend or colleague?"—as the ultimate predictor of customer loyalty.
By the 2010s, the rise of Software as a Service (SaaS) and digital commerce necessitated a hybrid approach. The chronology of feedback transitioned from periodic manual reviews to real-time, automated data collection. Today, the integration of Artificial Intelligence (AI) and Machine Learning (ML) allows companies to analyze qualitative feedback at scale, bridging the gap between what a customer says and what they are likely to do next.
Technical Breakdown: How CSAT and NPS are Calculated
To appreciate the strategic utility of these metrics, one must first understand their mathematical foundations.
Customer Satisfaction Score (CSAT)
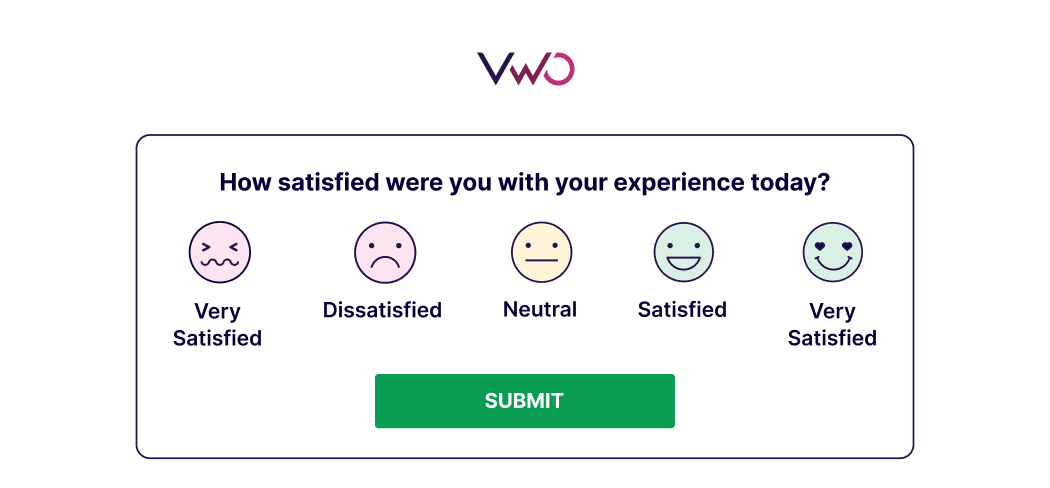
CSAT is typically measured by asking customers to rate their satisfaction with a specific experience on a scale (often 1–5 or 1–10). The score is calculated by taking the number of satisfied responses (those who rated 4 or 5 on a 5-point scale) and dividing it by the total number of responses, then multiplying by 100 to get a percentage.

- Formula: (Number of Satisfied Responses / Total Responses) x 100 = % CSAT.
- Utility: It identifies friction points in the user journey, such as a confusing checkout process or a slow customer support response.
Net Promoter Score (NPS)
NPS utilizes a 0–10 scale to categorize respondents into three groups:
- Promoters (9–10): Loyal enthusiasts who will keep buying and refer others.
- Passives (7–8): Satisfied but unenthusiastic customers who are vulnerable to competitive offerings.
- Detractors (0–6): Unhappy customers who can damage your brand through negative word-of-mouth.
- Formula: % Promoters – % Detractors = NPS (expressed as a number between -100 and +100).
- Utility: It serves as a barometer for brand equity and a predictor of long-term retention and expansion revenue.
Supporting Data and Industry Benchmarks
The effectiveness of these metrics is often reflected in industry-specific benchmarks. According to recent market research, a "good" NPS varies significantly by sector. For instance, the average NPS for the department store industry typically hovers around 50 to 60, while the Internet Service Provider (ISP) industry often struggles with scores in the single digits or even negative territory due to high levels of inherent friction.
Data from Qualtrics and other CX research firms suggest that "Promoters" have a lifetime value (LTV) that is 3 to 8 times higher than "Detractors." Furthermore, companies that prioritize high CSAT scores in their support departments see a 15% to 20% reduction in service costs, as satisfied customers require fewer follow-up interactions. However, a high CSAT does not always guarantee loyalty. A customer may be satisfied with a single transaction (High CSAT) but still be willing to switch to a competitor for a lower price (Low NPS). This discrepancy highlights the necessity of tracking both metrics simultaneously.
The Loyalty-Satisfaction Matrix: A Strategic Framework
When organizations plot CSAT against NPS, they move beyond simple data collection and into the realm of predictive analytics. This creates a "loyalty-satisfaction matrix" that categorizes the customer base into four distinct strategic quadrants:
- Brand Champions (High CSAT / High NPS): These are the ideal customers. They are satisfied with their daily interactions and loyal to the brand. Strategic move: Nurture these individuals for case studies, referrals, and beta testing for new features.
- At-Risk Satisfied Users (High CSAT / Low NPS): These users find the product functional but lack emotional or brand attachment. They are "mercenary" customers who will churn for a 10% discount from a competitor. Strategic move: Focus on brand-building, community engagement, and loyalty programs to deepen the relationship.
- Frustrated Loyalists (Low CSAT / High NPS): These customers believe in the company’s vision or are "locked in" to the ecosystem, but they are currently struggling with the product or service. Strategic move: Immediate intervention to fix technical friction before their patience evaporates.
- Churn Risks (Low CSAT / Low NPS): These individuals have checked out both emotionally and technically. Strategic move: If the cost of acquisition was high, an immediate "save" attempt is needed; otherwise, manage a graceful exit to prevent public negative reviews.
The Role of Artificial Intelligence and Modern Tooling
The contemporary approach to CX is increasingly defined by automation. Many product teams now leverage Generative AI to perform sentiment analysis on open-ended feedback gathered through CSAT and NPS surveys. While a numerical score tells a company what is happening, the qualitative comments explain why.
AI can process thousands of survey responses in seconds, identifying recurring themes such as "slow load times" or "difficult navigation." However, industry experts caution against total reliance on automation. As Ali Good, Global Head of Strategy and Product Marketing at Quizizz, noted in a recent webinar, the "Voice of the Customer" is a form of social proof that must be woven into messaging. Good emphasizes that using the actual language of customers helps brands avoid "marketing-ish jargon" and ensures that the value proposition resonates with the user’s lived experience.
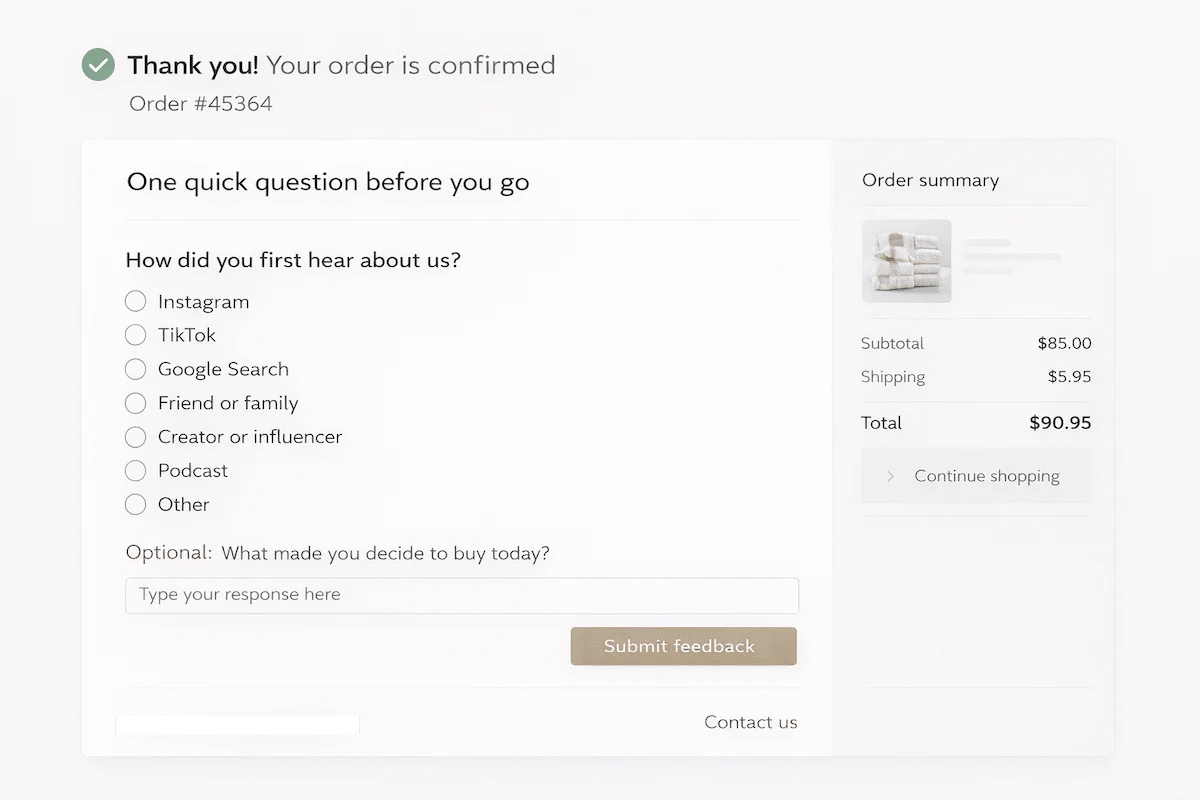
Platforms like VWO Pulse have emerged to help product teams close the loop between feedback and action. By deploying contextual survey triggers—such as a CSAT survey appearing immediately after a user engages with a new feature—teams can capture real-time sentiment. This data is then paired with behavioral analytics, such as heatmaps and session recordings, to see if a customer’s actions align with their stated satisfaction.
Broader Impact and Business Implications
The implications of mastering the CSAT-NPS balance extend to the highest levels of corporate governance. Investors and stakeholders increasingly look at NPS as a leading indicator of a company’s future financial health. A declining NPS is often a precursor to a drop in revenue, even if current sales figures remain strong.
Furthermore, the integration of these metrics into a unified "Experience Optimization" engine allows companies to be proactive rather than reactive. Instead of waiting for a quarterly NPS report to realize that customer sentiment has soured, teams can use weekly CSAT dips to identify and fix bugs or service gaps in real-time.
In conclusion, while CSAT and NPS measure different dimensions of the customer experience, they are most powerful when used in tandem. CSAT provides the tactical, "right here, right now" feedback necessary for operational excellence, while NPS offers the strategic, long-term view required for sustainable growth. By bridging these two metrics with behavioral data and AI-driven insights, modern enterprises can transform passive feedback into a potent lever for competitive advantage. The goal is no longer just to satisfy a customer for a moment, but to cultivate a relationship that lasts a lifetime.