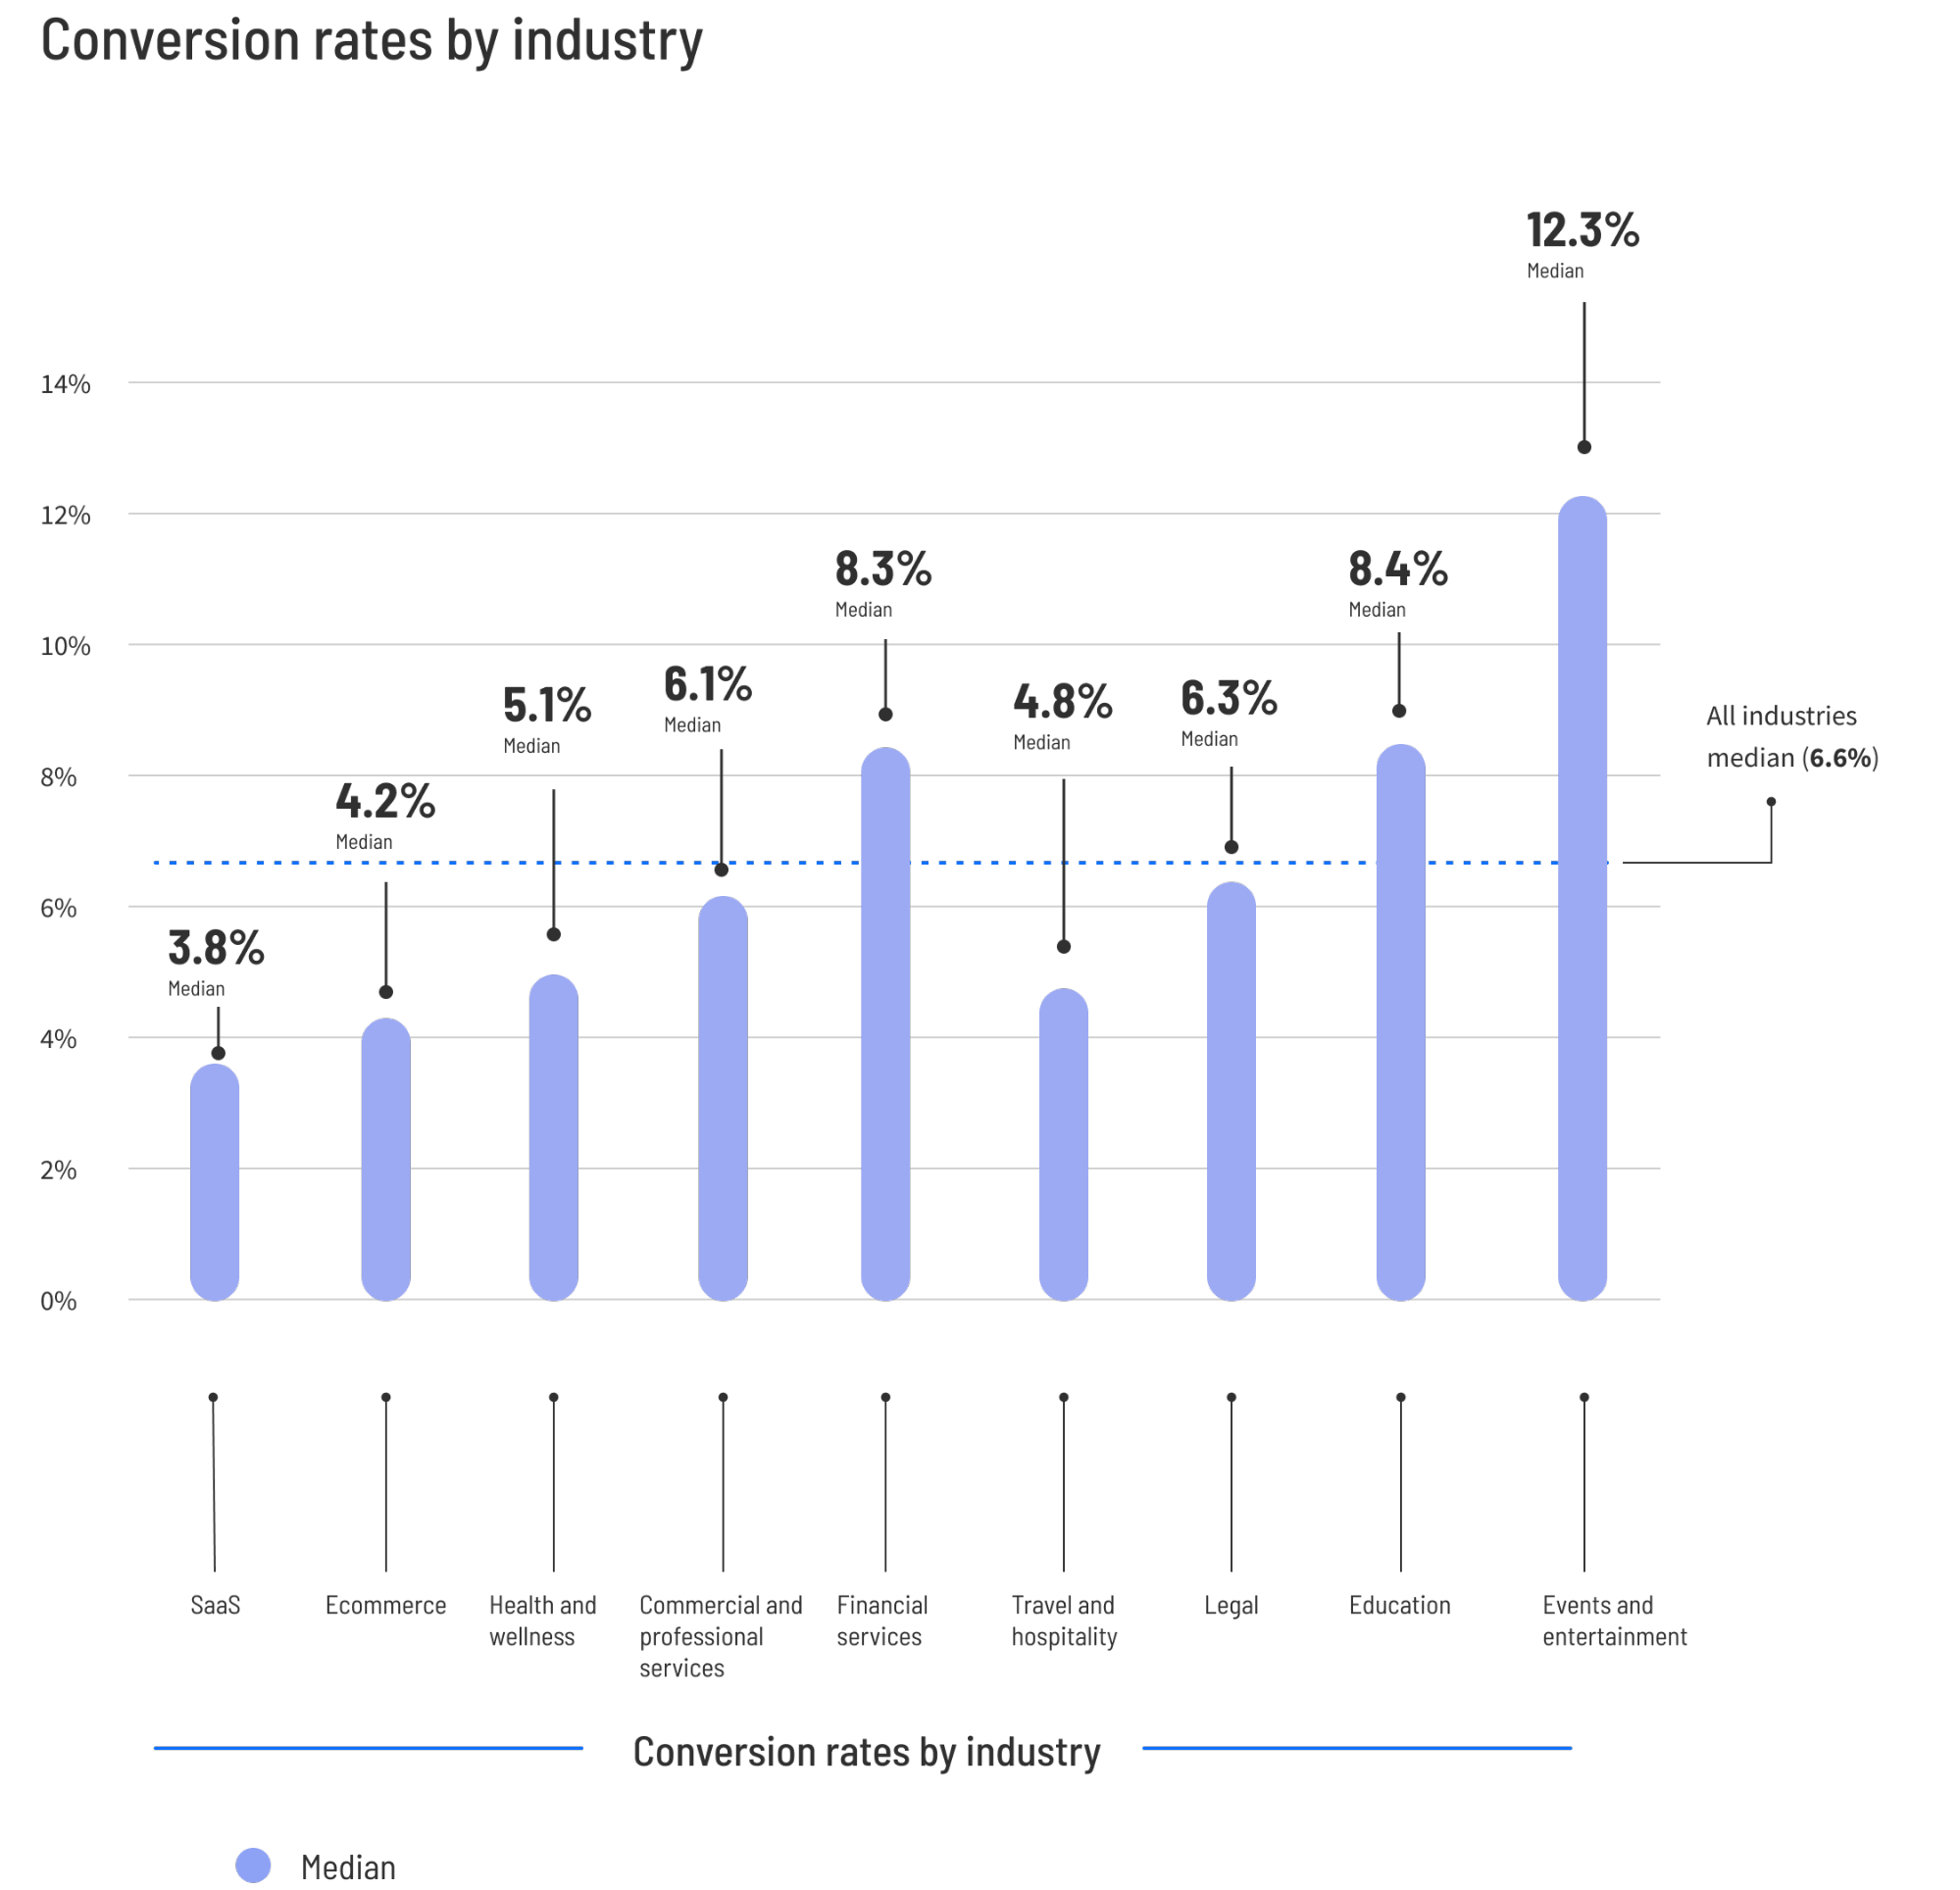
The digital marketing landscape in 2024 is characterized by rising customer acquisition costs and an increasingly fragmented audience, placing a renewed emphasis on the efficiency of landing pages. According to the latest Conversion Benchmark Report, which analyzed over 57 million conversions across 41,000 landing pages and 464 million pageviews, the standard for a "successful" campaign varies significantly by sector. While the global median conversion rate for landing pages currently sits at 6.6%, this figure serves as a broad baseline rather than a universal target. Performance metrics are heavily influenced by industry-specific intent, the device used for browsing, and the complexity of the offer presented to the user.
The Statistical Foundation of Modern Conversion Metrics
To understand these benchmarks, it is essential to distinguish between median and average values. Marketing data is frequently skewed by "unicorn" pages—outliers that achieve conversion rates nearing 90% due to highly specific, incentivized offers—and "strugglers" that fail to convert even a fraction of a percent. The 2024 data utilizes median values to represent the "middle-of-the-pack" performance, providing a more realistic comparison for the typical marketer.
The report identifies the 75th percentile as the threshold for "good" performance. To be among the top 25% of performers in any given field, a landing page must generally exceed a conversion rate of 11.4%, though in high-engagement sectors like entertainment or sweepstakes, this floor can rise as high as 40.8%. This gap between the median (6.6%) and the top-tier performers (11.4%+) highlights a significant opportunity for optimization across almost every vertical.

Industry-Specific Performance Analysis
Ecommerce and Retail: The High-Volume Challenge
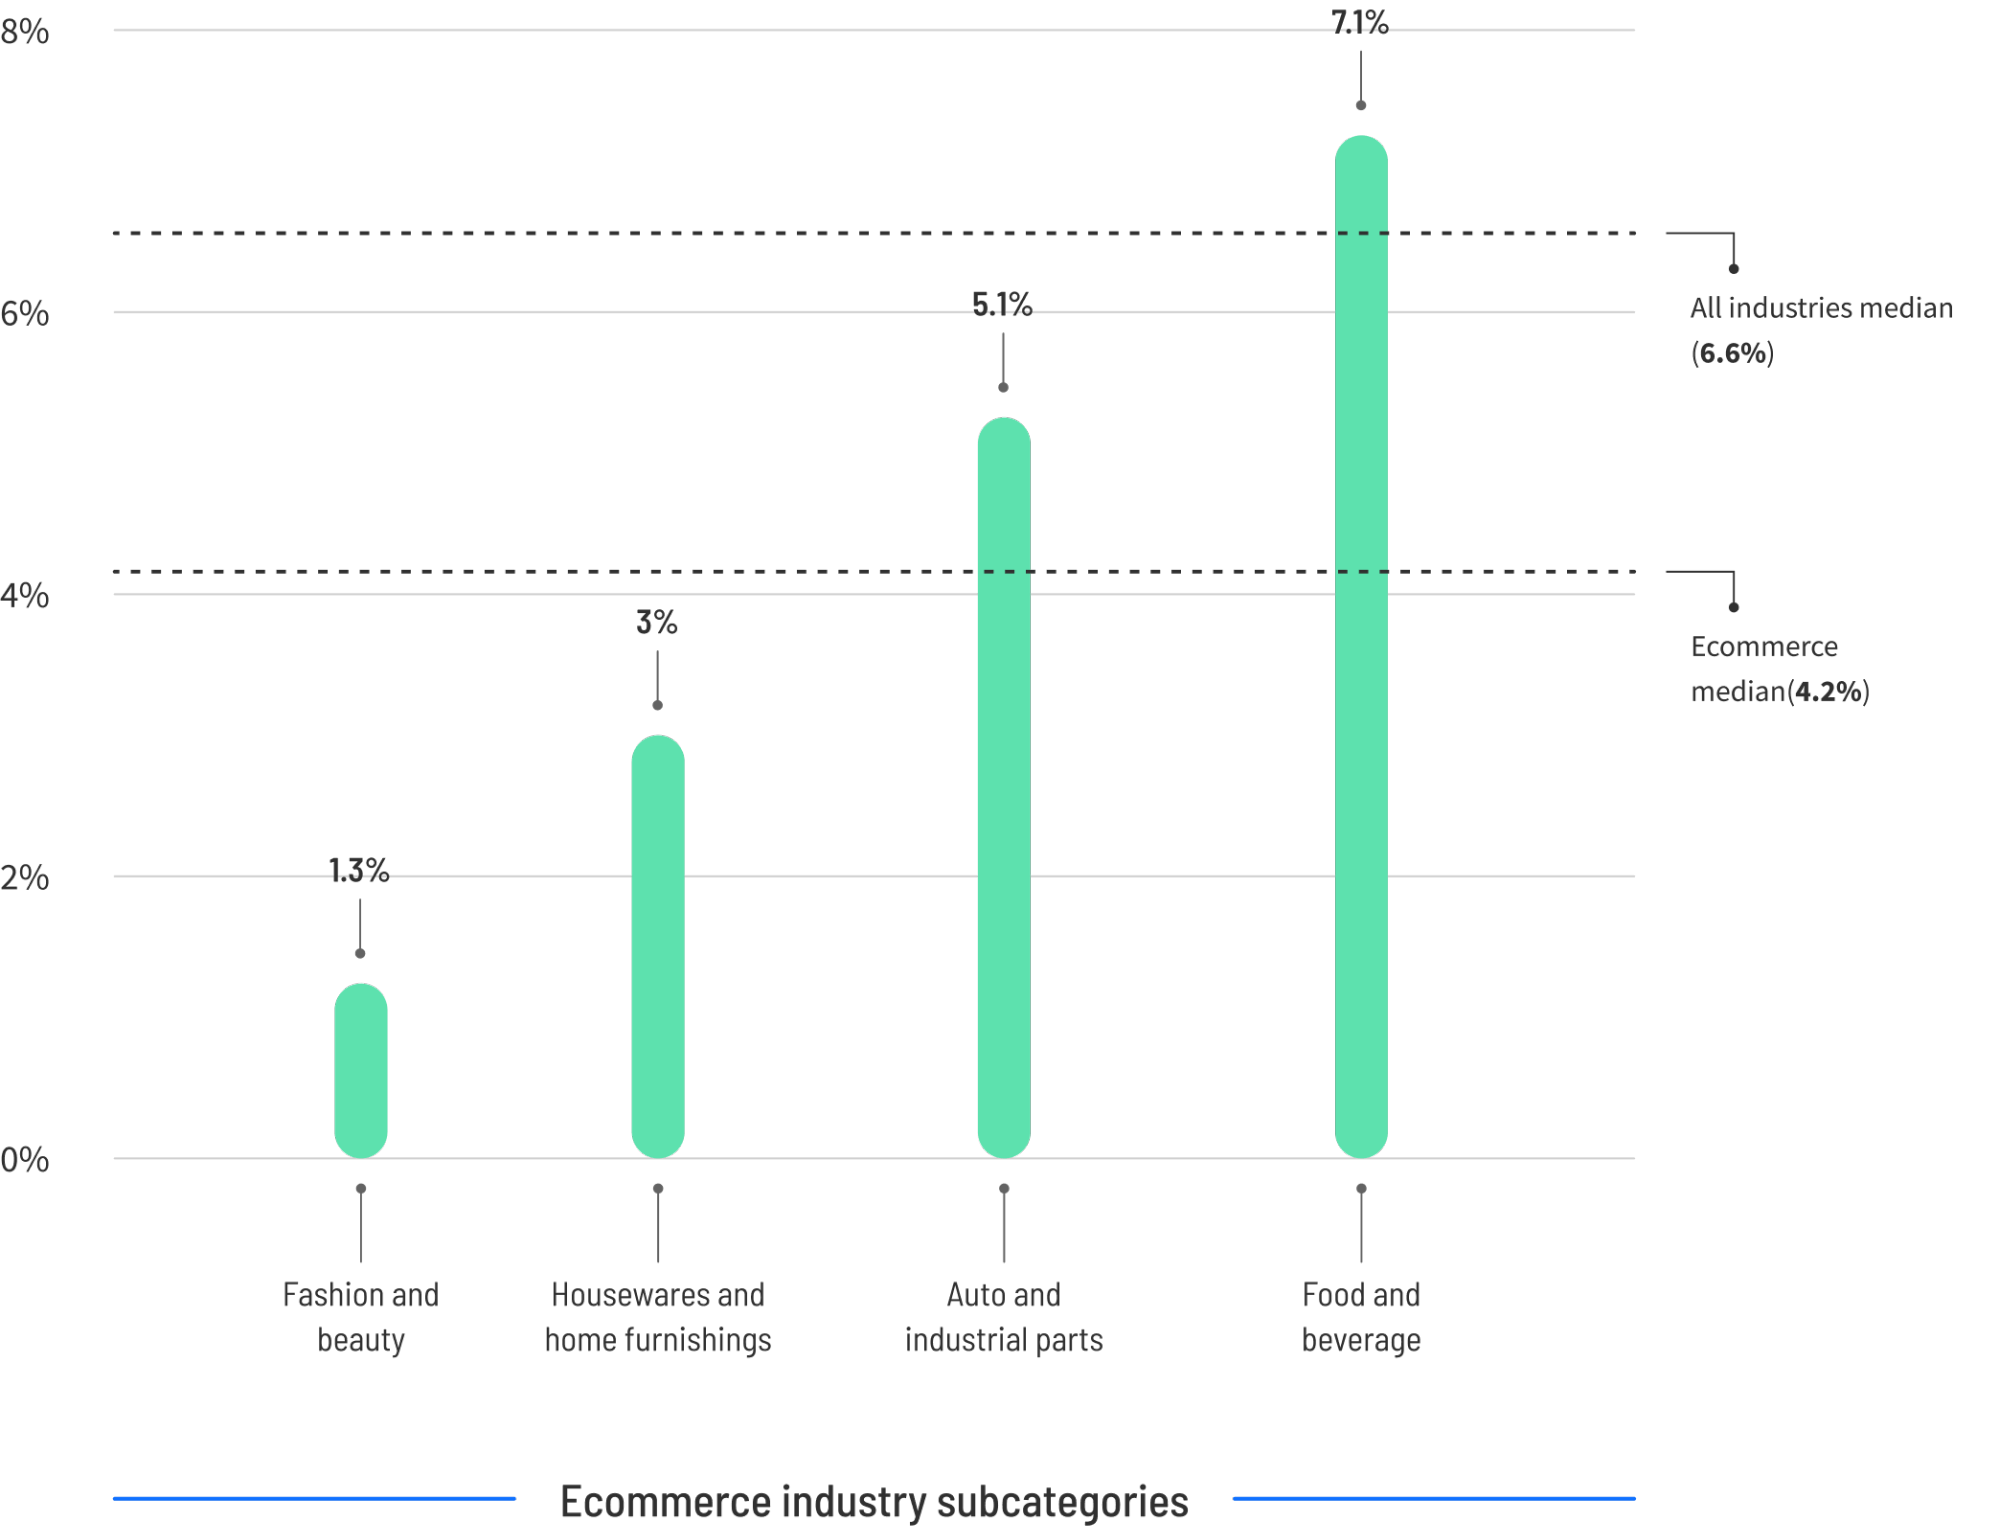
The median conversion rate for ecommerce landing pages is currently 4.2%. Within this sector, there is a stark contrast between product categories. Food and beverage pages lead the industry with a 7.1% median, likely driven by lower price points and high-frequency purchasing habits. Conversely, fashion and beauty pages see a lower median of 1.3%, reflecting a consumer journey characterized by heavy comparison shopping and high aesthetic scrutiny. For ecommerce brands, moving from the median to the 75th percentile (11.4%) represents a nearly 3x increase in revenue potential from the same traffic volume.
Software as a Service (SaaS): Complexity vs. Conversion
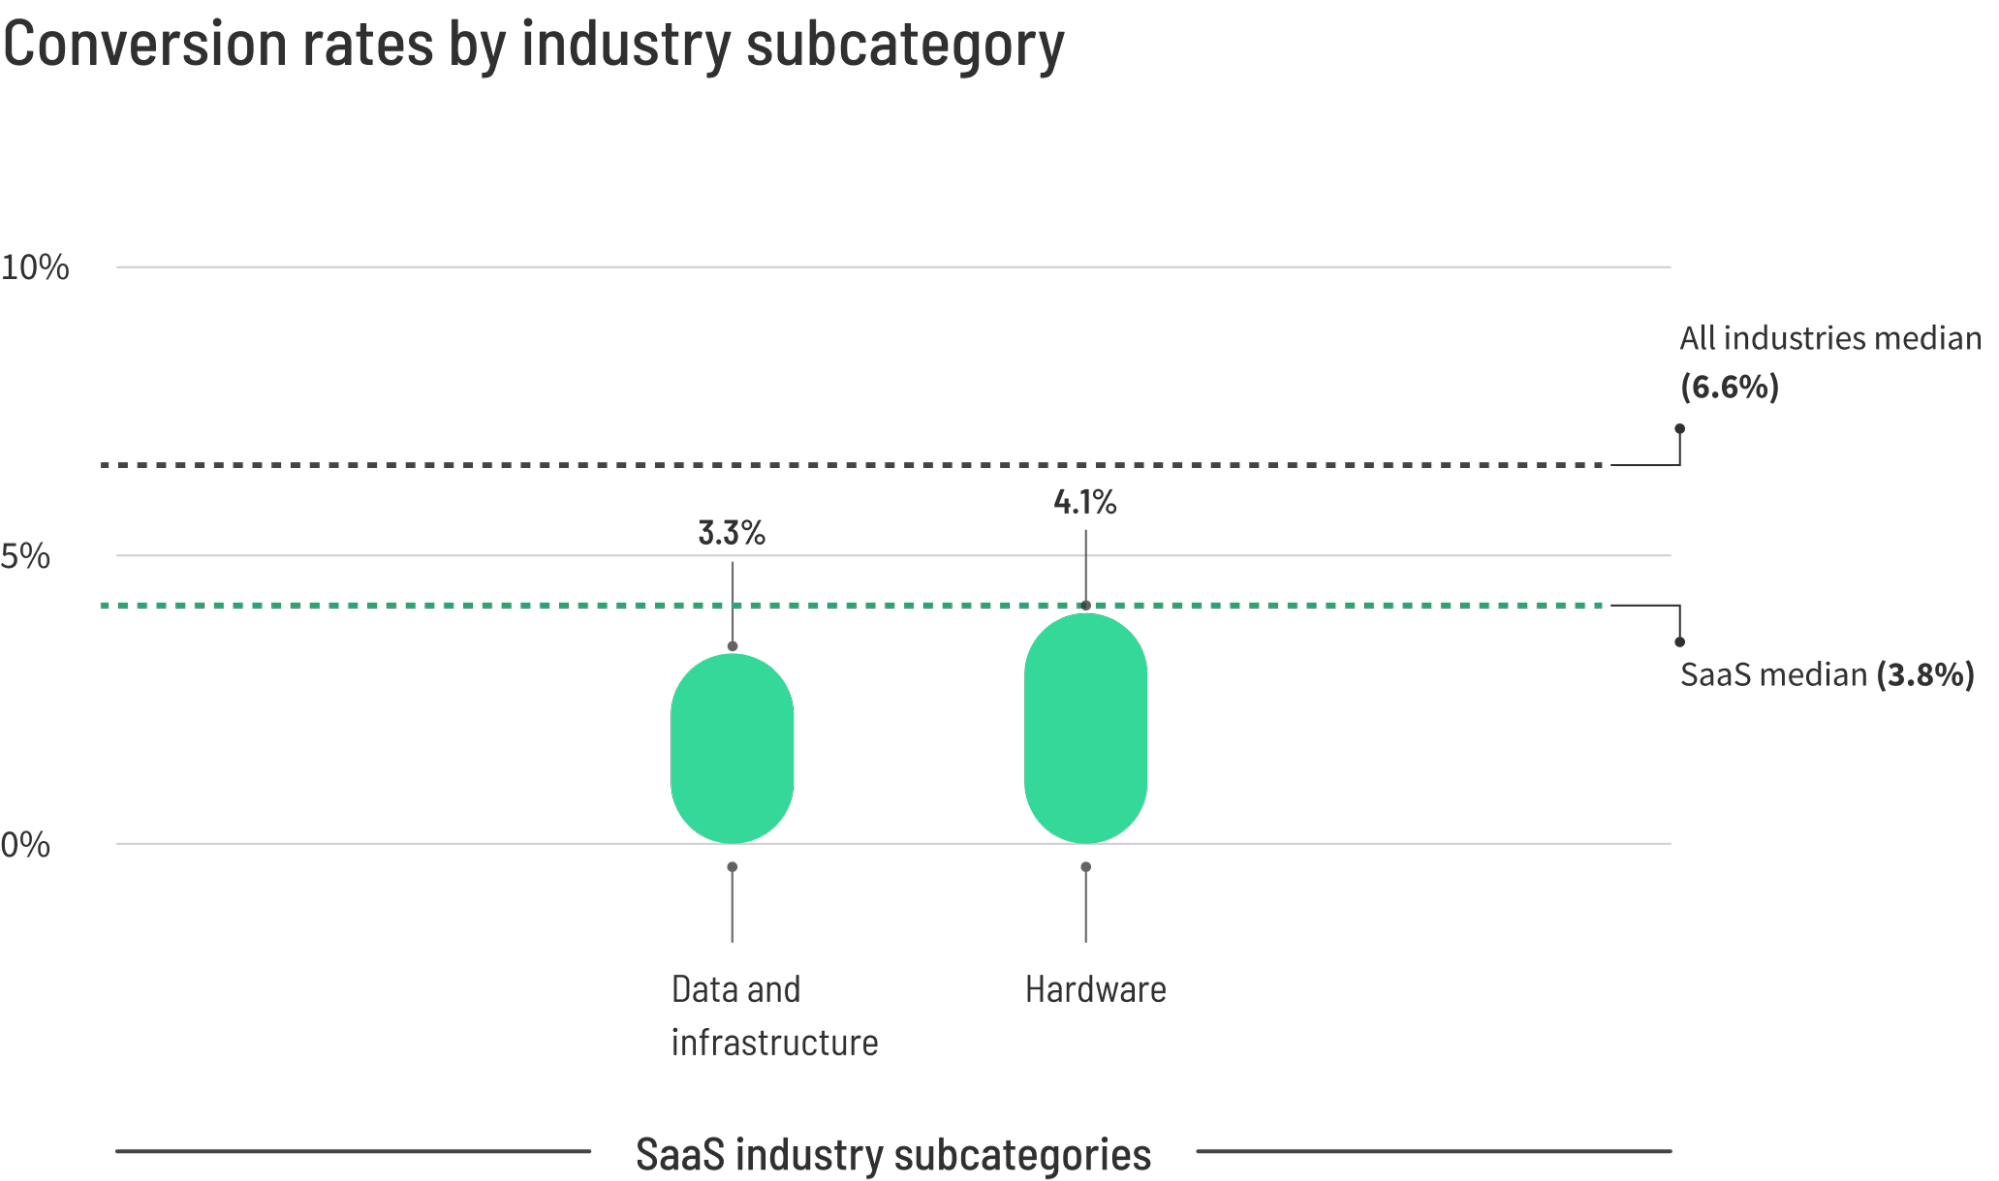
SaaS landing pages face a unique hurdle: they often promote complex, high-consideration products with longer sales cycles. The median conversion rate for SaaS is 3.8%, falling below the cross-industry average. Data and infrastructure solutions tend to convert at a lower rate (3.3%) compared to hardware-focused SaaS (4.1%). Analysts suggest this is due to the varying levels of "buying intent" among visitors; many are in the research phase rather than the ready-to-buy phase. Top-performing SaaS pages, which hit 11.6% or higher, typically succeed by simplifying their value propositions and offering low-friction entry points, such as "no-credit-card-required" trials.
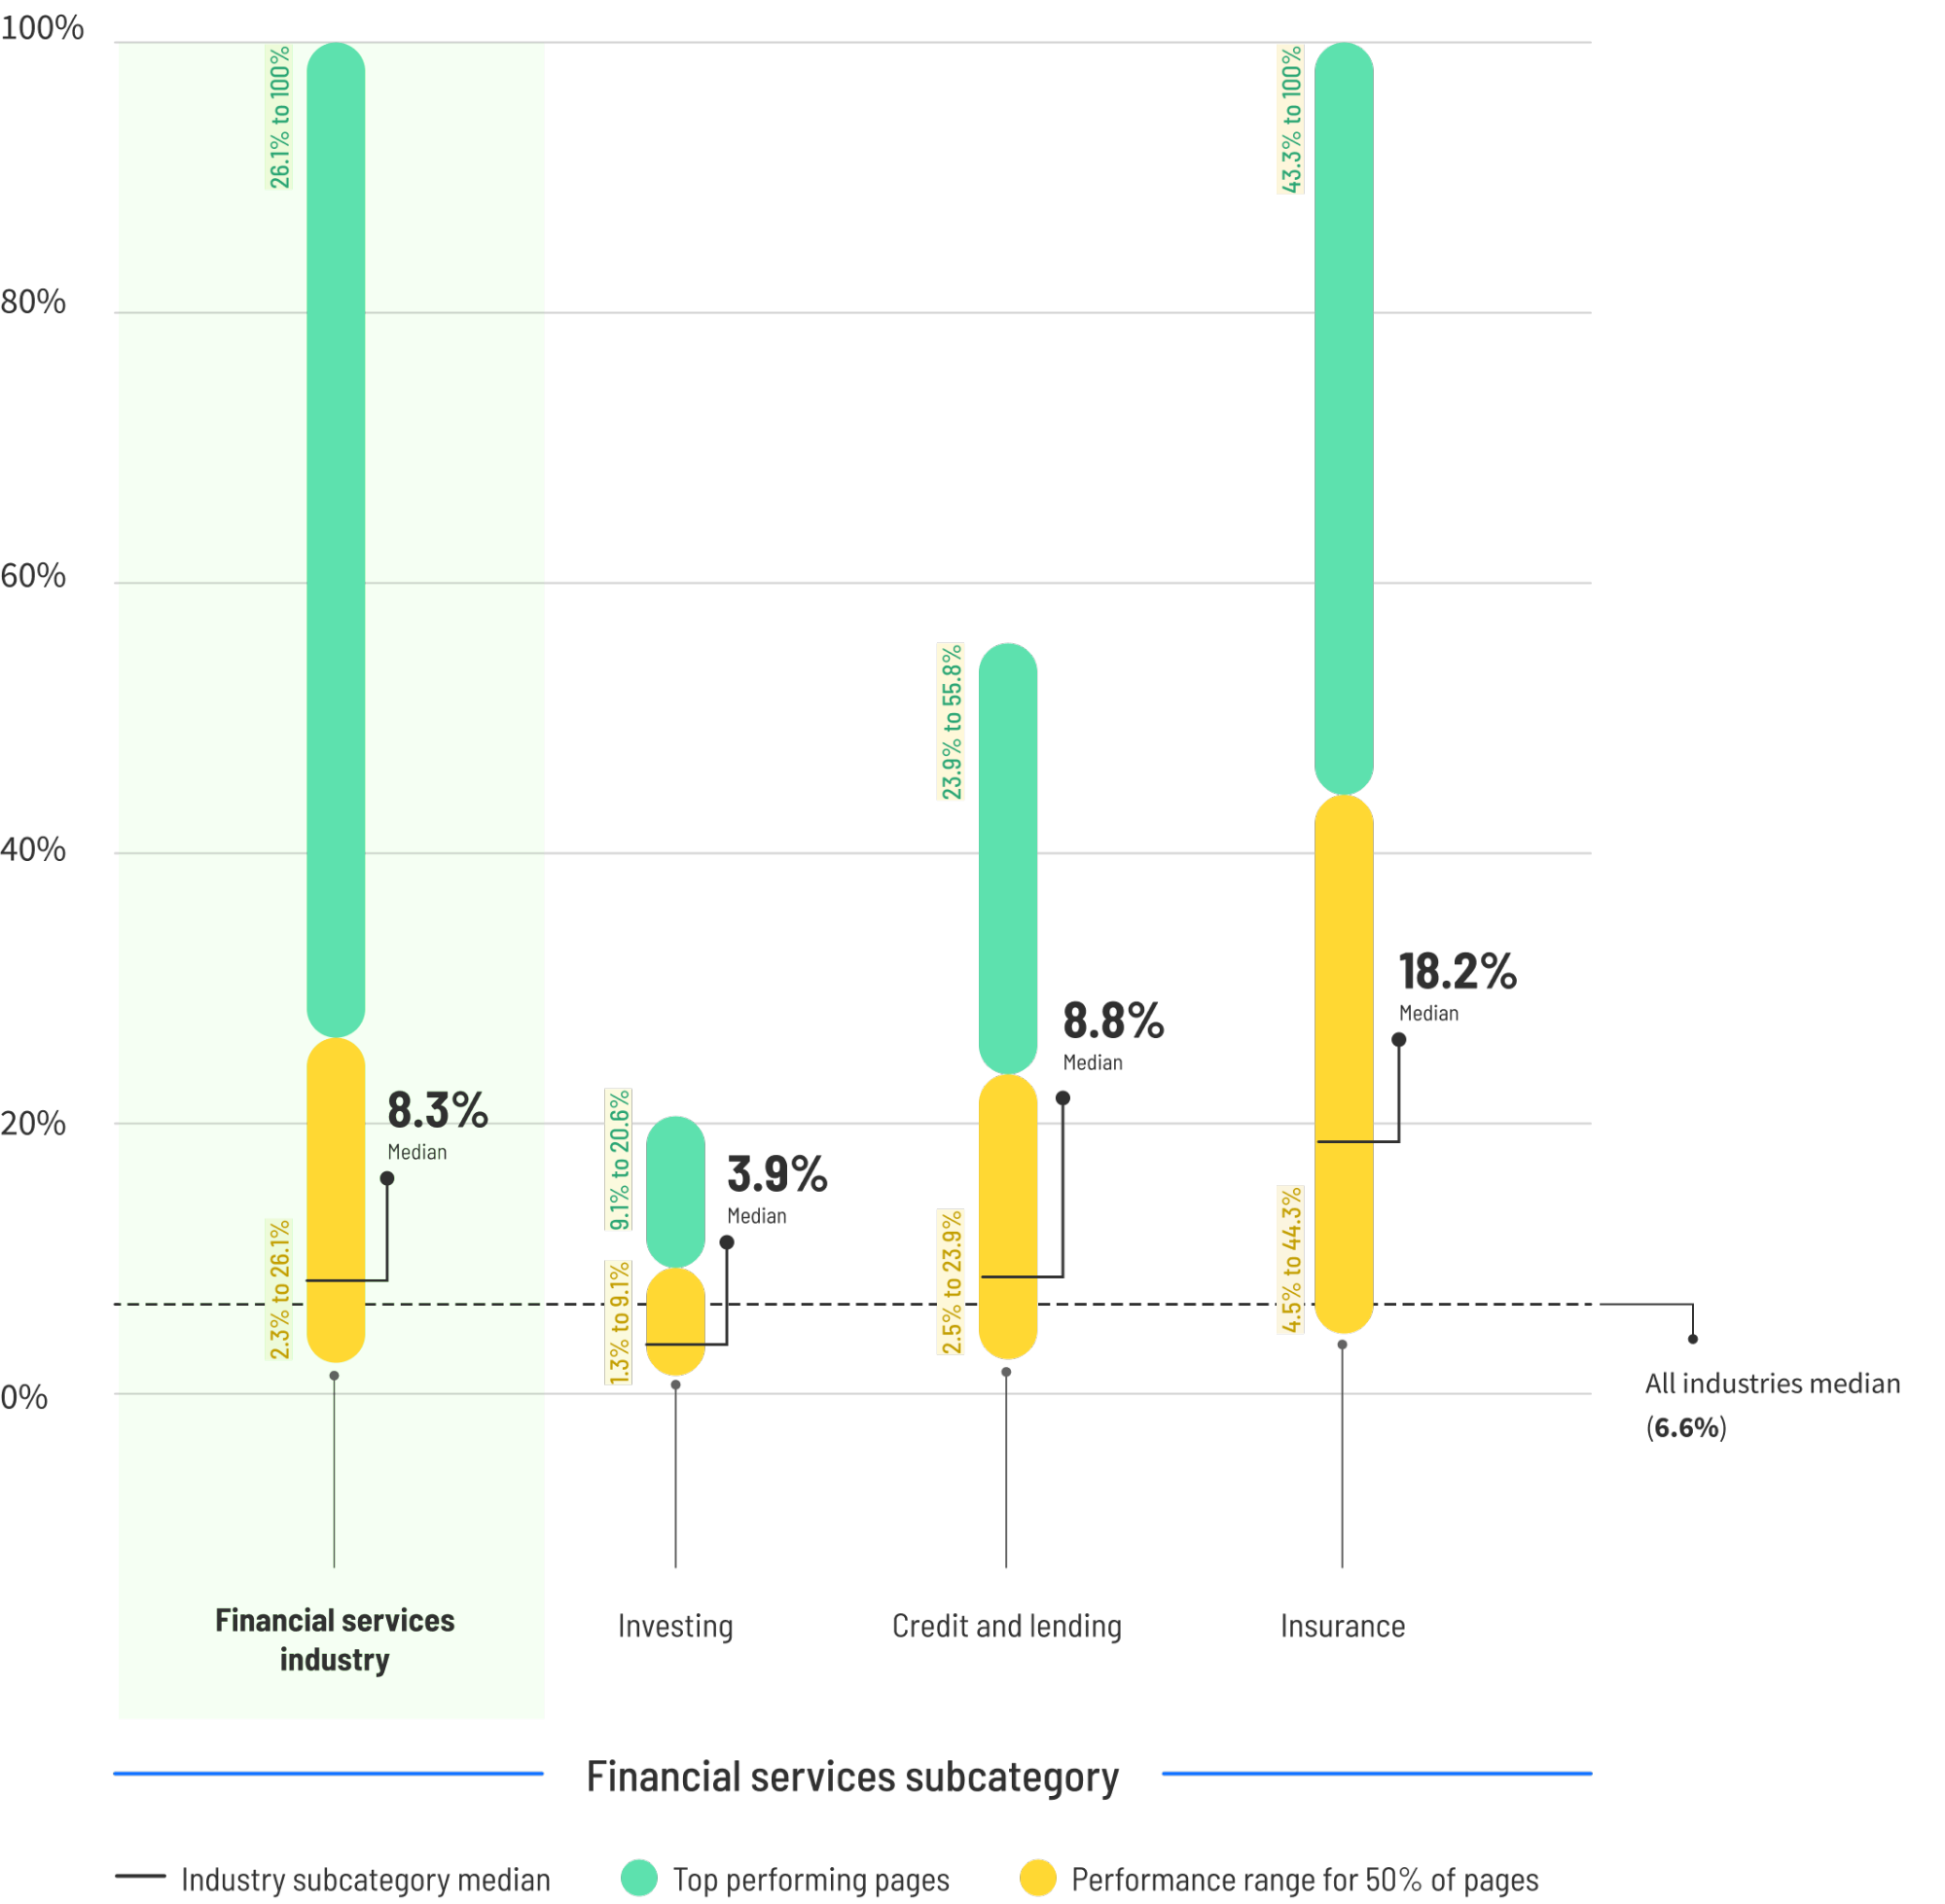
Financial and Legal Services: The Urgency Factor
Financial services boast a higher-than-average median conversion rate of 8.3%. This is largely attributed to high-intent user behavior. Consumers looking for insurance (which sees an 18.2% median) or investment options are usually actively seeking a solution to a specific need.
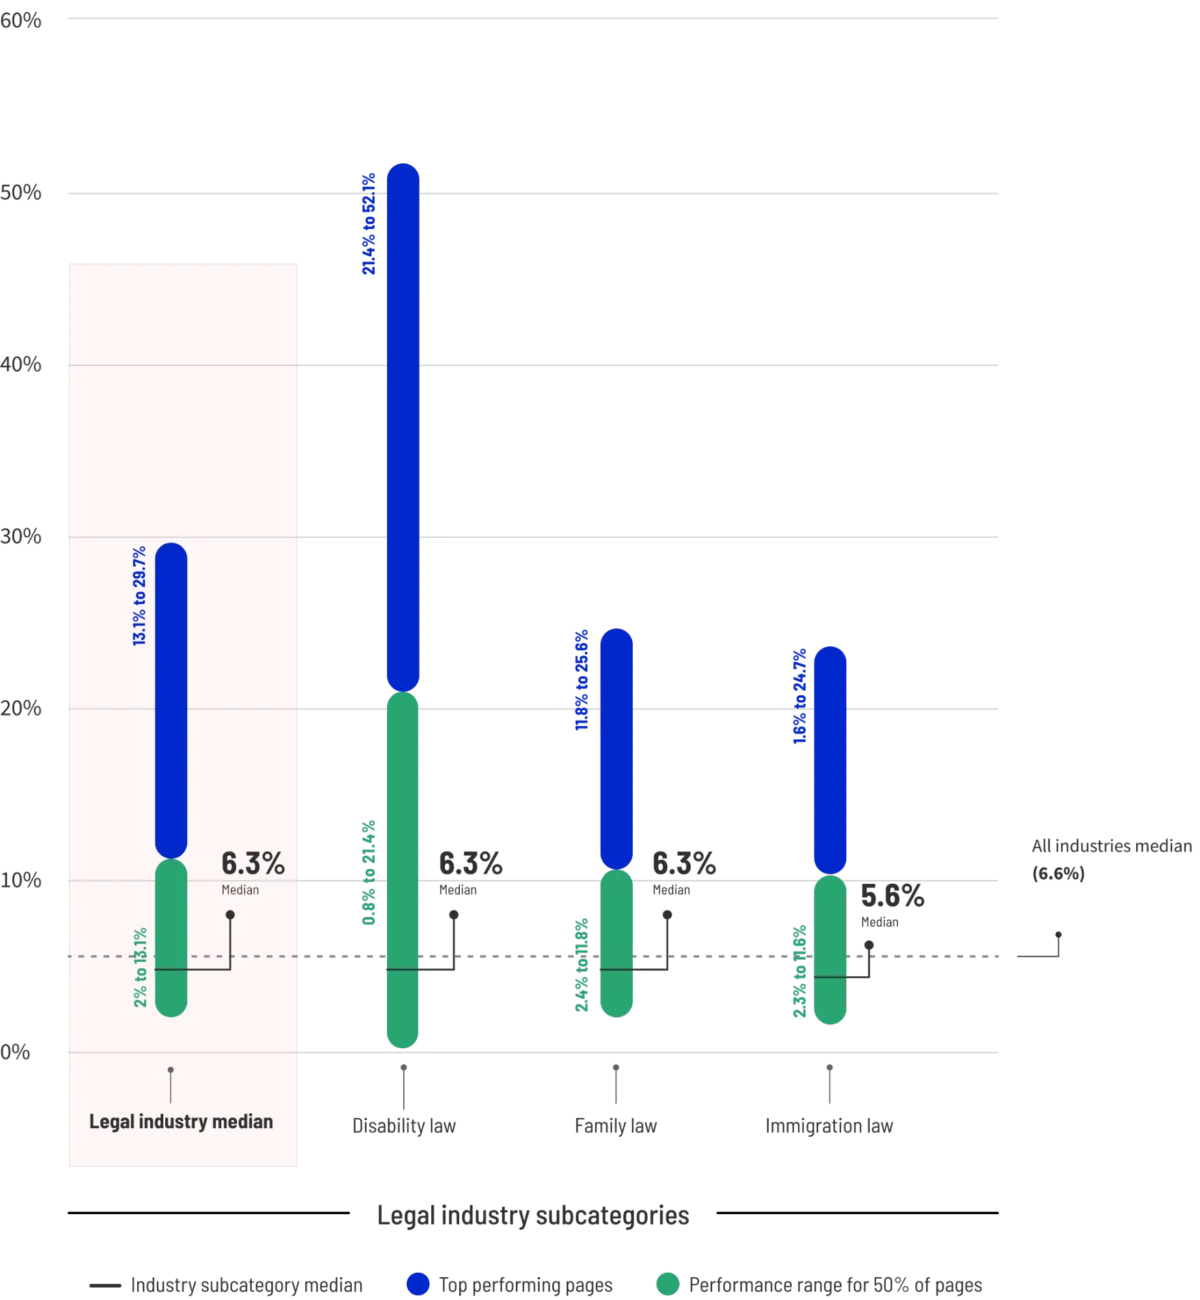
Similarly, the legal sector demonstrates a median rate of 6.3%. However, the legal industry is one of the few where mobile performance significantly outpaces desktop. Legal landing pages convert at 21% on mobile compared to 15.9% on desktop. This trend is driven by "crisis-based" searches—individuals searching for attorneys immediately following an accident or legal notification. Paid search traffic in the legal field converts nearly twice as well as other channels, emphasizing the importance of being the first visible solution in a moment of urgency.
Education and Entertainment: Engagement and Transformation
Education marketers are currently seeing a median conversion rate of 11.8%. The standout subsector is online courses, which achieve an 18.3% median. These pages often sell "transformation" or immediate skill acquisition, which resonates more strongly than the broad branding used by traditional higher education institutions (6.3% median).
The entertainment industry remains the outlier in the data set. While the sector median is 11.3%, sweepstakes and contest pages achieve a staggering median of 47.5%. The top quartile of entertainment pages converts at 40.8% or higher. These figures are influenced by the low barrier to entry, often requiring only an email address for a chance at a high-value prize.
The Role of Traffic Channels and Device Optimization
A critical finding in the 2024 data is the ongoing tension between mobile traffic volume and desktop conversion efficiency. Mobile devices account for 83% of all landing page visits, yet desktop traffic continues to convert at a higher rate in most industries, including travel and hospitality, where desktop converts 10.4% better than mobile.
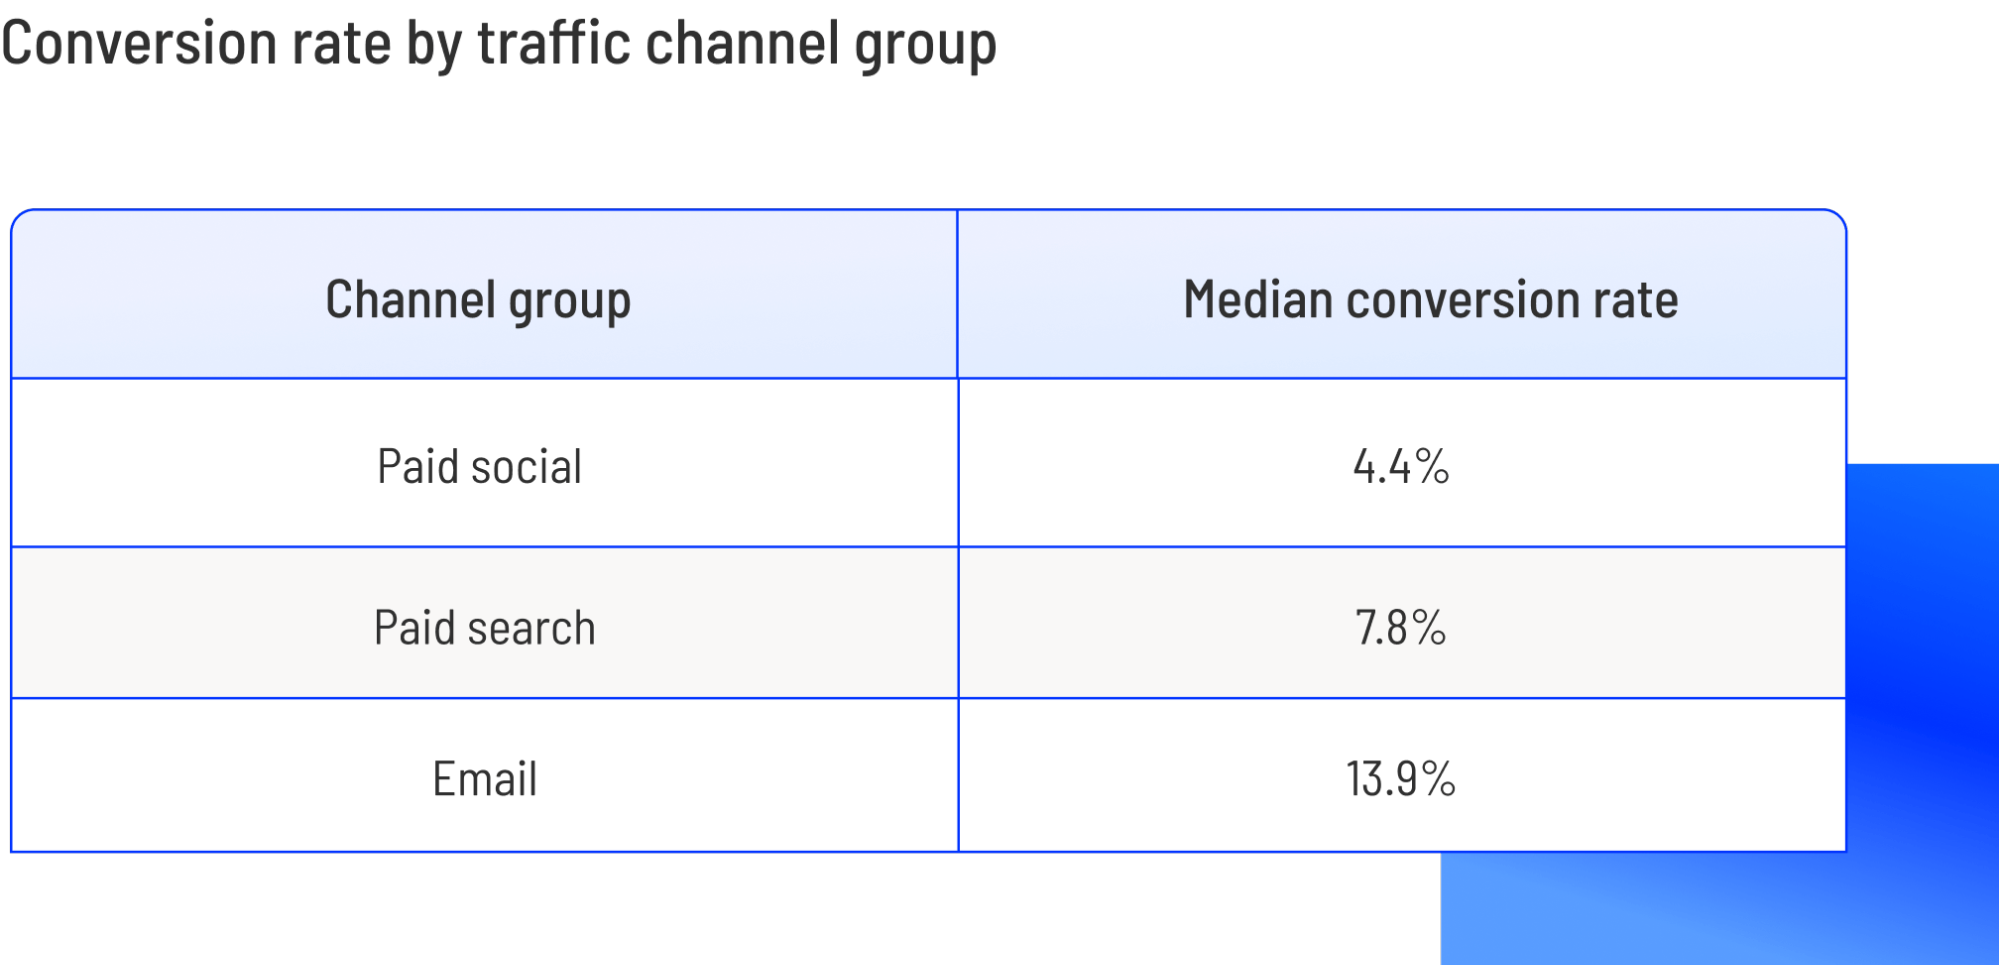
Channel-specific data also reveals that email remains the most potent tool for professional services, converting at 14%, compared to just 4.4% for paid social. This suggests that while social media is effective for brand awareness, the nurtured relationship of an email list provides a significantly higher ROI when it comes to final conversion actions.
Cognitive Load and the "Reading Level" Discovery
One of the most actionable insights from the 2024 analysis involves the complexity of landing page copy. There is a direct, measurable correlation between the simplicity of language and the likelihood of conversion.
Data indicates that pages written at a 5th-to-7th-grade reading level achieve an average conversion rate of 11.1%. This is 56% higher than pages written at an 8th-to-9th-grade level and more than double the conversion rate of pages utilizing "professional" or jargon-heavy language. Industry analysts point to "cognitive ease" as the driving factor; when a visitor can quickly grasp a value proposition without mental strain, they are more likely to take action.
Chronology of Conversion Trends (2022–2024)
- 2022: The post-pandemic surge in digital adoption saw conversion rates stabilize as consumers returned to physical retail, forcing marketers to focus on "zero-party" data collection.
- 2023: Rising inflation and ad costs led to a "flight to quality." Median conversion rates dipped slightly as consumers became more cautious with their spending.
- 2024: The current era is defined by AI-driven personalization and the "simplification" of the web. The 6.6% median reflects a market that has become highly efficient at filtering out irrelevant offers.
Official Reactions and Expert Analysis
Marketing directors and industry analysts have noted that these benchmarks represent a "wake-up call" for businesses relying on generic templates. "The data shows that the ‘average’ is no longer enough to sustain a profitable return on ad spend (ROAS)," says one digital strategy consultant. "As privacy changes make top-of-funnel targeting less precise, the landing page must work harder to qualify and convert the traffic it receives."
Observers also highlight the "Mobile Gap" as a primary area for infrastructure investment. While 83% of traffic is mobile, the fact that many industries still see higher conversion on desktop suggests that mobile landing pages are still plagued by slow load times and cumbersome forms.
Broader Impact and Implications for 2025
The 2024 benchmarks suggest that the future of conversion rate optimization (CRO) will be rooted in three pillars: simplicity, urgency, and technical performance. As Customer Acquisition Costs (CAC) continue to climb, the ability to move a landing page from a 4% conversion rate to an 8% rate effectively halves the cost of acquisition.
Furthermore, the success of online courses and insurance pages indicates that consumers are moving away from "browsing" and toward "solving." Landing pages that position themselves as immediate solutions to specific problems—rather than digital brochures—are the ones currently defining the top 25% of the market. For businesses looking to outperform these benchmarks, the mandate is clear: reduce the reading level, optimize for the mobile experience, and use social proof to build trust in an increasingly skeptical digital environment.