The landscape of customer experience (CX) has undergone a fundamental shift over the last decade, moving away from the pursuit of "customer delight" toward a more pragmatic and impactful goal: the reduction of friction. While traditional metrics like Net Promoter Score (NPS) and Customer Satisfaction Score (CSAT) have long dominated boardrooms, the Customer Effort Score (CES) has emerged as the most reliable predictor of customer loyalty and future purchase behavior. Research indicates that customers rarely voice complaints when a digital experience requires excessive effort; instead, they quietly migrate to competitors. This erosion of loyalty is often the result of "micro-frictions"—extra clicks, redundant form fields, or ambiguous navigation steps—that accumulate over time to destroy the user experience.
The Evolution and Definition of Customer Effort Score
The concept of the Customer Effort Score was formally introduced in 2010 through a landmark Harvard Business Review article titled "Stop Trying to Delight Your Customers," authored by researchers at the Corporate Executive Board (CEB), which was later acquired by Gartner. The study challenged the long-held belief that companies must exceed customer expectations to ensure loyalty. Instead, the researchers found that meeting basic expectations and making the process "easy" was a far more effective strategy for retaining customers.
At its core, CES is a transactional metric that asks a single, pivotal question: "How easy was it to resolve your issue or complete your task today?" Unlike NPS, which measures long-term brand advocacy, or CSAT, which measures emotional sentiment following a specific event, CES focuses strictly on the perceived energy expenditure of the customer. By quantifying the ease of an interaction, businesses can pinpoint exactly where their digital or operational infrastructure is failing to meet the demand for efficiency.
The Strategic Importance of Low-Effort Experiences
The move toward measuring effort is backed by significant empirical data. According to Gartner’s research, 94% of customers who report a "low-effort" experience express an intention to repurchase, compared to only 4% of those who experienced "high-effort" interactions. Furthermore, the cost to serve a customer is typically 37% lower in low-effort environments because there are fewer follow-up calls, escalations, and repeat inquiries.
High-effort experiences are the primary drivers of customer disloyalty. When a customer encounters a "broken" journey—such as being forced to switch channels from a website to a phone call, or having to repeat their information to multiple agents—their likelihood of churn increases exponentially. CES acts as an early warning system, capturing signals of frustration before they manifest as public negative reviews or permanent account cancellations.

Industry experts, such as conversion optimization specialist Jon MacDonald, emphasize that every element on a website sends a signal about a brand’s relevance. When those signals are clouded by confusion, visitors instinctively seek alternatives. CES provides the quantitative framework necessary to identify these moments of confusion across the digital journey.
Methodologies for Measuring Customer Effort
Measuring CES requires a structured approach to data collection, typically involving a survey deployed immediately following a customer interaction. The standard methodology involves a Likert scale, though the specific range can vary based on organizational needs.
- The 1-7 Scale: This is the most common and statistically robust scale. A score of 1 represents "Very Difficult," while 7 represents "Very Easy." This range allows for a nuanced middle ground, helping analysts distinguish between "neutral" and "somewhat easy" experiences.
- The 1-5 Scale: Often used for its simplicity and higher response rates, this scale is easier for mobile users to navigate but offers slightly less granular data.
- Emoji or Visual Scales: Some brands utilize "Smiley Face" surveys to capture quick, visceral reactions, particularly in consumer-facing mobile apps where text-heavy surveys might add to the very "effort" the company is trying to measure.
The calculation of the score is straightforward: the sum of all individual ratings is divided by the total number of responses. For example, if a company receives 200 responses with a total point value of 1,100, the CES would be 5.5. While there is no universal "passing" grade, benchmarks suggest that any score above 5.0 on a 7-point scale is indicative of a healthy, low-friction experience.
Chronology of Touchpoints: When to Deploy CES Surveys
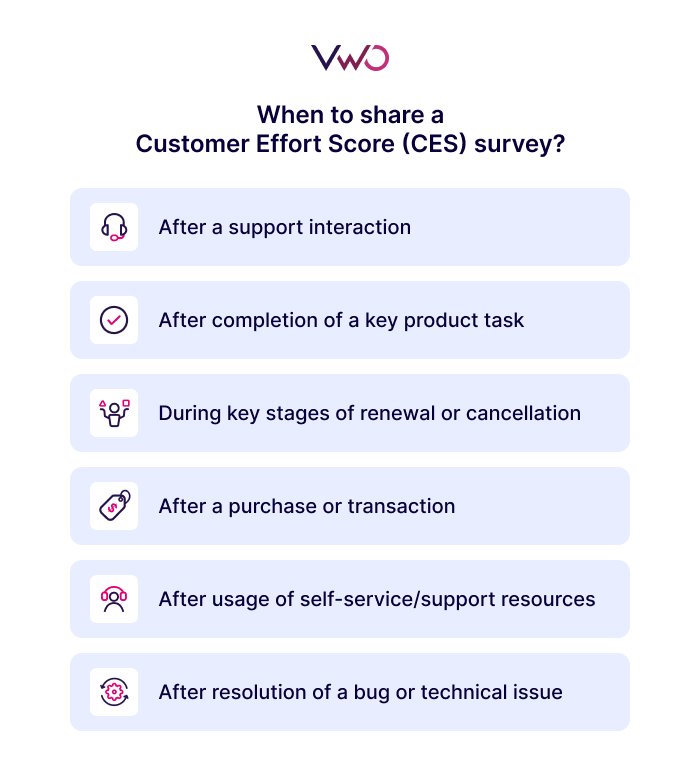
The timing of a CES survey is critical to its accuracy. Because it measures perceived effort, the survey must be triggered while the experience is fresh in the customer’s mind. Leading CX organizations typically deploy surveys at the following junctures:
Post-Support Interaction: This is the most traditional application of CES. Immediately after a support ticket is marked as "resolved" or a live chat session ends, the customer is asked how easy it was to get their problem fixed. This helps identify whether support agents are providing "one-contact resolutions" or if the process is overly bureaucratic.
Post-Transaction or Checkout: In e-commerce, the checkout flow is the most sensitive part of the funnel. A CES survey triggered on the "Thank You" page can reveal if the payment gateway was slow, if shipping options were confusing, or if the mobile interface was clunky.

After Key Product Milestones: For Software-as-a-Service (SaaS) companies, effort is measured during onboarding. After a user successfully sets up their profile or integrates a third-party tool, a CES survey can determine if the "time-to-value" was acceptable or if the software has a steep, discouraging learning curve.
Self-Service Exit: As companies push more customers toward help centers and AI chatbots, it is vital to measure the effectiveness of these tools. If a customer spends ten minutes in a knowledge base and then still has to email support, the "effort" is doubled. Surveys at the bottom of help articles are essential for optimizing self-service resources.
Comparative Analysis: CES vs. NPS vs. CSAT
To understand the broader impact of CES, it must be viewed in the context of the "Big Three" CX metrics. While they are often used interchangeably, they serve different strategic purposes:
- NPS (Net Promoter Score): Measures the strength of the relationship. It is a "macro" metric that predicts long-term growth and brand health.
- CSAT (Customer Satisfaction Score): Measures the happiness of the customer. It is an "emotional" metric that captures how a customer feels about a specific product feature or interaction.
- CES (Customer Effort Score): Measures the friction of the process. It is a "functional" metric that predicts loyalty and repeat behavior more accurately than satisfaction.
A customer might be "satisfied" with the friendly tone of a support agent (high CSAT) but still find the three-day resolution time "difficult" (low CES). In such cases, the low CES is a more accurate predictor that the customer will look for a faster competitor in the future.
Actionable Strategies to Reduce Customer Effort
Improving a Customer Effort Score requires a cross-functional effort between product, engineering, and customer success teams. Data-driven organizations use several key strategies to move the needle:
1. Channel Stickiness and "Next-Issue Avoidance"
One of the highest-effort activities for a customer is "channel switching"—starting a conversation on Twitter and being told to call a 1-800 number. Companies can improve CES by ensuring that issues are resolved on the platform where they started. Furthermore, support teams should practice "next-issue avoidance" by not only solving the current problem but also anticipating and addressing the likely follow-up question, thereby preventing a second interaction.
2. Streamlining Digital Navigation
Using session recordings and heatmaps, UX teams can visualize where users are hovering or backtracking. If a CES survey indicates high effort on a specific page, these visual tools can reveal "rage clicks" or confusing UI elements that need to be removed or simplified.
3. Enhancing Self-Service Accuracy
The easiest experience for a modern customer is often the one where they don’t have to talk to a human at all. However, this only holds true if the self-service tools are intuitive. Improving the searchability of help docs and ensuring that AI chatbots can handle complex queries rather than just providing generic links is essential for a high CES.
4. Reducing "Cognitive Load" in Forms
Every form field added to a sign-up or checkout process increases the cognitive load on the user. By utilizing auto-fill technologies, social logins, and progress bars, companies can significantly reduce the mental energy required to complete a transaction.
The Broader Impact on Business Growth and Operational Efficiency
The implications of prioritizing CES extend beyond mere customer retention. There is a direct correlation between low-effort experiences and employee satisfaction. When customers find it easy to interact with a brand, support staff deal with fewer frustrated, angry callers. This leads to lower agent burnout and reduced turnover in customer-facing roles.
From a financial perspective, CES is a leading indicator of Customer Lifetime Value (LTV). A low-friction environment encourages "habitual buying." When a process is effortless, it becomes the path of least resistance, making it unlikely that a customer will exert the "effort" required to research and switch to a new provider.
In an era of hyper-competition, where products and prices are often nearly identical, the "ease of doing business" becomes the ultimate competitive advantage. Companies that master the art of friction reduction—using tools like VWO Pulse to capture real-time sentiment and AI-driven insights to iterate on user flows—will consistently outperform those that focus solely on "delighting" customers with superficial gestures. The data is clear: customers do not want to be dazzled; they simply want to get things done without the struggle.