
The practice of forecasting how specific digital experiments will influence future revenue remains one of the most debated subjects within the Conversion Rate Optimization (CRO) industry. This complexity arises from a fundamental uncertainty: the difficulty in determining whether a observed 10% lift in a controlled experiment will consistently translate into a 10% increase in total monthly revenue once a change is permanently implemented. Even when experimental results are statistically valid and account for the specific volume of users exposed to a variation, a myriad of external and internal variables can obscure the actual financial outcome. This challenge underscores the necessity of moving beyond simple arithmetic toward a sophisticated, conservative modeling approach that satisfies the rigorous demands of executive-level financial reporting.

The Statistical Foundation of Revenue Attribution
To understand why revenue forecasting is often met with skepticism, one must first examine the methodologies used to establish causality. In the digital commerce space, A/B testing—or randomized controlled trials—serves as the gold standard for proving that a specific change caused a specific behavior. This method is preferred over pre- and post-comparison models, which are notoriously unreliable due to "noise" in the data. For instance, if a website’s performance drops by 10% due to external economic shifts at the same time a CRO team implements a change that boosts performance by 10%, a pre/post analysis would suggest the change had zero impact. In reality, the experiment prevented a significant loss.
The transition from raw data to a revenue forecast requires robust statistical parameters. For an experiment to serve as a reliable input for a financial model, it must be adequately powered. This involves several critical components:

- Statistical Significance: Ensuring that the observed difference between a control and a variant is not due to random chance, typically targeted at a 95% confidence level.
- Sample Size and Duration: Running tests long enough to capture diverse user behaviors across different days of the week and traffic cycles.
- Minimum Detectable Effect (MDE): Defining the smallest improvement that is worth the cost of implementation.
By adhering to these standards, practitioners can provide executives with the same level of confidence used in medical trials or scientific research, establishing a factual basis for the projected financial impact.
External Variables and the Complexity of Modern Markets
A primary reason revenue projections often fail to match reality is the influence of factors outside the CRO team’s control. A digital ecosystem is not a static environment; it is a shifting landscape influenced by competitors, marketing strategies, and macroeconomic trends. Common disruptors include:
- Advertising Fluctuations: A reduction in ad spend or a shift in targeting can change the quality and intent of the traffic reaching a website, potentially neutralizing the gains made through on-site optimization.
- Competitive Landscape: If a major competitor launches a disruptive pricing strategy or outranks the site for high-value keywords during the implementation phase, the "lift" from a successful experiment may be masked by an overall decline in market share.
- Seasonal and Economic Shifts: Holidays, global supply chain issues, or shifts in consumer confidence can drastically alter baseline revenue, making it difficult to isolate the contribution of a single website modification.
Recognizing these factors is essential for maintaining credibility with financial stakeholders. It shifts the conversation from "we will definitely make X dollars" to "based on our controlled model, this implementation is contributing Y value to the total revenue stack."
The Necessity of Conservative Modeling
The CRO industry is frequently criticized for "case study math," where a 10% lift in a test is simply multiplied by annual revenue to claim millions of dollars in gains. Such calculations are rarely accurate because they fail to account for the "haircut" required by real-world implementation. A realistic revenue forecast must be conservative by design, incorporating three primary adjustments:
1. The Implementation Haircut
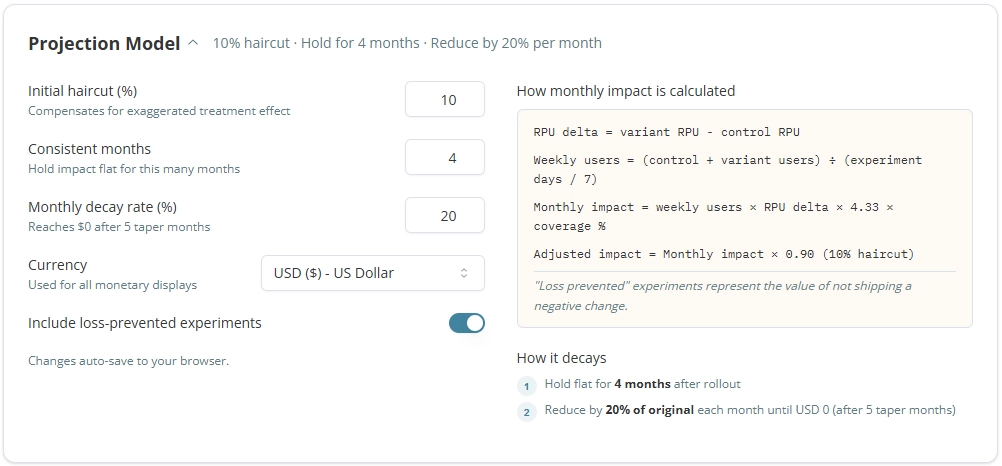
The "haircut" is a deliberate reduction in the projected lift to account for the discrepancy between a testing environment and a live production environment. Standard practice often involves taking a 10% to 20% deduction from the observed lift. This accounts for technical regressions, minor bugs during the full rollout, and the fact that a test variant might perform slightly differently when 100% of the audience is exposed to it over a long duration.
2. Rollout Coverage and Traffic Segments
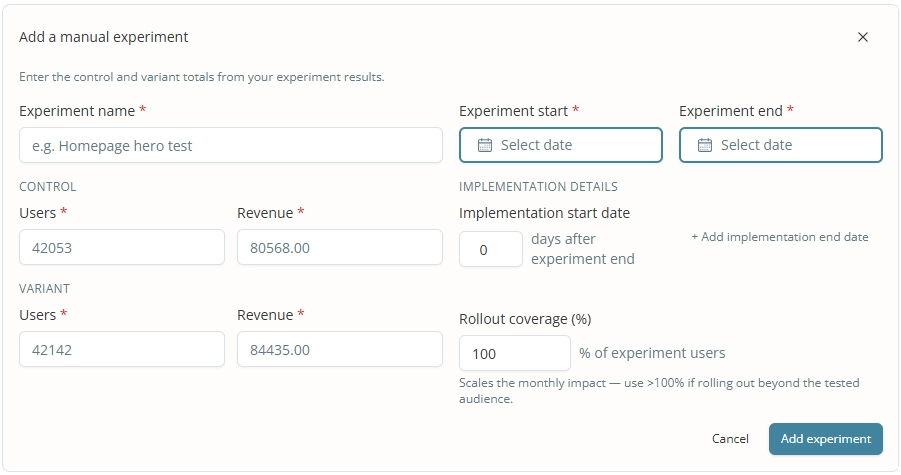
Not every experiment applies to every user. If a change is tested exclusively on a mobile product page, the revenue projection must only apply to the proportion of traffic that visits that specific page on mobile devices. Conversely, if a change tested on a single product page is rolled out across the entire site, the "rollout coverage" might exceed 100% of the original test traffic, requiring a calculated scale-up of the projected impact.
3. The Decay Rate
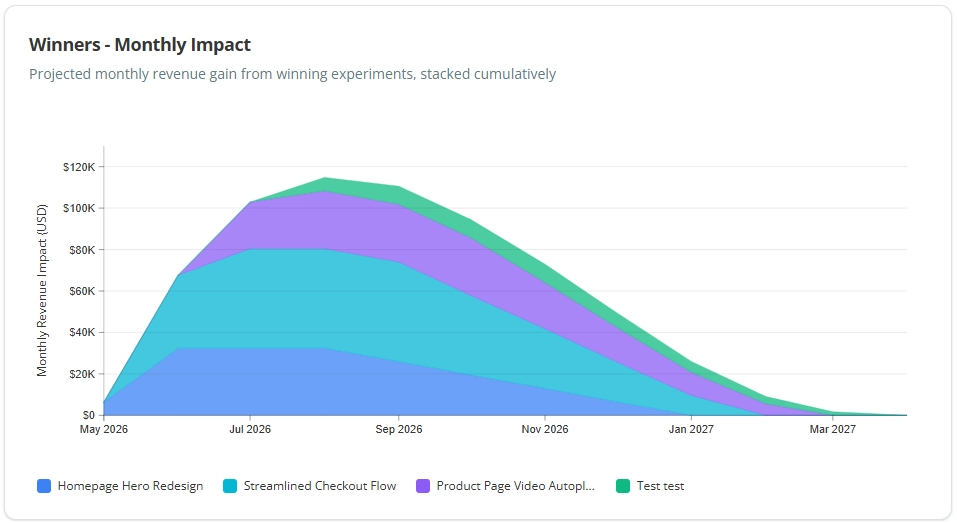
The impact of a winning experiment is rarely permanent. Consumer preferences evolve, and "novelty effects"—where users react positively to a change simply because it is new—eventually wear off. A sophisticated model incorporates a decay rate, such as holding the impact steady for four to six months and then gradually reducing its projected contribution by 20% per month until it reaches zero. This reflects the reality that the "new" baseline eventually becomes the standard, and further optimization is required to maintain growth.
A Step-by-Step Methodology for Revenue Calculation
To produce a professional-grade revenue impact report, practitioners must follow a structured process that can be audited by financial teams. The calculation for a single winning experiment generally follows this chronology:

- Determine Baseline Revenue per User (RPU): Calculate the RPU for the control group during the test period.
- Identify the Lift: Subtract the control RPU from the variant RPU to find the raw improvement.
- Apply the Haircut: Reduce this lift by a conservative percentage (e.g., 10%).
- Calculate Monthly Volume: Estimate the number of users expected to be exposed to the change in a standard 30-day period.
- Project Monthly Gain: Multiply the adjusted lift by the monthly user volume.
- Stack and Decay: Add the projected gains from multiple experiments chronologically, applying the decay rate to older tests as new ones are implemented.
This stacking method creates a cumulative view of how the experimentation program is building "revenue layers" over time. It allows stakeholders to see not just individual wins, but the total momentum of the optimization strategy.
Leveraging Specialized Analytics Tools
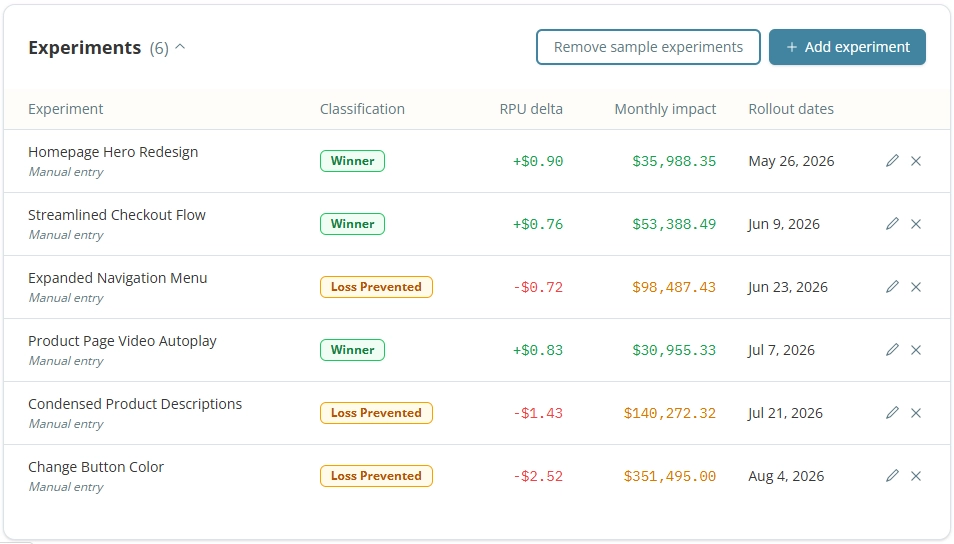
The manual effort required to maintain these complex models has led to the rise of specialized experimentation analytics tools. Platforms like Katsed and other dedicated CRO reporting suites have begun integrating revenue impact reporting directly into their dashboards. These tools automate the classification of experiments as "Winners" or "Losses Prevented" and allow for the customization of projection parameters.
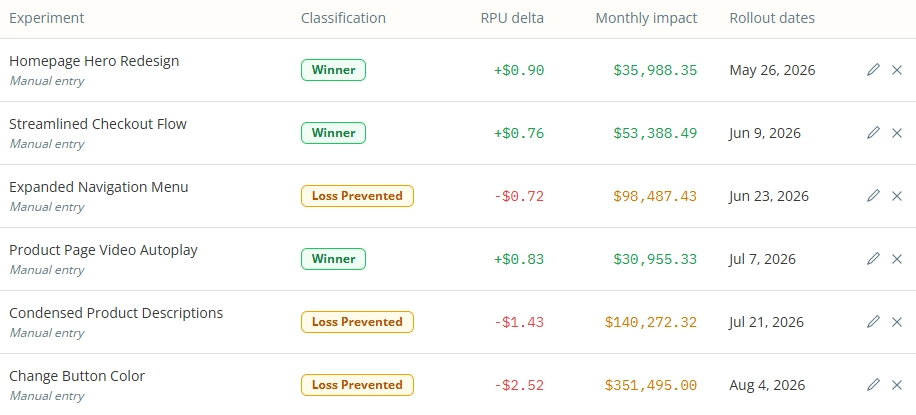
By using automated tools, teams can toggle between different currencies, adjust rollout coverage, and include or exclude "loss-prevented" data. This automation reduces human error in spreadsheets and provides a "single source of truth" that can be shared across departments, from engineering to the executive suite.
Stakeholder Communication and the C-Suite Perspective
At the executive level, the nuances of p-values and sample sizes are often secondary to the bottom-line impact. CFOs and CEOs operate in a world of estimates, projections, and models. They do not expect 100% accuracy, but they do expect a logical, transparent methodology.
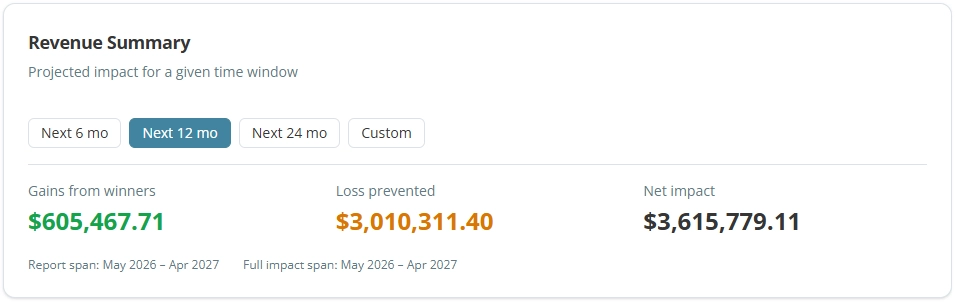
When presenting revenue forecasts, it is vital to make the underlying assumptions explicit. Reporting that "Experiment X contributed $50,000 this month based on a 10% conservative model" is far more persuasive than claiming a "permanent $1 million increase." This transparency builds trust and positions the CRO team as a disciplined financial contributor rather than a source of "vanity metrics."
Analyzing Return on Investment (ROI)
The revenue side of the equation is only half of the story; true business value is determined by comparing these gains against the cost of the program. A comprehensive ROI analysis should include:
- Human Capital: The salaries of the CRO specialists, designers, and analysts.
- Engineering Opportunity Cost: The percentage of developer time dedicated to building and implementing tests.
- Tooling Costs: Fees for A/B testing platforms, session recording tools, and analytics software.
By subtracting these costs from the projected (and decayed) revenue gains, a program can demonstrate its net contribution to the company’s profitability. This level of analysis transforms CRO from a "marketing expense" into a "profit center."
Conclusion: Experimentation as a Strategic Financial Asset
Forecasting revenue from experiments is not an exact science, but it is an essential discipline for the maturity of the CRO industry. By moving away from aggressive, unrealistic claims and toward conservative, decayed models, practitioners can provide a realistic view of how digital changes influence the bottom line.

While external market factors will always introduce a degree of volatility, the use of randomized controlled trials remains the most reliable method for proving causality. When these results are processed through a rigorous financial model, they offer a powerful narrative of growth and risk mitigation. Ultimately, the goal of revenue forecasting is not to predict the future with perfect accuracy, but to provide a structured, data-driven framework that demonstrates the tangible value of a continuous experimentation culture.