

The practice of conversion rate optimization (CRO) has evolved from a niche marketing tactic into a core business strategy for digital-first enterprises. However, as the industry matures, a persistent point of contention remains: the accuracy of revenue forecasting based on experimental data. While data scientists and marketing executives agree that testing is essential for growth, the translation of a specific percentage "lift" found in a controlled experiment into a definitive increase in monthly or annual revenue is fraught with statistical and operational complexities.

The core of the controversy lies in the gap between experimental results and long-term financial realization. Practitioners often struggle to explain why a 10% lift in a localized A/B test does not always result in a corresponding 10% increase in the company’s total monthly revenue. This discrepancy is not necessarily a failure of the test itself, but rather a reflection of the myriad external variables that influence global business performance.
The Challenge of Proving Causality in a Dynamic Market
Forecasting the effect of experiments on future revenue is difficult because digital environments are never static. Unlike a laboratory, an e-commerce platform or a SaaS website is subject to constant fluctuations in traffic quality, competitor behavior, and economic shifts. Even when a result is statistically valid, the transition from a test environment to a permanent implementation introduces new variables.

A/B testing remains the gold standard for proving causality precisely because it mitigates the "pre/post comparison" fallacy. In a pre/post analysis, a business implements a change and compares performance from the following month to the previous month. If revenue drops by 10%, the change is deemed a failure. However, this ignores the possibility that revenue might have dropped by 20% due to an external factor—such as a new competitor outranking the site for key search terms—meaning the implemented change actually provided a net positive impact.
Controlled, randomized A/B tests allow organizations to isolate the impact of a specific variable by comparing two groups of users simultaneously. This methodology is the same used in clinical trials for life-saving pharmaceuticals. If the statistical rigor is sufficient to satisfy the medical community, it is generally considered robust enough to inform executive-level business decisions.
Establishing Statistical Rigor for Financial Projections
For a revenue forecast to hold weight with a Chief Financial Officer (CFO) or a board of directors, the underlying experiments must meet high standards of statistical integrity. The quality of any forecast is a direct reflection of the data fed into the model.
Key parameters for robust experimentation include:
- Statistical Power: Ensuring the sample size is large enough to detect a meaningful difference between the control and the variant.
- Confidence Levels: Maintaining a standard (typically 95%) that the observed lift is not due to random chance.
- Minimum Detectable Effect (MDE): Defining the smallest improvement that would justify the cost of implementing the change permanently.
Without these safeguards, revenue projections become little more than "vanity metrics." Industry data suggests that a significant portion of reported CRO wins are actually "false positives" caused by stopping tests too early or failing to account for variance in user behavior. To combat this, mature optimization programs are moving toward more conservative, evidence-based modeling.
The Fallacy of Linear Scaling
One of the most common mistakes in revenue forecasting is the "million-dollar case study" logic. In this scenario, a company with $50 million in annual revenue runs a test showing a 10% lift and concludes they have just added $5 million to their bottom line. In reality, this linear scaling is rarely accurate for three primary reasons.
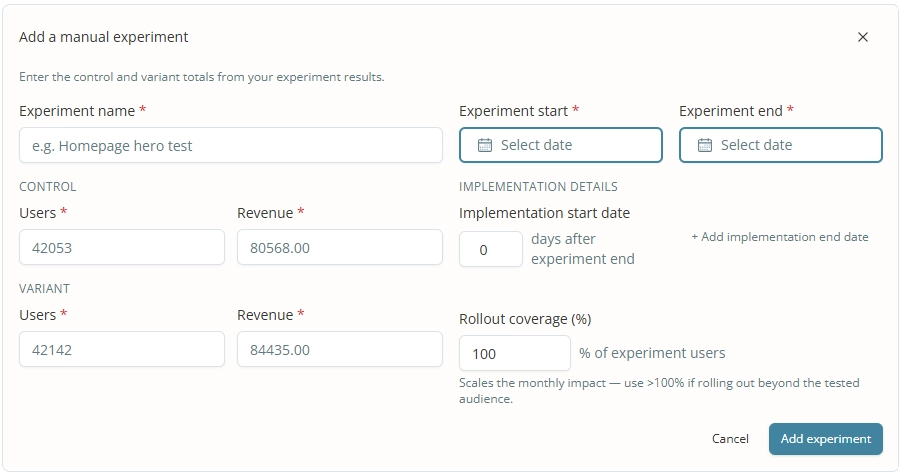
First, the "Novelty Effect" often inflates initial results. Users may interact with a new design element simply because it is different, but this engagement often tapers off as the change becomes part of the standard user experience. Second, regression to the mean suggests that extreme results in a short-term test are likely to stabilize at a lower level over time. Third, the "Rollout Coverage" is rarely 100%. A test conducted on a specific landing page only affects the segment of traffic that visits that page; it does not lift the revenue of the entire organization proportionally.
Building a Conservative Revenue Forecast Model
To maintain credibility within an organization, CRO practitioners are encouraged to adopt a conservative approach to forecasting. This involves applying "haircuts" to experimental data to account for the uncertainty of the real world. A standard conservative model typically includes several layers of adjustment:

The 10% "Haircut"
Standard practice among veteran optimizers is to immediately reduce the observed lift by 10%. This serves as a buffer against statistical noise and the slight differences between the testing tool’s tracking and the company’s internal financial records.
The Steady State and Decay Model
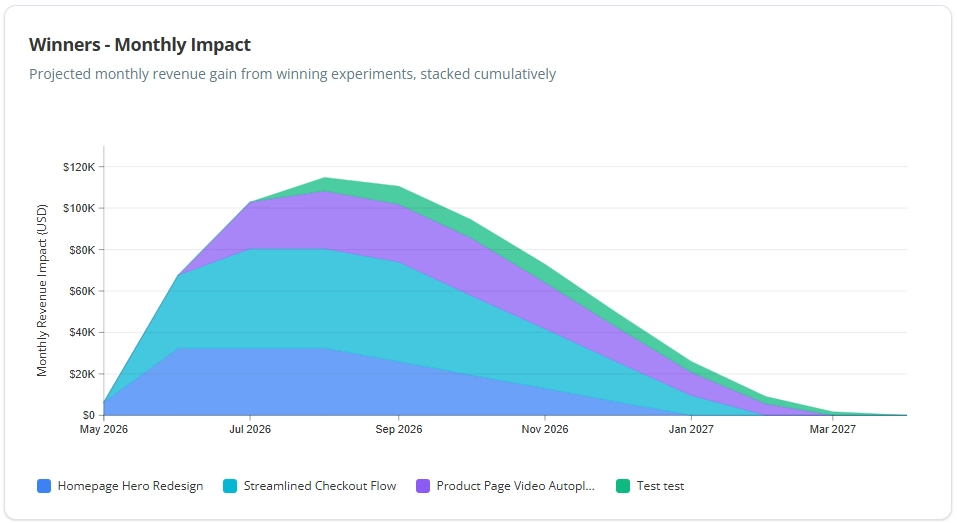
A winning experiment does not produce a permanent, static lift forever. Markets evolve, and what worked in January may be less effective by December. A realistic model might hold the full projected impact steady for a period of four months, followed by a monthly decay rate (such as 20%) as the competitive advantage of that specific optimization diminishes.
Implementation Delays and Coverage Adjustments
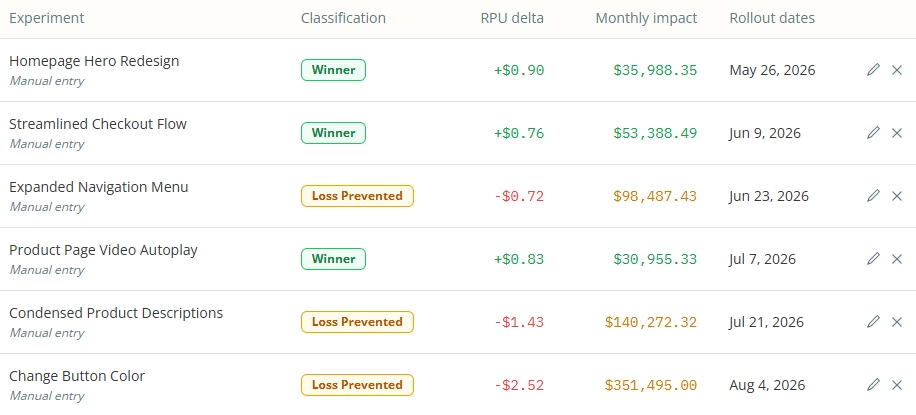
Revenue impact does not begin the moment a test ends; it begins the moment the winning variant is fully coded and deployed by the engineering team. Furthermore, the forecast must account for "Rollout Coverage." If an experiment was tested on only 20% of the site’s total traffic, the revenue impact should be calculated based only on that 20% segment, unless the change is being expanded to the entire site.
Quantitative Calculation of Impact
The actual calculation for a single experiment’s projected impact follows a specific formula:
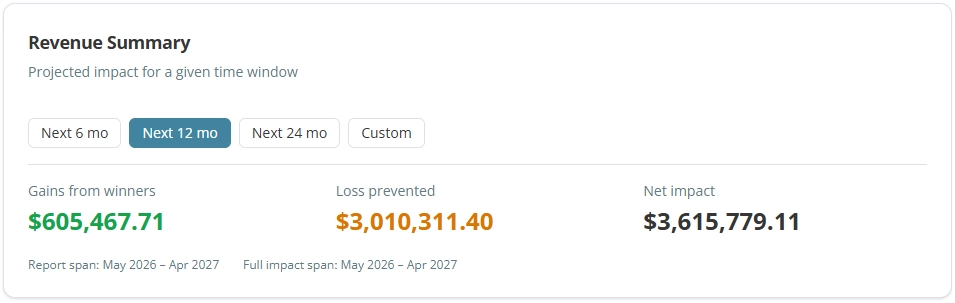
- Identify the Revenue Per User (RPU) of the control group.
- Identify the RPU of the winning variant.
- Calculate the lift (Variant RPU – Control RPU).
- Multiply this lift by the number of users expected to see the change over a specific period (e.g., monthly).
- Apply the "haircut" and "decay" factors to find the cumulative impact over a six-month or twelve-month horizon.
By repeating this process for every winning experiment and stacking the results, a business can visualize a cumulative revenue growth chart. This "stacking" effect demonstrates how multiple small wins compound over time to create significant financial shifts.
The Role of Analytics and Specialized Tooling
As the complexity of these calculations grows, many organizations are turning to specialized experimentation analytics tools, such as Katsed, to automate the reporting process. These tools allow teams to enter raw experiment data—users, revenue, start dates, and end dates—to generate automated impact reports.
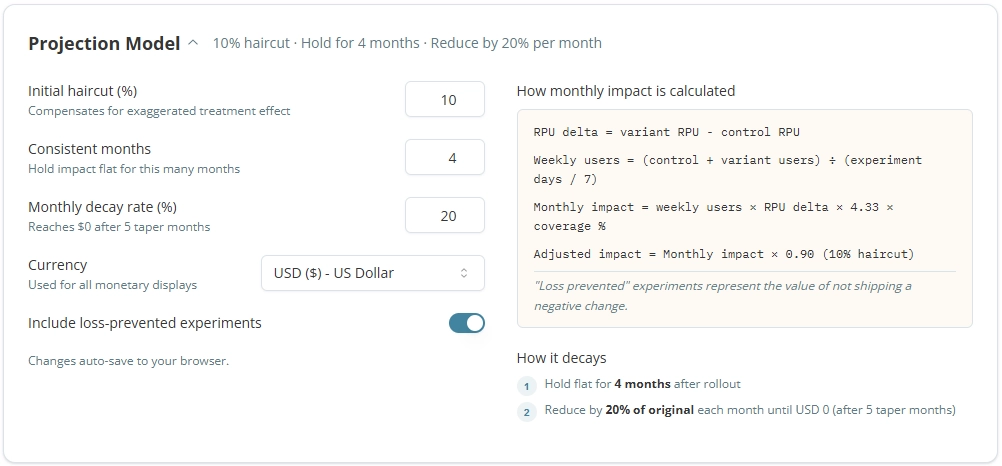
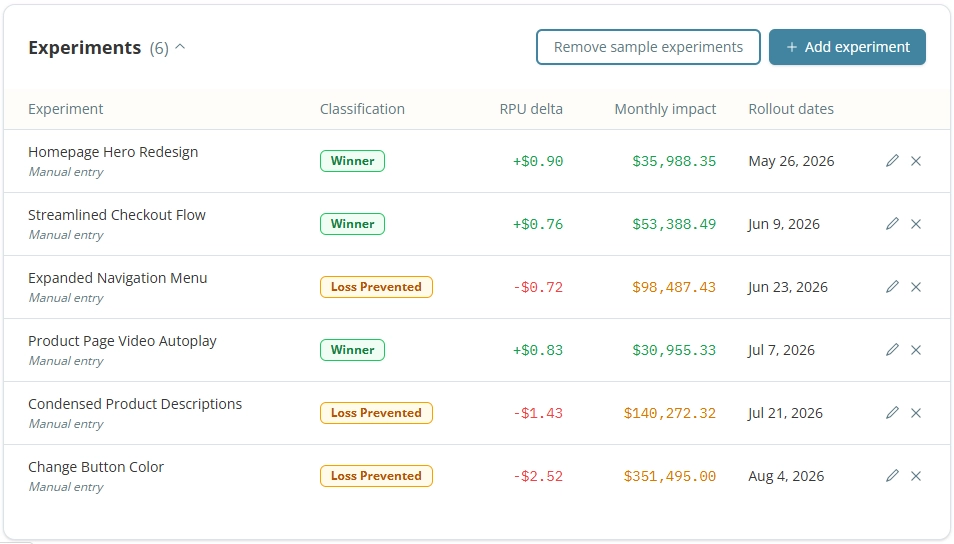
These systems are particularly useful for distinguishing between "Winners" (experiments that increased RPU) and "Loss Prevented" scenarios. A "Loss Prevented" report quantifies the revenue that would have been lost if a poorly performing feature or marketing campaign had been rolled out without testing. While harder to celebrate than a direct revenue gain, loss prevention is a critical component of a CRO program’s total value proposition.
Integrating Revenue Forecasts with ROI Analysis
A revenue forecast is only half of the financial equation. To prove the true value of an optimization program, the projected gains must be measured against the cost of the program. This calculation, known as Return on Investment (ROI), includes several key expenditure categories:

- Personnel Costs: Salaries for CRO strategists, data analysts, and UX designers.
- Engineering Capacity: The cost of developer time used to build tests and implement winners.
- Software Fees: Subscriptions for A/B testing platforms, heatmapping tools, and analytics suites.
By comparing the cumulative projected revenue gain against these operational costs, organizations can determine the "payback period" of their testing program. If a program costs $200,000 per year but generates a conservative, decay-adjusted revenue lift of $1.2 million, the 6x ROI provides a compelling case for further investment.
Conclusion: Embracing the Model, Not the Crystal Ball
The shift toward revenue forecasting in CRO represents the professionalization of the industry. While it is impossible to predict the future with 100% accuracy, the use of conservative, transparent models allows experimentation teams to speak the language of the C-suite.

The goal of forecasting is not to provide an infallible number, but to provide a realistic estimate based on the best available data. By moving away from inflated case studies and toward robust, decay-adjusted projections, CRO practitioners can demonstrate the tangible value of their work while maintaining the trust of their financial stakeholders. As digital competition intensifies, the ability to accurately model the financial impact of every website change will become a prerequisite for sustainable growth in the modern economy.