In the current landscape of digital commerce, optimization programs are frequently measured by a tally of successful A/B tests and incremental wins. However, a significant gap remains between reporting a "winning" experiment and demonstrating to a Chief Financial Officer (CFO) exactly how much revenue that win contributed to the bottom line. While this discrepancy is often categorized as a reporting or attribution failure, industry experts suggest the problem originates much earlier in the process: specifically, in the criteria teams use to determine which customer data is actionable.
Customer data serves as a value creator only when it facilitates a shift in decision-making that results in an outcome exceeding the costs of implementation and long-term maintenance. For digital marketing and product teams, the central challenge is identifying which segments of customer data meet this threshold before significant resources are invested in personalization infrastructure.
The Personalization Paradox: Correlation vs. Causality
A widely cited study by McKinsey & Company indicates that faster-growing companies generate approximately 40% more of their revenue from personalization than their slower-growing counterparts. While many organizations interpret this as definitive proof that personalization is the primary engine of revenue growth, a deeper analysis suggests a more nuanced reality. The data identifies a correlation—successful companies tend to personalize—but it does not account for the resources these companies already possess. Fast-growing firms typically have larger budgets, superior data architecture, and more specialized personnel. In many instances, personalization is a luxury afforded by growth rather than the sole catalyst for it.
The danger of misinterpreting such data is illustrated by a landmark study conducted by researchers at Yahoo. The team examined whether display advertisements increased the likelihood of users searching for a specific brand. When using observational data—comparing users who saw the ads to those who did not—the apparent "lift" in search behavior ranged from 870% to 1,200%. However, when the researchers employed a randomized holdout group (a true experimental design), the actual lift was revealed to be only 5.4%.
This discrepancy, later highlighted by experts Ron Kohavi and Stefan Thomke in the Harvard Business Review, demonstrates the "selection bias" inherent in most customer data. Data is excellent at describing how current customers behave, but it is often poor at predicting how those same customers will respond to a modified experience. Consequently, many highly researched audience segments generate significant operational work without producing incremental revenue.

Defining the Crossover Test
The fundamental error in many personalization strategies is the assumption that different customers inherently require different digital experiences. In reality, a superior user interface or a more persuasive value proposition often performs better across all demographics.
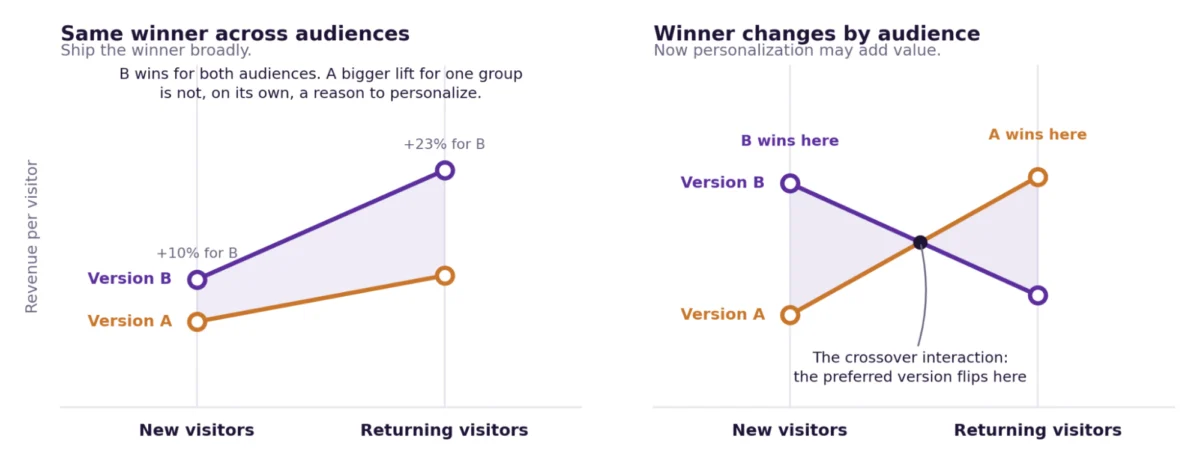
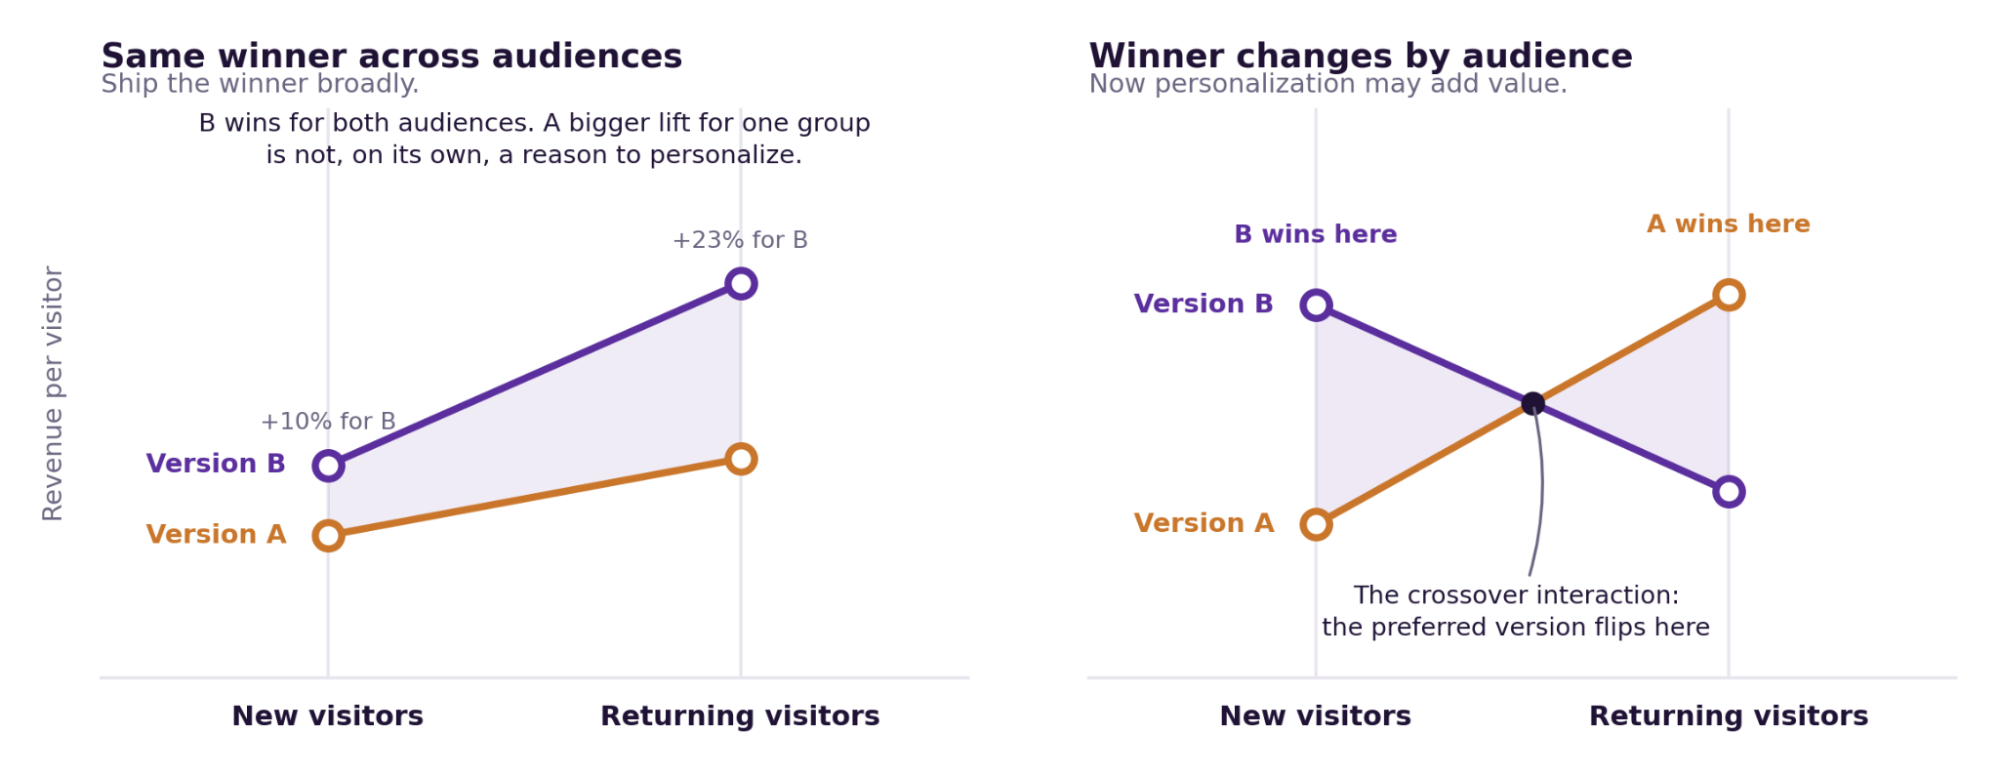
Consider a hypothetical test on a product detail page where Version B outperforms Version A by an average of 5%. When the data is segmented, the results show that Version B wins by 3% among new visitors and by 9% among returning customers. At first glance, the 9% lift suggests a personalization opportunity for returning users. However, because Version B is the winner for both groups, the most efficient business decision is to deploy Version B to the entire audience. Creating a separate, personalized experience for returning customers in this scenario adds technical debt and operational costs without changing the optimal decision.
The case for personalization only becomes mathematically sound when a "crossover interaction" occurs. A crossover interaction happens when Version B wins for Segment X, but Version A wins for Segment Y. In this instance, the best decision changes based on the audience. If the same version wins across all segments, a complex targeting strategy creates an immediate disadvantage, requiring more rules, more creative assets, and more Quality Assurance (QA) testing to achieve a result that could have been reached by simply "shipping the winner."
The Wharton Study: Why Data Quality Trumps Algorithm Sophistication
Recent research from the Wharton School at the University of Pennsylvania provides a quantitative look at the value of acting on customer differences. Researchers Anya Shchetkina and Ron Berman conducted two large-scale field studies testing five common personalization methods. Despite both studies having nearly identical setups—roughly 20 variations and similar performance benchmarks—the results were drastically different.
In the first study, personalization outperformed a universal rollout of the best version by 18%. In the second study, the gain was a mere 4%. The variable was not the sophistication of the personalization algorithm, but rather the nature of the customer data. The data in the first study successfully identified groups that responded differently to the experiences, whereas the data in the second study did not.
This leads to a critical industry takeaway: increasing the volume of customer data does not automatically increase the ROI of personalization. Value is only added when data identifies meaningful differences in how customers respond to specific stimuli. Many organizations currently over-invest in data collection while under-investing in the "response" testing required to validate that data’s utility.

The Four-Question Diagnostic for Personalization ROI
To prevent the proliferation of low-value personalization rules, organizations are encouraged to apply a four-question diagnostic before building any segment-specific experience:
- Does the winner change, or is it just a difference in lift?
Teams must look for a "flip" in preference. If Segment A prefers Version B and Segment B also prefers Version B (even if more strongly), personalization is likely unnecessary. - Was the segment defined a priori?
Data mining after a test is completed often leads to "p-hacking" or finding patterns in random noise. A segment discovered post-hoc should be treated as a new hypothesis to be tested, not a proven conclusion. - Is the signal actionable in real-time?
If a crossover is based on a metric like "lifetime value," but the system cannot identify the customer until they have already completed a purchase, the data cannot influence the current session. - Does the incremental value exceed the operational cost?
Every personalized experience carries a "carry cost," including content production, QA, platform fees, and reporting overhead.
The Financial Reality: Calculating the Minimum Lift Needed
The most critical step in the diagnostic process is the "Minimum Lift Needed" calculation. Before committing to a personalization project, teams must determine the break-even point using the following formula:
Minimum Lift Needed = (Annualized Incremental Cost of Personalization) / (Annual Profit Generated by the Target Group)
For example, consider a website with 2,000,000 annual visits. If a specific segment represents 12% of traffic (240,000 visits) and generates $960,000 in annual revenue at a 40% profit margin ($384,000), the baseline is set. If the cost to maintain a personalized rule for this group (including creative and technical maintenance) is $18,000 per year, the personalization must generate a minimum revenue lift of 4.7% just to break even. If a test shows a 3% lift, the company actually loses $6,500 annually by maintaining that personalization, despite the test being a "winner" in the analytics tool.
This financial reality was evidenced in a case study involving a major travel and hospitality brand. The company tested a personalized landing page for repeat visitors who had previously viewed premium properties. While the test showed a 6% lift in revenue, the small size of the audience and the high cost of maintaining seasonal creative assets meant the project would lose $1,500 per year. The company ultimately shelved the personalization in favor of a broader site improvement that offered a higher ROI.
Long-term Measurement and Persistent Holdouts
Even when individual personalizations pass the crossover test, the cumulative impact of an optimization program can be difficult to track. Experts Minyong Lee and Milan Shen at Airbnb have studied this extensively, proposing the use of "persistent holdout groups."
By keeping a small percentage of traffic (e.g., 1-5%) away from all personalized experiences and site changes over a long period, organizations can measure the true aggregate lift of their program. This provides a credible, "finance-approved" estimate of the program’s contribution to the company’s bottom line, stripping away the inflation often seen in individual test reports.
Implications for Digital Strategy
The move toward more rigorous personalization standards suggests a shift in how Customer Data Platforms (CDPs) and experimentation tools are used. Rather than creating hundreds of small, unverified targeting rules, the most successful teams are focusing on "better signals."
Platforms like the Wingify Data Platform are increasingly used to create unified customer profiles that bring together behavioral, purchase, and CRM data. This allows teams to develop more sophisticated hypotheses about where true response differences might exist. When a genuine crossover is confirmed, tools like the Wingify Personalization Suite can then be used to deploy and monitor these experiences at scale.
The ultimate goal for modern optimization is not to personalize for the sake of personalization, but to identify the specific instances where a different experience leads to a different—and more profitable—decision. For most organizations, the path to higher revenue lies not in more data, but in the disciplined application of the Crossover Test to the data they already have.